Activity Inequality (original) (raw)
Large-scale physical activity data reveal
worldwide activity inequality.
Activity Inequality Project
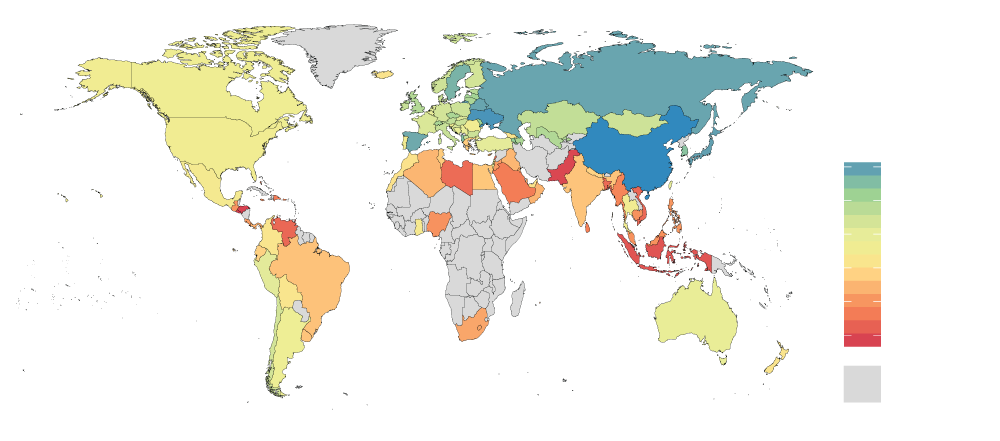
Smartphone data from over 68 million days of activity by 717,527 individuals across 111 countries reveal variability in physical activity across the world. 
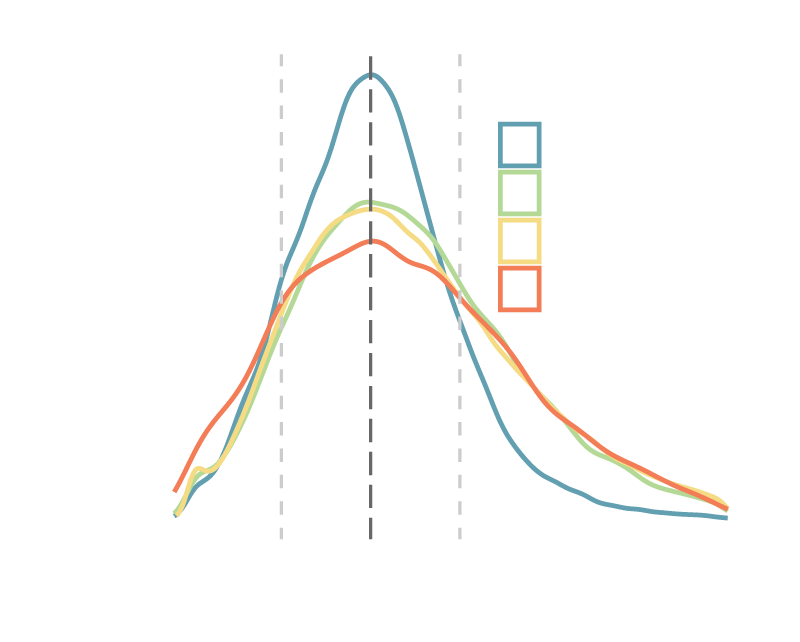
The variance of activity around the population mode differs between countries. Curves show distribution of steps across the population relative to the population mode. In Japan, the activity of 76% of the population falls within 50% of the mode (i.e., between white dashed lines), whereas in Saudi Arabia this fraction is only 62%. The United Kingdom and United States lie between these two extremes for average activity level and variance.
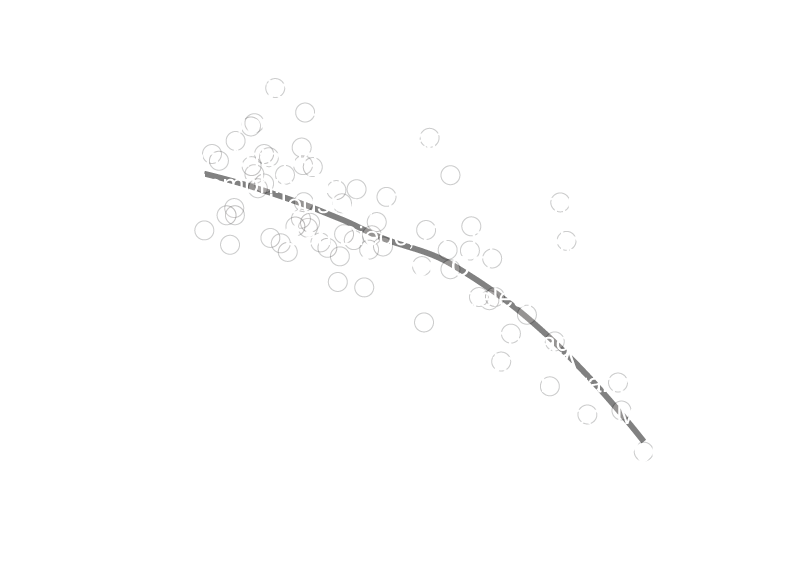
Activity inequality predicts obesity. Individuals in the five countries with highest activity inequality are 196% more likely to be obese than individuals from the 5 countries with lowest activity inequality.
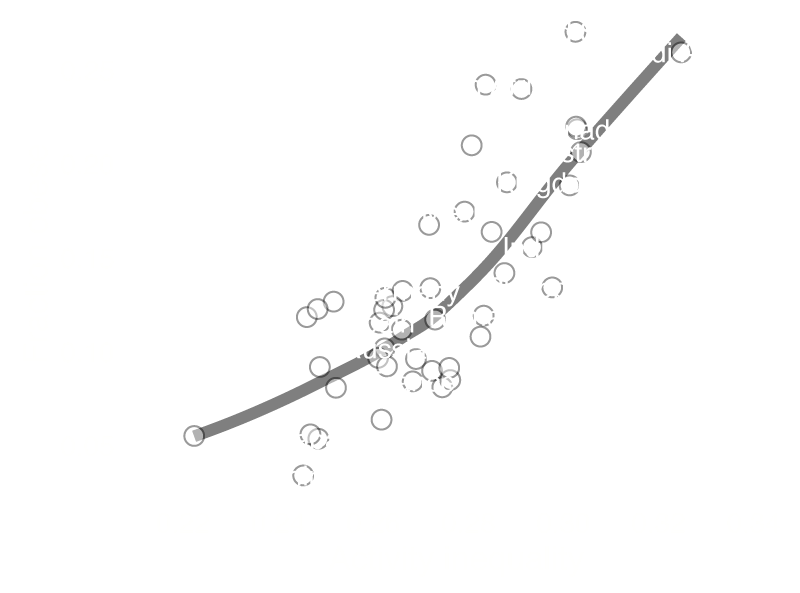
Aspects of the built environment, such as walkability, may mitigate activity inequality. Higher walkability scores are associated with lower activity inequality based on data from 69 United States cities.
Paper
Research paper in Nature (547.7663)
Paper PDF
Paper Supplementary Information
Abstract: Understanding the basic principles that govern physical activity is needed to curb the global pandemic of physical inactivity and the 5.3 million deaths per year associated with inactivity. Our knowledge, however, remains limited owing to the lack of large-scale measurements of physical activity patterns across free-living populations worldwide. Here, we leverage the wide usage of smartphones with built-in accelerometry to measure physical activity at planetary scale. We study a dataset consisting of 68 million days of physical activity for 717,527 people, giving us a window into activity in 111 countries across the globe. We find inequality in how activity is distributed within countries and that this inequality is a better predictor of obesity prevalence in the population than average activity volume. Reduced activity in females contributes to a large portion of the observed activity inequality. Aspects of the built environment, such as the walkability of a city, were associated with less gender gap in activity and activity inequality. In more walkable cities, activity is greater throughout the day and throughout the week, across age, gender, and body mass index (BMI) groups, with the greatest increases in activity for females. Our findings have implications for global public health policy and urban planning and highlight the role of activity inequality and the built environment for improving physical activity and health.
Data
We analyzed 68 million days of physical activity based on smartphone measurements from 717,527 people in 111 countries across the globe.
Our data and code are available at Github.
Countries by Activity Inequality
We rank countries by activity inequality where lower values correspond to a more equal distribution of physical activity (using the Gini coefficient ranging from 0 to 1).
The following table and more data are also available here.
| Rank | Country | Activity Inequality |
|---|---|---|
| 1 | Hong Kong | 22.2 |
| 2 | China | 24.5 |
| 3 | Sweden | 24.6 |
| 4 | South Korea | 24.7 |
| 5 | Czech Republic | 24.8 |
| 6 | Japan | 24.8 |
| 7 | Singapore | 24.9 |
| 8 | Norway | 25.2 |
| 9 | Ukraine | 25.2 |
| 10 | Netherlands | 26.1 |
| 11 | Spain | 26.1 |
| 12 | Taiwan | 26.2 |
| 13 | Denmark | 26.2 |
| 14 | Russia | 26.2 |
| 15 | Chile | 26.3 |
| 16 | Switzerland | 26.3 |
| 17 | Turkey | 26.4 |
| 18 | Finland | 26.6 |
| 19 | Germany | 26.6 |
| 20 | France | 26.8 |
| 21 | Poland | 26.9 |
| 22 | Brazil | 27.2 |
| 23 | Israel | 27.2 |
| 24 | Thailand | 27.2 |
| 25 | Hungary | 27.3 |
| 26 | Italy | 27.5 |
| 27 | Portugal | 27.6 |
| 28 | Belgium | 27.6 |
| 29 | Mexico | 27.9 |
| 30 | United Arab Emirates | 28.1 |
| 31 | Indonesia | 28.3 |
| 32 | Romania | 28.3 |
| 33 | South Africa | 28.4 |
| 34 | Ireland | 28.5 |
| 35 | Malaysia | 28.8 |
| 36 | United Kingdom | 28.8 |
| 37 | Qatar | 29.1 |
| 38 | India | 29.3 |
| 39 | Greece | 29.5 |
| 40 | Philippines | 29.8 |
| 41 | New Zealand | 30.1 |
| 42 | United States | 30.3 |
| 43 | Egypt | 30.3 |
| 44 | Canada | 30.3 |
| 45 | Australia | 30.4 |
| 46 | Saudi Arabia | 32.5 |


