collectl (original) (raw)
To use it download the tarball, unpack it and run ./INSTALL
Collectl now supports OpenStack Clouds
Colmux now part of collectl package
Looking for colplot? It's now here!
Remember, to get lustre support contact Peter Piela to get his custom plugin.
Home | Architecture | Features | Documentation |Releases |FAQ |Support | News | Acknowledgements
There are a number of times in which you find yourself needing performance data. These can include benchmarking, monitoring a system's general heath or trying to determine what your system was doing at some time in the past. Sometimes you just want to know what the system is doing right now. Depending on what you're doing, you often end up using different tools, each designed to for that specific situation.
Unlike most monitoring tools that either focus on a small set of statistics, format their output in only one way, run either interatively or as a daemon but not both, collectl tries to do it all. You can choose to monitor any of a broad set of subsystems which currently include buddyinfo, cpu, disk, inodes, infiniband, lustre, memory, network, nfs, processes, quadrics, slabs, sockets and tcp.
The following is an example taken while writing a large file and running the collectl command with no arguments. By default it shows cpu, network and disk stats in_brief format_. The key point of this format is all output appears on a single line making it much easier to spot spikes or other anomalies in the output:
collectl
#<--------CPU--------><-----------Disks-----------><-----------Network----------> #cpu sys inter ctxsw KBRead Reads KBWrit Writes netKBi pkt-in netKBo pkt-out 37 37 382 188 0 0 27144 254 45 68 3 21 25 25 366 180 20 4 31280 296 0 1 0 0 25 25 368 183 0 0 31720 275 2 20 0 1
In this example, taken while writing to an NFS mounted filesystem, collectl displays interrupts, memory usage and nfs activity with timestamps. Keep in mind that you can mix and match any data and in the case of brief format you simply need to have a window wide enough to accommodate your output.
collectl -sjmf -oT
<-------Int--------><-----------Memory-----------><------NFS Totals------>
#Time Cpu0 Cpu1 Cpu2 Cpu3 Free Buff Cach Inac Slab Map Reads Writes Meta Comm 08:36:52 1001 66 0 0 2G 201M 609M 363M 219M 106M 0 0 5 0 08:36:53 999 1657 0 0 2G 201M 1G 918M 252M 106M 0 12622 0 2 08:36:54 1001 7488 0 0 1G 201M 1G 1G 286M 106M 0 20147 0 2
You can also display the same information in verbose format, in which case you get a single line for each type of data at the expense of more screen real estate, as can be seen in this example of network data during NFS writes. Note how you can actually see the network traffic stall while waiting for the server to physically write the data.
collectl -sn --verbose -oT
NETWORK SUMMARY (/sec)
KBIn PktIn SizeIn MultI CmpI ErrIn KBOut PktOut SizeO CmpO ErrOut
08:46:35 3255 41000 81 0 0 0 112015 78837 1454 0 0 08:46:36 0 9 70 0 0 0 29 25 1174 0 0 08:46:37 0 2 70 0 0 0 0 2 134 0 0
In this last example we see what detail format looks like where we see multiple lines of output for a partitular type of data, which in this case is interrupts. We've also elected to show the time in msecs as well.
collectl -sJ -oTm
Int Cpu0 Cpu1 Cpu2 Cpu3 Type Device(s)
08:52:32.002 225 0 4 0 0 IO-APIC-level ioc0 08:52:32.002 000 1000 0 0 0 IO-APIC-edge timer 08:52:32.002 014 0 0 18 0 IO-APIC-edge ide0 08:52:32.002 090 0 0 0 15461 IO-APIC-level eth1
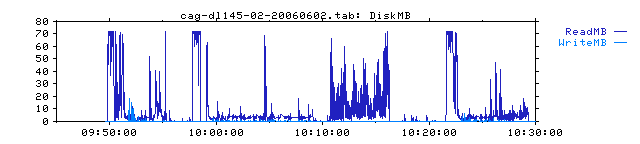
Collectl output can also be saved in a rolling set of logs for later playback or displayed interactively in a variety of formats. If all that isn't enough there are plugins that allow you to report data in alternate formats or even send them over a socket to remote tools such as ganglia or graphite. You can even create files in space-separated format for plotting with external packages like gnuplot. The one below was created with colplot, part of the collectl utilities project, which provides a web-based interface to gnuplot.
Are you a big user of the top command? Have you ever wanted to look across a cluster to see what the top processes are? Better yet, how about using iostat across a cluster? Or maybe vmstat or even looking at top network interfaces across a cluster? Look no more because if collectl reports it for one node,colmux can do it across a cluster AND you can sort by any column of your choice by simply using the right/left arrow keys.
Collectl and Colmux run on all linux distros and are available in redhat and debian respositories and so getting it may be as simple as running yum or apt-get. Note that since colmux has just been merged into the collectl V4.0.0 package it may not yet be available in the repository of your choice and you should install collectl-utils V4.8.2 or earlier to get it for the time being.
Collectl requires perl which is usually installed by default on all major Linux distros and optionally uses Time::Hires which is also usually installed and allows collectl to use fractional intervals and display timestamps in msec. TheCompress::Zlibmodule is usually installed as well and if present the recorded data will be compressed and therefore use on average 90% less storage when recording to a file.
If you're still not sure if collectl is right for you, take a couple of minutes to look at the Collectl Tutorial to get a better feel for what collectl can do. Also be sure to check back and see what's new on the website, sign up for a Mailing Listor watch the Forums.
| "I absolutely love it and have been using it extensively for months." |
|---|
| Kevin Closson: Performance Architect, EMC |
| "Collectl is indispensable to any system admin." |
| Matt Heaton: President, Bluehost.com |