Pubei County (original) (raw)
From Wikipedia, the free encyclopedia
County in Guangxi, China
| Pubei County 浦北县 · Bujbwz Yen | |
|---|---|
| County | |
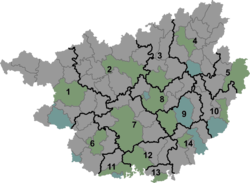
  PubeiLocation of the seat in Guangxi PubeiLocation of the seat in Guangxi |
|
| Coordinates: 22°16′19″N 109°33′25″E / 22.272°N 109.557°E / 22.272; 109.557 | |
| Country | China |
| Autonomous region | Guangxi |
| Prefecture-level city | Qinzhou |
| County seat | Xiaojiang |
| Area | |
| • Total | 2,521 km2 (973 sq mi) |
| Population (2020) | |
| • Total | 683,964 |
| • Density | 270/km2 (700/sq mi) |
| Time zone | UTC+8 (China Standard) |
Pubei County (Chinese: 浦北县; pinyin: Pǔběi Xiàn; Zhuang: Bujbwz Yen) is a county in the south of Guangxi, China. It is under the administration of Qinzhou City.
Administrative divisions
[edit]
Pubei's executive, legislature and judiciary are seated in Xiaojiang, together with its CPC and PSB branches.
Pubei includes 2 subdistricts and 15 towns:[1]
subdistricts
- Xiaojiang 小江街道
- Jiangcheng 江城街道
towns
- Quanshui 泉水镇
- Shiyong 石埇镇
- Anshi 安石镇
- Zhanghuang 张黄镇
- Dacheng 大成镇
- Baishishui 白石水镇
- Beitong 北通镇
- Sanhe 三合镇
- Longmen 龙门镇
- Fuwang 福旺镇
- Zhaixu 寨圩镇
- Lemin 乐民镇
- Liuken 六硍镇
- Pingmu 平睦镇
- Guandong 官垌镇
| Climate data for Pubei (1991–2020 normals, extremes 1981–2010) | |||||||||||||
|---|---|---|---|---|---|---|---|---|---|---|---|---|---|
| Month | Jan | Feb | Mar | Apr | May | Jun | Jul | Aug | Sep | Oct | Nov | Dec | Year |
| Record high °C (°F) | 28.7(83.7) | 32.5(90.5) | 33.1(91.6) | 34.1(93.4) | 36.0(96.8) | 36.9(98.4) | 38.6(101.5) | 38.3(100.9) | 37.2(99.0) | 35.1(95.2) | 34.1(93.4) | 29.8(85.6) | 38.6(101.5) |
| Mean daily maximum °C (°F) | 18.1(64.6) | 19.9(67.8) | 22.6(72.7) | 27.2(81.0) | 30.9(87.6) | 32.1(89.8) | 32.7(90.9) | 32.9(91.2) | 32.0(89.6) | 29.5(85.1) | 25.6(78.1) | 20.8(69.4) | 27.0(80.7) |
| Daily mean °C (°F) | 13.3(55.9) | 15.4(59.7) | 18.4(65.1) | 22.9(73.2) | 26.2(79.2) | 27.6(81.7) | 28.0(82.4) | 27.8(82.0) | 26.6(79.9) | 23.7(74.7) | 19.6(67.3) | 15.1(59.2) | 22.1(71.7) |
| Mean daily minimum °C (°F) | 10.2(50.4) | 12.3(54.1) | 15.6(60.1) | 19.9(67.8) | 22.8(73.0) | 24.7(76.5) | 24.9(76.8) | 24.7(76.5) | 23.2(73.8) | 19.8(67.6) | 15.6(60.1) | 11.3(52.3) | 18.8(65.8) |
| Record low °C (°F) | −0.8(30.6) | 0.2(32.4) | 1.6(34.9) | 8.3(46.9) | 12.5(54.5) | 16.0(60.8) | 19.2(66.6) | 20.7(69.3) | 14.7(58.5) | 8.3(46.9) | 0.9(33.6) | −1.9(28.6) | −1.9(28.6) |
| Average precipitation mm (inches) | 49.7(1.96) | 41.8(1.65) | 72.5(2.85) | 131.1(5.16) | 195.1(7.68) | 329.9(12.99) | 346.3(13.63) | 264.9(10.43) | 174.8(6.88) | 71.6(2.82) | 56.1(2.21) | 34.6(1.36) | 1,768.4(69.62) |
| Average precipitation days (≥ 0.1 mm) | 9.7 | 10.6 | 14.9 | 14.1 | 16.3 | 20.0 | 21.0 | 19.6 | 13.1 | 6.8 | 6.6 | 7.4 | 160.1 |
| Average relative humidity (%) | 79 | 81 | 84 | 83 | 83 | 85 | 85 | 85 | 82 | 76 | 75 | 73 | 81 |
| Mean monthly sunshine hours | 76.0 | 56.5 | 48.6 | 74.6 | 124.5 | 124.8 | 163.4 | 167.6 | 173.4 | 177.7 | 145.6 | 123.1 | 1,455.8 |
| Percent possible sunshine | 22 | 17 | 13 | 20 | 31 | 31 | 40 | 42 | 47 | 50 | 44 | 37 | 33 |
| Source: China Meteorological Administration[2][3] |
- ^ 2023年统计用区划代码和城乡划分代码:浦北县 (in Simplified Chinese). National Bureau of Statistics of China.
- ^ 中国气象数据网 – WeatherBk Data (in Simplified Chinese). China Meteorological Administration. Retrieved 28 May 2023.
- ^ 中国气象数据网 (in Simplified Chinese). China Meteorological Administration. Retrieved 28 May 2023.