Mol* (original) (raw)
Mol* (/'molstar/) is a modern web-based open-source toolkit for visualisation and analysis of large-scale molecular data
Open Mol* Viewer Viewer Documentation Issues & Feedback
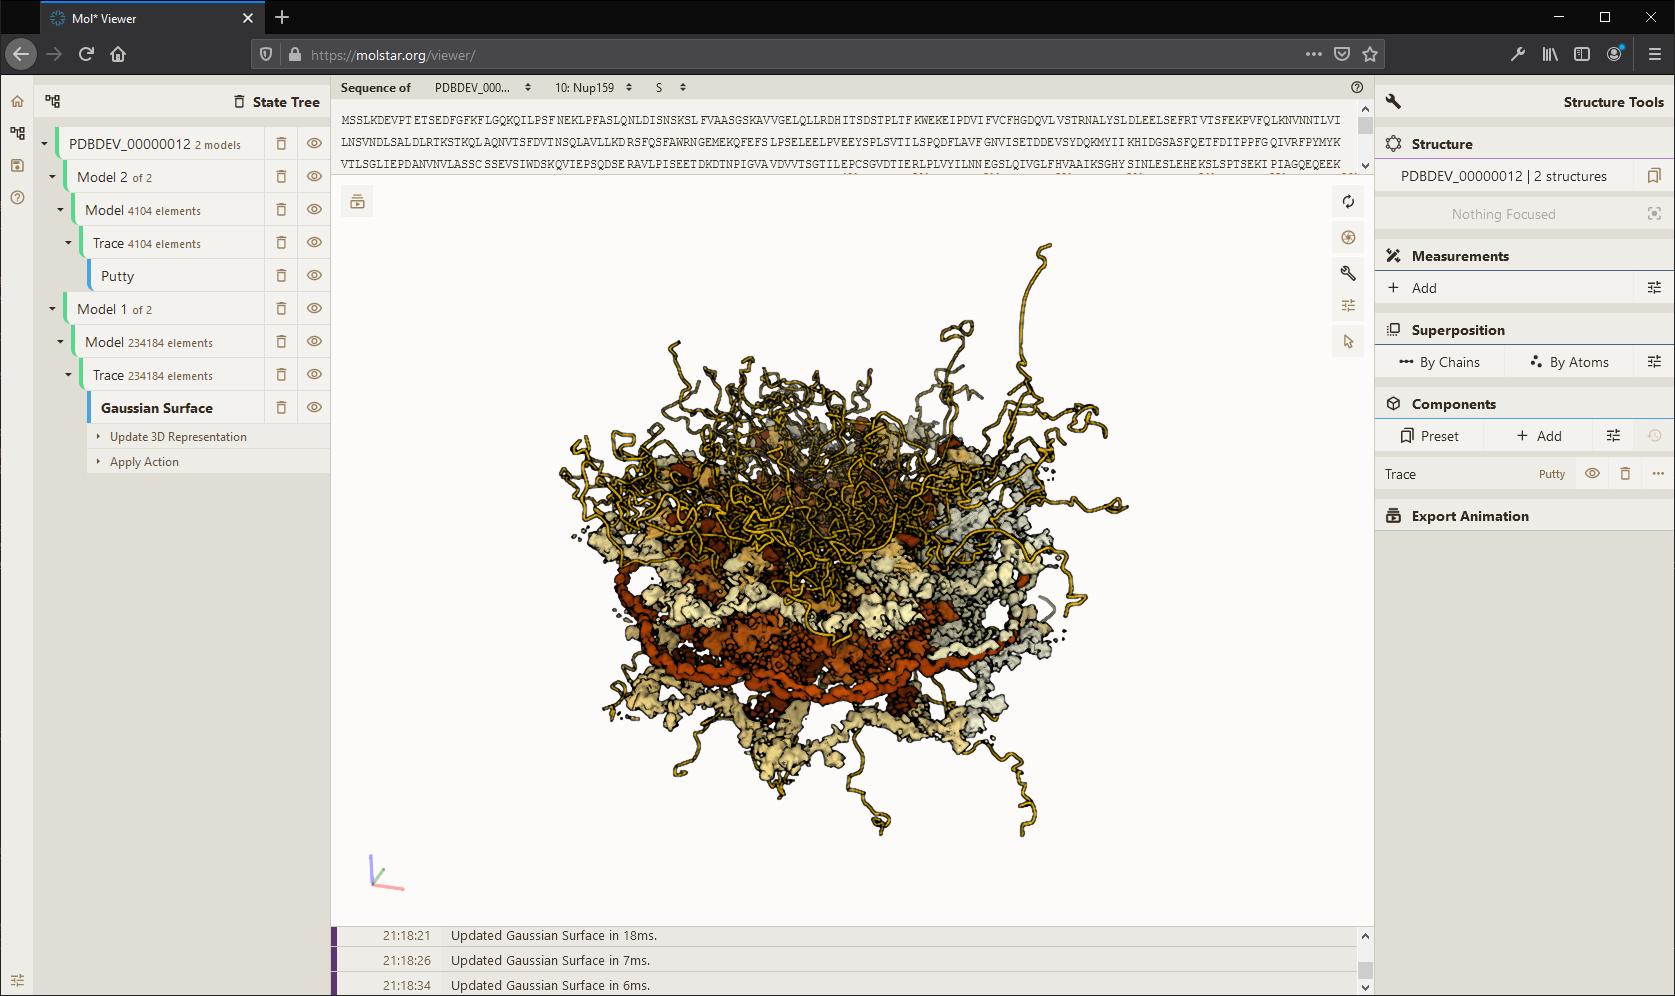
High-performance graphics and data handling of the Mol* Viewer allow users to simultaneously visualise up to hundreds of (superimposed) protein structures, play molecular dynamics trajectories, render cell-level models at atomic detail with tens of millions of atoms, or display huge models obtained by I/HM such as the Nuclear Pore Complex.
Interactive Examples
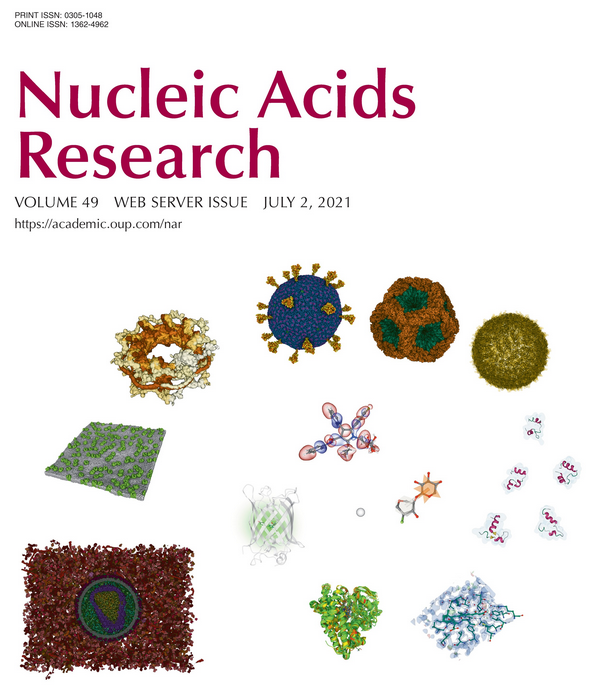
Read about Mol* in Nucleic Acids Research
When using Mol*, please cite:
David Sehnal, Sebastian Bittrich, Mandar Deshpande, Radka Svobodová, Karel Berka, Václav Bazgier, Sameer Velankar, Stephen K Burley, Jaroslav Koča, Alexander S Rose: Mol* Viewer: modern web app for 3D visualization and analysis of large biomolecular structures, Nucleic Acids Research, 2021; 10.1093/nar/gkab31.
In memory of Jaroslav Koča.
Join Development on GitHub Developer Documentation
The Mol* toolkit is a comprehensive solution for molecular data delivery, visualization and analysis that can be embedded into a wide range of 3rd party solutions. It includes a customizable plugin for high quality WebGL based molecular data visualization, as well as servers for model and experimental (X-ray, Cryo-EM, etc.) data delivery, efficient BinaryCIF data format support, and other exciting features.
MolViewSpec provides a generic mechanism for describing visual scenes or views that are used in molecular visualizations. It adopts declarative data-driven approach to describe, load, render, and visually deliver molecular structures, along with 3D representations, coloring schemes, and associated structural, biological, or functional annotations.
Volumes and Segmentations extension adds support for large scale volumetric data & their segmentations. Building on the existing Mol* ecosystem, this extension allows seamless integration of biomolecular data from cellular to atomic scale. It provides the means to visualize large-scale volumetric and segmentation data from cryo-EM, light miscroscopy, volume-EM, and other imagining experiments together with related 3D model data and biological annotations.
The advent of cryo-EM and cryo-ET, coupled with computational modeling, has enabled the creation of integrative 3D models of viruses, bacteria, and cellular organelles. Based on these models, the Mesoscale Explorer provides unprecedented access and insight into the molecular fabric of life, enhancing perception, streamlining exploration, and simplifying visualization of diverse data types, showcasing the intricate details with unparalleled clarity. See theinteractive tours and examples.
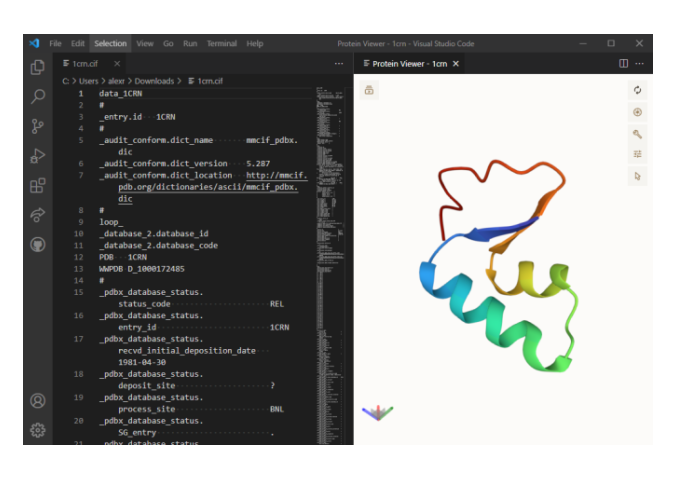
VSCoding-Sequence is an extension for Visual Studio Code that allows for visualization of protein structures and molecular data in the editor.
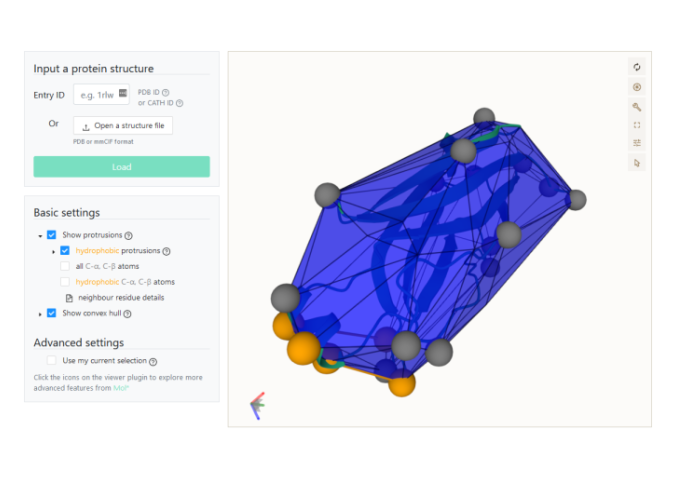
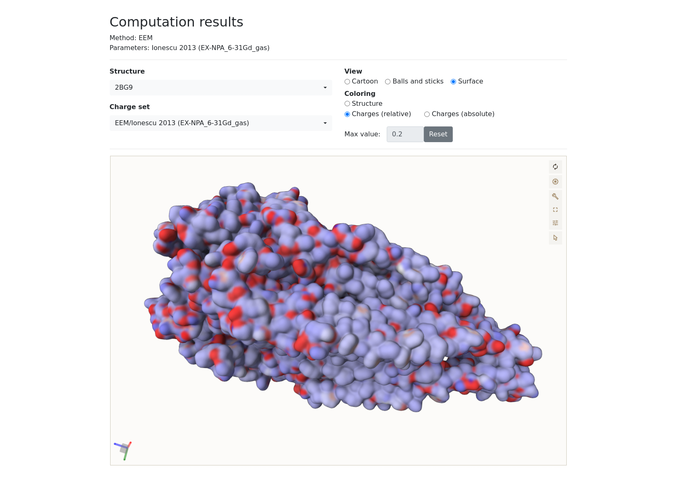
PePr2Vis is a website for the calculation and visualization of protrusions on peripheral membrane proteins.
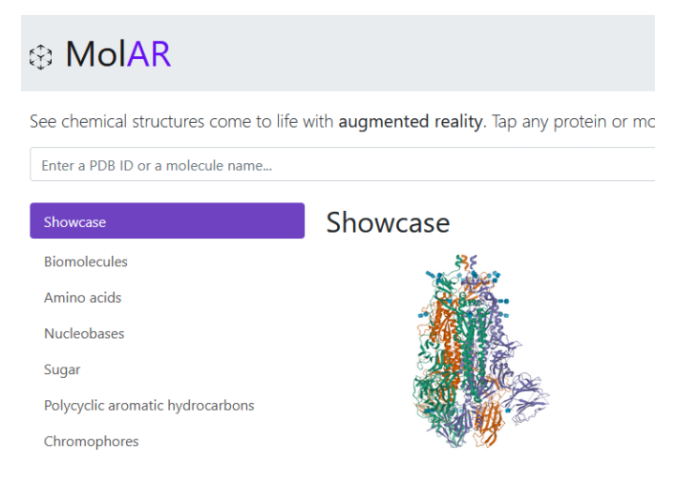
MolAR makes chemical structures come to life with augmented reality, see them in a real-world environment.
EMBL-EBI provides an open source integration of Mol* used by data resources such as PDBe, PDBe-KB and AlphaFold DB. This implementation can be embedded as a JS plugin or a Web Component with helper methods to facilitate programmatic interactions between the web application and the 3D viewer. Its features include a superposition view for overlaying all observed ligand molecules on representative protein conformations.
RCSB PDB provides an open source integration of Mol* that implements additional functionality, including presets for the visualization of structure alignments and structure motifs such as ligand binding sites, or the option to interactively add or hide chains and other structural components as showcased by the 3D Protein Feature View.