Sparklines for Excel® (original) (raw)
| Sparklines for Excel | Excel 2010 | ||
|---|---|---|---|
| Types of cell charts | 14 and growing: Line, Pie, Pareto, Bullet, XY, Scatter, Bar, Column, Stripe… |  |
Three: Line, Column, Win/Loss |
| Overall look (sparklines) | 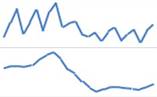 Some blocking, not noticeable at normal zoom levels Some blocking, not noticeable at normal zoom levels |
|
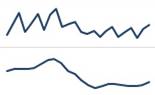 Smoother Smoother |
| Features on individual chart types | Excellent, whole range of markers like hi/low lines, max/min points | |
Limited to some basic additional data indicators, but they work well |
| Ease of deployment | Have to distribute macros with file, some VBA crashes, mostly during creation. Win today, as no built-in option | |
No extra package, but Excel 2010 needed. Win in 2-3 years when 2010 is ‘standard’. |
| Ease of use | More complex, for example looking up meaning of formula variable, color chart | |
Easier, native to the product, so formatting is quick |
| Code Customization and Stability | VBA macro based (non-locked) so customization possible (and legal) | |
Not VBA based – more stable, but no customization |
| Grouping | Can set max and min so that multiple charts scale the same | |
Adjacent charts are grouped automatically making for easy changes of formatting/scales |
| Ease of editing | Charts are shapes created on the basis of formula in the cell | |
Effectively separate charts, edited with own section on ribbon |
| Future additions | Constant addition of new chart types/upgrades to existing | |
Maybe some fixes, but will likely have to wait until Excel 20XX for new chart types |
| Cost | Free, but you need Excel of course | |
Free, at least after you’ve paid any upgrade costs |
While there are equal numbers of ticks in both columns, there are clear winners depending on your required functionality and how you intend to share the information. For creating dashboards that benefit from different types of in-cell charts and line markers, SFE is still a clear winner – the range of chart types, the continued development, along with the fact that the sparklines are formula based makes for a powerful tool. Distribution is complicated by the need to load the add-in file, but for dashboards that shouldn’t be a barrier.
On the other hand, for a quick summary of data that is emailed around, the native version in Excel 2010 is clearly simpler. In the near term (until 2012 I would guess), SFE is still really the only option anyway as sparklines created in Excel 2010 simply won’t show on earlier versions.
It’s great that Microsoft has offered sparklines – hopefully end-users will appreciate their value more now they are a native part of the program, and become used to sparklines’ inclusion in their data lives.
"Thanks so much for this constructive comparison. Little frenchy VBA amateur vs. almighty MSFT coder team … I am thrilled.
Lets review quickly your comparison table.
Number of charts : XL2010 also offers VariChart() in the conditional formatting menu… in the other hand, the win/loss is nothing but a column chart with 1 ; 0 or -1. This limited number of charts does not reflect MSFT’s Business Intelligence ambitions… at least when it comes to Excel. Let’s assume it’s a start.
Overall look : irrelevant from my point of view. Even w/ Zoom of 400% blocking is not noticeable, and specially not on printed reports.
Features : Even with tiny charts, we need some reference: a line to materialize a threshold or a target. XL2010 sparklines do not provide any reference and more important, do not offer the possibility to add a visual scale, a context … it looks good but you do not know what you are looking at. Clearly not enough to design usable dashboards.
Ease of use : SfE formulas are used like any other Excel formula… I agree however that the “formula wizard” offers limited features when UDFs are a bit complex. I could spend some time on SfE user interface to make the parameters more understandable…
Customization : The code is yours, it’s open-source… be fair, share your ideas and improvements on SfE’s blog, quid pro quo.
Stability : This is from my perspective SfE’s weak point, especially with XL2003. VBA events and many shapes to refresh are a cause of crash. SfE can also be painfully slow, inefficient coding and numerous shapes being the reason. I have been thinking of using .Net instead of VBA… but is it worth the effort with XL2010 at the corner ?
Grouping : True that XL2010 will make it “easier” (just quicker actually), but as a user, I prefer to see the formula and identify clearly the scale I am using. Using named ranges makes this so easy with SfE… your choice.
Ease of editing : Well, this is where I do not fully agree. SfE makes the formula easy to edit, plus you can use any nested formula inside SfE formula. I reckon however that only “advanced” excel users will fully appreciate this. Basic users (the ones that use Sum(a1:a2) and nothing else == > a vast majority) will prefer to tick a few boxes et voila.
Future additions : Except maybe a formula for creating quick Gantt chart, I would say that the toolbox is pretty complete. Improved “User Experience” would be the next priority (userforms, tick boxes, color picker, embedded help…). (well… less crash and more speed also !)
Price/cost : SfE is a great hobby.. priceless to me. Now, if Steve Balmer wants to include SfE features in XL2013… just let me know, we’ll talk $
As a bottom line, I would say that MSFT XL2010 is offering “Sparklines for the masses”, a simple solution that works for most users, but is definitely not enough for users who want to build more elaborated and comprehensive dashboards. But that’s maybe MSFT “SQL Server Reporting Services” job ?
SFE in the other hand, is a tool made by an “end user” with limited programming skills + great help from more advanced programmers, but with a much better understanding of what is required in a “decision making” process and dashboard construction (show a reference or target ; limited use of colors ; simple formulas if only mandatory parameters are used).
I am just frustrated that MSFT did not even consider looking at what SfE (and Bonavista and Bissantz) was offering before implementing their simplistic solution… serioulsy, the guys at MSFT France said “We don’t care about SfE, we have THE SAME in Office 2010″ … “THE SAME”… LOL"
Alex is founder of Data Driven Consulting, an independent consulting company that focuses on obtaining high quality data to facilitate effective business decisions. Data Driven Consulting specializes in a number of areas, including market research, dashboard and data presentation, and authoring of white papers and e-content.