Add Points to a Plot (original) (raw)
| points {graphics} | R Documentation |
|---|
Description
points is a generic function to draw a sequence of points at the specified coordinates. The specified character(s) are plotted, centered at the coordinates.
Usage
points(x, ...)

## Default S3 method:
points(x, y = NULL, type = "p", ...)
Arguments
| x, y | coordinate vectors of points to plot. |
|---|---|
| type | character indicating the type of plotting; actually any of the types as in plot.default. |
| ... | Further graphical parameters may also be supplied as arguments. See ‘Details’. |
Details
The coordinates can be passed in a plotting structure (a list with x and y components), a two-column matrix, a time series, .... See [xy.coords](../../grDevices/html/xy.coords.html). If supplied separately, they must be of the same length.
Graphical parameters commonly used are
pch
plotting ‘character’, i.e., symbol to use. This can either be a single character or an integer code for one of a set of graphics symbols. The full set of S symbols is available with pch = 0:18, see the examples below. (NB: R uses circles instead of the octagons used in S.)
Value pch = "." (equivalently pch = 46) is handled specially. It is a rectangle of side 0.01 inch (scaled bycex). In addition, if cex = 1 (the default), each side is at least one pixel (1/72 inch on the [pdf](../../grDevices/html/pdf.html) and[postscript](../../grDevices/html/postscript.html) devices).
For other text symbols, cex = 1 corresponds to the default font size of the device, often specified by an argumentpointsize. For pch in 0:25 the default size is about 75% of the character height (see par("cin")).
col
color code or name, see [par](../../graphics/help/par.html).
bg
background (fill) color for the open plot symbols given by pch = 21:25.
cex
character (or symbol) expansion: a numerical vector. This works as a multiple of [par](../../graphics/help/par.html)("cex").
lwd
line width for drawing symbols see [par](../../graphics/help/par.html).
Others less commonly used are lty and lwd for types such as "b" and "l".
The graphical parameters pch, col, bg,cex and lwd can be vectors (which will be recycled as needed) giving a value for each point plotted. If lines are to be plotted (e.g., for type = "b") the first element of lwdis used.
Points whose x, y, pch, col or cexvalue is NA are omitted from the plot.
pch values
Values of pch are stored internally as integers. The interpretation is
NA_integer_: no symbol.0:18: S-compatible vector symbols.19:25: further R vector symbols.26:31: unused (and ignored).32:127: ASCII characters.128:255native characters only in a single-byte locale and for the symbol font. (128:159are only used on Windows.)-32 ...Unicode code point (where supported).
Note that unlike S (which uses octagons), symbols 1, 10,13 and 16 use circles. The filled shapes 15:18do not include a border.
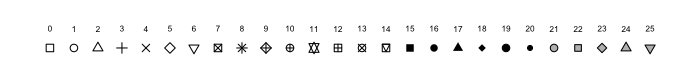
The following R plotting symbols are can be obtained withpch = 19:25: those with 21:25 can be colored and filled with different colors: col gives the border color and bg the background color (which is ‘"grey"’ in the figure)
pch = 19: solid circle,pch = 20: bullet (smaller solid circle, 2/3 the size of19),pch = 21: filled circle,pch = 22: filled square,pch = 23: filled diamond,pch = 24: filled triangle point-up,pch = 25: filled triangle point down.
Note that all of these both fill the shape and draw a border. Some care in interpretation is needed when semi-transparent colours are used for both fill and border (and the result might be device-specific and even viewer-specific for [pdf](../../grDevices/html/pdf.html)).
The difference between pch = 16 and pch = 19 is that the latter uses a border and so is perceptibly larger when lwd is large relative to cex.
Values pch = 26:31 are currently unused and pch = 32:127give the ASCII characters. In a single-byte localepch = 128:255 give the corresponding character (if any) in the locale's character set. Where supported by the OS, negative values specify a Unicode code point, so e.g. -0x2642Lis a ‘male sign’ and -0x20ACL is the Euro.
A character string consisting of a single character is converted to an integer: 32:127 for ASCII characters, and usually to the Unicode code point otherwise. (In non-Latin-1 single-byte locales,128:255 will be used for 8-bit characters.)
If pch supplied is a logical, integer or characterNA or an empty character string the point is omitted from the plot.
If pch is NULL or otherwise of length 0,par("pch") is used.
If the symbol font ([par](../../graphics/help/par.html)(font = 5)) is used, numerical values should be used for pch: the range isc(32:126, 160:254) in all locales (but 240 is not defined (used for ‘apple’ on macOS) and 160, Euro, may not be present).
Note
A single-byte encoding may include the characters inpch = 128:255, and if it does, a font may not include all (or even any) of them.
Not all negative numbers are valid as Unicode code points, and no check is done. A display device is likely to use a rectangle for (or omit) Unicode code points which are invalid or for which it does not have a glyph in the font used.
What happens for very small or zero values of cex is device-dependent: symbols or characters may become invisible or they may be plotted at a fixed minimum size. Circles of zero radius will not be plotted.
References
Becker, R. A., Chambers, J. M. and Wilks, A. R. (1988)The New S Language. Wadsworth & Brooks/Cole.
See Also
[points.formula](../../graphics/help/points.formula.html) for the formula method;[plot](../../graphics/help/plot.html), [lines](../../graphics/help/lines.html), and the underlying workhorse function [plot.xy](../../graphics/help/plot.xy.html).
Examples
require(stats) # for rnorm
plot(-4:4, -4:4, type = "n")  # setting up coord. system
points(rnorm(200), rnorm(200), col = "red")
points(rnorm(100)/2, rnorm(100)/2, col = "blue", cex = 1.5)

op <- par(bg = "light blue")
x <- seq(0, 2*pi, length.out = 51)
## something "between type='b' and type='o'":
plot(x, sin(x), type = "o", pch = 21, bg = par("bg"), col = "blue", cex = .6,
 main = 'plot(..., type="o", pch=21, bg=par("bg"))')
par(op)

## Illustration of pch = 0:25 (as in the figure shown above in PDF/HTML help)
## Not run: png("pch.png", height = 0.7, width = 7, res = 100, units = "in")
par(mar = rep(0,4))
plot(c(-1, 26), 0:1, type = "n", axes = FALSE)
text(0:25, 0.6, 0:25, cex = 0.5)
points(0:25, rep(0.3, 26), pch = 0:25, bg = "grey")


##-------- Showing all the extra & some char graphics symbols ---------
pchShow <-
  function(extras = c("*",".", "o","O","0","+","-","|","%","#"),
           cex = 3, ## good for both .Device=="postscript" and "x11"
           col = "red3", bg = "gold", coltext = "brown", cextext = 1.2,
           main = paste("plot symbols :  points (...  pch = *, cex =",
                        cex,")"))
  {
    nex <- length(extras)
    np  <- 26 + nex
    ipch <- 0:(np-1)
    k <- floor(sqrt(np))
    dd <- c(-1,1)/2
    rx <- dd + range(ix <- ipch %/% k)
    ry <- dd + range(iy <- 3 + (k-1)- ipch %% k)
    pch <- as.list(ipch) # list with integers & strings
    if(nex > 0) pch[26+ 1:nex] <- as.list(extras)
    plot(rx, ry, type = "n", axes  =  FALSE, xlab = "", ylab = "", main = main)
    abline(v = ix, h = iy, col = "lightgray", lty = "dotted")
    for(i in 1:np) {
      pc <- pch[[i]]
      ## 'col' symbols with a 'bg'-colored interior (where available) :
      points(ix[i], iy[i], pch = pc, col = col, bg = bg, cex = cex)
      if(cextext > 0)
          text(ix[i] - 0.3, iy[i], pc, col = coltext, cex = cextext)
    }
  }

pchShow()
pchShow(c("o","O","0"), cex = 2.5)
pchShow(NULL, cex = 4, cextext = 0, main = NULL)


## ------------ test code for various pch specifications -------------
# Try this in various font families (including Hershey)
# and locales.  Use sign = -1 asserts we want Latin-1.
# Standard cases in a MBCS locale will not plot the top half.
TestChars <- function(sign = 1, font = 1, ...)
{
   MB <- l10n_info()$MBCS
   r <- if(font == 5) { sign <- 1; c(32:126, 160:254)
       } else if(MB) 32:126 else 32:255
   if (sign == -1) r <- c(32:126, 160:255)
   par(pty = "s")
   plot(c(-1,16), c(-1,16), type = "n", xlab = "", ylab = "",
        xaxs = "i", yaxs = "i",
        main = sprintf("sign = %d, font = %d", sign, font))
   grid(17, 17, lty = 1) ; mtext(paste("MBCS:", MB))
   for(i in r) try(points(i%%16, i%/%16, pch = sign*i, font = font,...))
}
TestChars()
try(TestChars(sign = -1))
TestChars(font = 5)  # Euro might be at 160 (0+10*16).
                     # macOS has apple at 240 (0+15*16).
try(TestChars(-1, font = 2))  # bold
[Package _graphics_ version 4.5.0 Index]