Lean Six Sigma tools - Six Sigma templates (original) (raw)
Excel templates and more quality improvement tools
DMAIC tools to Define, Measure, Analyze, Improve, and Control quality
Six Sigma Templates
to empower every team member
150+ Lean Six Sigma Excel Templates
consistent, standardized, and supported
When you complete the Quick Start Training, you know dozens of ways that your Systems2win add-in extends the standard features of familiar Microsoft Excel.
You know that when you click any row or column heading,
there will be pop-up help.
You know that there will be online training and videos,
and free technical support when you need it.
You know that you can personalize any Systems2win template,
and easily keep your personalizations each time you upgrade

Familiar Microsoft Excel
Use everything you know about familiar Word and Excel
A core tenet of lean six sigma is to reduce variability
What if you applied that core tenet to your process improvement tools?
Download your free trial lean sigma templates to try them for yourself
Lean Six Sigma templates
Tool Selection Matrix (1ToolSelection.xlsx)
The following list of Lean Six Sigma templates is a partial list.
To see the full list, use your Tool Selection Matrix where you can also use Excel's powerful Filter features to choose the right Process Improvement Tool for what you need to accomplish next.
If your organization has not yet provided you with a license, you can download your free trial now
basic
Basic Quality Tools
Learn more about Basic Quality Tools
Pareto Chart template (Pareto.xlsx)
Quality improvement template to identify the 20% of problems causing 80% of your headaches so you know where to focus your continuous improvement efforts
Your chart can instantly change as your data changes
(something MiniTab, QI Macros, and Sigma XL can't do)
Unlimited categories of horizontal or vertical data.
Correctly groups all remaining categories in final bar labeled "Other".
Click a button to copy chart to ANY document (including PowerPoint, Word...)
Download free trial Pareto Chart
Scatter Plot (ScatterPlot.xlsx)
To graphically plot the relationship between two sets of data, and analyze for possible correlation.
Histogram (Histogram.xlsx)
To discover and show the shape (frequency distribution) of a set of continuous data that has been separated into equally sized bins
Root Cause Analysis Map (RootMap.xlsx)
To identify the root causes of a problem, and brainstorm creative countermeasures for solving them
Root Cause Fishbone Diagram (RootCause.xlsx)
also known as Cause and Effect Diagram, or Ishikawa Root Cause Analysis Fishbone Diagram
To identify the root causes of a problem, and brainstorm creative ideas for solving them
Download free trial Fishbone Diagram
Relations Diagram (RelationsDiagram.xlsx)
also known as a Thought Map
To identify root causes of a complex, nonlinear problem
(Use a Cause and Effect Fishbone Diagram to identify root causes of less complex, linear problems.)
Control Charts (ControlChart.xlsx)
To determine whether a process is in a stable state of control highlighting statistically unlikely data points and trends that should be investigated to improve process stability.
Your chart can instantly change as your data changes
(something MiniTab, QI Macros, and Sigma XL can't do)
Download free trial Control Chart template
Check Sheet (CheckSheet.xlsx)
aka Tally Sheet
To gather data when it happens where it happens — using hand written hash check marks. The data is later summarized and analyzed using the Quality Scorecard.
Run Chart (RunChart.xlsx)
aka Line Chart, Trend Chart, Trend Analysis
To analyze data and trends over time.
Your chart can instantly change as your data changes
(something MiniTab, QI Macros, and Sigma XL can't do)
Trend Charts Scorecard (Trends.xlsx)
aka Trends Analysis, Quality Scorecard, Visual Scorecard
Your statistical software assumes that you have a clean, organized way to store and archive the data that your statistical software will then analyze.
That's a big assumption, isn't it?
This is a great template to summarize, archive, and analyze large amounts of data, history, and trends.
SIPOC Diagram (SIPOC.xlsx)
Use the SIPOC template to identify and eliminate wastes of any kind: hazardous wastes and emissions, scrap, energy, packaging...
The SIPOC flowchart has columns for Suppliers, Inputs, Processes, Outputs, and Customers
Download free trial SIPOC template
and see SIPOC video
Tree Diagram (Tree.xlsx)

Popular and diverse Six Sigma tool to systematically direct your thinking to increasing levels of specific details.
See online training for different types of tree diagrams.
Matrix Diagram (Blank.xlsx)

Use the Blank template to create your own custom templates with the consistent user interface and all of the useful features that are so familiar to all of your other Systems2win templates.
The most popular type of custom template is the Matrix template.

solving
Lean Six Sigma Tools for Problem Solving
See the other Problem Solving Tools that also come with your Systems2win templates
Brainstorming & Affinity Group Tool (Brainstorming.docx)

Six sigma template to brainstorm ideas, then quickly organize them into affinity groups to stimulate even more ideas
8D Problem Solving (8D.xlsx)
also known as Corrective Action Report
To provide a systematic way for a team to resolve a problem that has uncertain root causes — in a way that systematically ensures that root causes have been identified and verified. Makes certain that permanent corrective actions are validated for effectiveness, and are instituted in a way that prevents the problem from ever recurring or escaping again.
Corrective Action Request (SCAR.docx)
also known as Supplier Corrective Action
The Supplier Corrective Action Report template does not presuppose that all of the rigid formality of the 8D process will be required.
This simple Word template is structured as a one-page letter that simply requests the supplier to deal with a non-conformance issue.
leader
Six Sigma Templates for Team Leadership
See the other Lean Leadership Tools that also come with your Systems2win templates
Team Roles (ssTeamRoles.docx)

Simple six sigma tool to define the performance criteria, time commitment, and ideal profile for each team role.
Team Empowerment Boundaries (TeamBoundaries.docx)

Top management's clear communication of what your team is and is not empowered to do.
Download free templates for team leadership
Project Charter template (TeamCharter.xlsx)

To summarize the Six Sigma project scope and results in a form that is easily copied into PowerPoint. Your team leaders can choose from several diverse types of project charter templates.
Cross Training Matrix (1TrainingMatrix.xlsx)

To keep track of who needs what training, and who has completed the training they need.
Download free trial Training and Skills Matrix template

DFSS
Design for Six Sigma
Learn more about DFSS Tools to design or re-design any product or service for better quality
Process Flow Diagram (ProcessFlow.xlsx)
Prior to creating a PFMEA, use the Process Flow Diagram to identify Sources of Variation, and desired Deliverables (ideal Functions) for each Process Step.
Download free trial Process Flow Diagram
as a sheet within the FMEA template
Customer Segmentation Worksheet (CustSegment.xlsx)

Quality improvement template to identify and focus attention upon the sub-segments of customers that generate the most value from each product or service
Voice of the Customer Data Collection Worksheet (VOC_Data.docx)

To plan and manage the collection of Six Sigma customer data — from existing company data, listening posts, surveys, interviews, point-of-use observation, and more
Free training for Voice of the Customer templates
Voice of the Customer Requirements Translation and Kano Analysis (VOC_Kano.xlsx)
Quality control template to translate potentially vague customer comments into measurable functional requirements – thereby strengthening your team's ability to design and deliver products and services that truly delight your customers
Operational Definitions (Op_Def.xlsx)

Another important quality tool, to avoid the single most costly mistake in a Six Sigma project, inconsistent collection and interpretation of Check Sheet data, measurement criteria, or the results of surveys and other Voice of the Customer data.
Learn more about the Operational Definitions template
Critical to Quality CTQ Tree Diagram (TreeCritical.xlsx)
To ensure that the product or process characteristics that you measure and control will actually satisfy your customers' desires.
Learn more about the Critical To Quality Tree Diagram template
Measurement Assessment Tree Diagram (MeasuresTree.xlsx)

To identify data that is (and is not) worth measuring and controlling, stratified in ways that help to discern patterns in the data (about root causes, usage patterns, etc.)
Learn more about the Measurement Assessment Tree template
DMAIC Measurement Selection Matrix (MeasuresSelect.xlsx)
One of the most important quality tools — to avoid the single most common mistake in a Six Sigma project — choosing the wrong measures.
Learn more about the Measurement Selection Matrix
Cause and Effect Matrix (CauseEffect.xlsx)
A simpler quality improvement tool than the QFD — with a similar objective: to identify the few process input variables that provide the greatest opportunity to improve the key process outputs
FMEA
Failure Modes and Effects Analysis (FMEA.xlsx)
Also known as EMEA Error Modes and Effects Analysis, Design DFMEA, and Process PFMEA
Design For Six Sigma tool (DFSS) to anticipate problems, and design processes and products to reduce costly and embarrassing risks
Download free trial FMEA template
and see FMEA video
Control Plan (fmeaControlPlan.xlsx)

Excel template to more diligently control risks identified in the FMEA
Learn more about the Control Plan template
P-Diagram (fmeaP-Diagram.xlsx)
aka Parameter Diagram
Prior to creating an FMEA — use the p diagram to analyze Inputs and Outputs and Noise Factors and Control Factors that can affect performance of desired Ideal Functions, and minimize Error States.
Interface Matrix (fmeaInterfaceMx.xlsx)
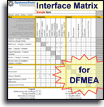
Prior to creating a DFMEA — use the Interface Matrix to identify and clarify interfaces between environment, systems, sub-systems, and components that are beneficial or detrimental to functionality.
Also provides P-Diagram input/outputs and noise factors
Function/Requirements worksheet (fmeaFunctionReq.docx)

aka Item/Function worksheet
Six Sigma tools to identify and clarify Functions and corresponding Requirements prior to completing the Function and Requirements columns of the FMEA form
Characteristic Matrix (fmeaCharacterMx.xlsx)

aka Product Characteristics Matrix
Prior to creating a PFMEA — use the Characteristic Matrix to identify process steps that can compromise characteristics of the product or service that are noticeable and important to the customer.
Design Verification Plan and Report (fmeaDVPR.xlsx)

aka DVP&R, DVPnR, DVPR
Formalized testing of product or service to ensure compliance with all requirements.
OEE Overall Equipment Effectiveness (OEE.xlsx)
Excel template for TPM Total Productive Maintenance — to maximize the effectiveness of your bottleneck resources.
And unlike any other OEE software — this comes with an entire suite of continuous improvement and six sigma tools — so you can actually solve the problems that OEE analysis uncovers.
OEE Paper Data Collection (OEE-Paper.docx)

To manually collect data that then gets entered into your OEE template for analysis.
House of Quality
Quality Functional Deployment Matrix (QFD.xlsx)
One of the most sophisticated quality improvement tools, the QFD provides a guiding structure for a cross-functional product development team to rapidly design and deploy new products and services.
custom
Personalize your Lean Six Sigma Templates
You can use absolutely everything that you know about familiar Microsoft Excel to personalize your lean six sigma templates
AND... every time that you upgrade...
the Systems2win Personalization Upgrade Utility
will automatically find and transfer your personalizations
to the new upgraded version of your templates...
so that over the years, your lean sigma templates become more and more yours
These Lean Six Sigma tools
are designed to supplement (not replace) your favorite statistical software
Our customers sometimes ask...
"Why doesn't Systems2win offer more templates for the complex statistics that are so prevalent in Six Sigma Black Belt training?"
The answer is...
that your Systems2win templates are the right tools for
- your Value Stream Managers and Continuous Improvement Team Leaders
the majority of whom are NOT Black Belts - your Green Belts
the people attempting to improve the quality of their own processes
The (few) Black Belts in your organization undoubtedly already own and are trained to use their favoritestatistics software
for regression analysis, X Bar and R Charts, chi squared analysis, and other eye-glazing statistical methods that only Black Belts know how to use or understand.
Even your Black Belts should appreciate...
- the philosophy that advanced statistical methods should only be introduced after the low-hanging fruit has been harvested for the quality improvements that always accompany standardized work
- the lower learning curve that comes with consistent, standardized tools that become so familiar for not only your six sigma tools, but also lean tools, value stream mapping tools, and lean management tools
- the possibility to own a site license to empower your Green Belts with the basic quality tools for a tiny fraction of what it would cost to purchase that many seats of MiniTab
- the fact that your Systems2win Control Charts, Run Charts, Trend Charts, and Pareto Charts can instantly refresh as your data changes (unlike any competitor)
- the DFSS tools that have allow such sophisticated in-depth analysis to design or re-design products and services for dramatically improved quality

Training
Video: DMAIC Six Sigma tools
Video: Introduction to
Lean Kaizen DMAIC Six Sigma
Video: FMEA Innovations
Video: How to use
special features to
Insert Sheet, and Link Data
Video: Trend Charts Scorecard
WhatIs
What is Lean Six Sigma
Definition of Lean Six Sigma — also known as Lean Sigma
Six Sigma is a measure of quality — representing 3.4 defects out of a million opportunities.
In practice, there are very few processes that justify the time and expense to obtain that high of a level of quality. Your team can choose any target level of quality, such as 1 defect per thousand, or 1 per 10,000 opportunities.
The Six Sigma methodology was initiated by Motorola and expounded by General Electric.
It emphasizes quantifiable, measurable statistics to select improvement projects, and to manage quality.
Lean Six Sigma (or Lean Sigma) combines continuous improvement methodologies that use both Lean tools and Six Sigma tools.
DMAIC
What is DMAIC
The DMAIC process of Lean Six Sigma is a scientific method for process improvement — similar to PDCA
Define problems, customer wants, processes, and project boundaries.
Measure the process as it was, as it is, and as you want it to be.
Analyze sources of variation, performance gaps, and priorities to improve.
Improve the process by designing & implementing creative ways to fix and prevent problems.
Control the improved process — and prevent backsliding into old habits.
DMADV
In Design for Six Sigma, the process is similar, but a little different
Define problems, customer wants, processes, and project boundaries.
Measure the process as it was, as it is, and as you want it to be.
Analyze sources of variation, performance gaps, and priorities to improve.
Design the product or process.
Verify that the design accomplishes the objectives.
TQM
What is TQM?
Total Quality Management (TQM) is any quality management system that addresses all areas of an organization, emphasizes customer satisfaction, and uses continuous improvement methods and tools.
TQM is based on the concepts taught by quality management gurus Deming, Juran, Crosby, Ishikawa, and others.
~ Nancy Tague, author of The Quality Toolbox
Reading
Suggested Reading and Resources for
Lean Six Sigma Tools
- Six Sigma Memory Jogger - a Pocket Guide, by Michael Brassard
- The Lean Six Sigma Pocket Toolbook, by Michael George
- The Six Sigma Way Team Fieldbook, by Peter Pande
"In God we trust. Everyone else, bring data."
Lean Six Sigma tools
Aren't there some team members that could be more valuable if only they had access to consistent, standardized, supported easy-to-use quality management tools?