Debugging the STM32F4 using openocd, gdb and Eclipse (original) (raw)
About
This article will describe how to debug the STM32F4 microcontroller using the zylin eclipse plugin. The following setup will be used:
- STM32F4 discovery board
- The built-in SWD programmer/debugger on the discovery board
- Toolchain and example program from this tutorial (I have updated the build script for debugging to work, so if you have followed the tutorial before you may have to download and run the summon-arm script again)
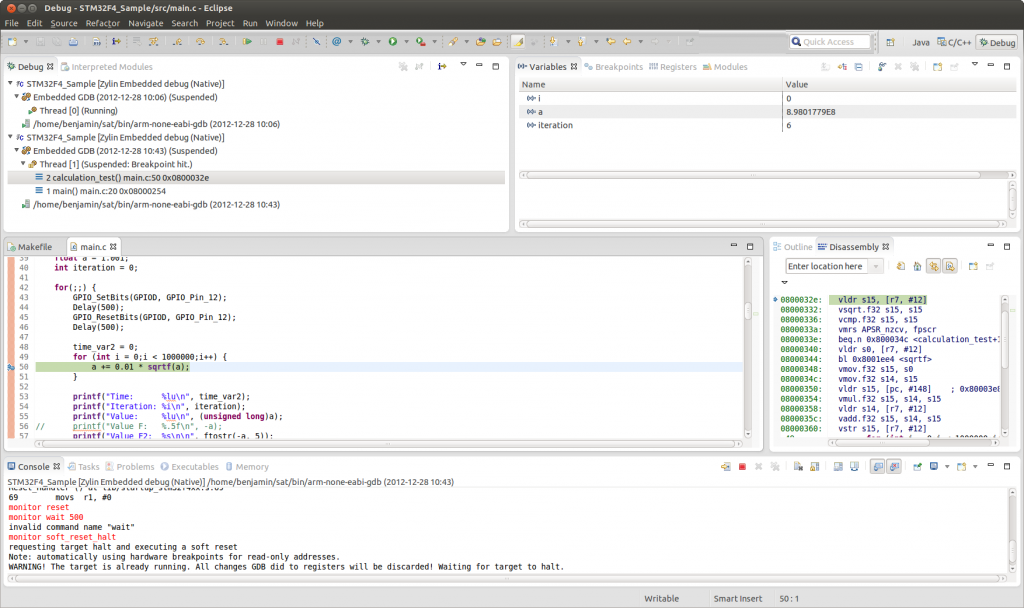
The result will look something like this:
You can:
- Set hardware breakpoints
- See variable values when hitting the breakpoints
- Change variables, then continue
- Many other things…
Install the toolchain and Eclipse
The required toolchain can be installed by following this tutorial. Also, install eclipse as is described there and import the sample makefile project.
Once Eclipse up and running, go to Help > Install New Software… and add
http://opensource.zylin.com/zylincdt
follow the steps to install it and restart eclipse.
Set up the debug configuration
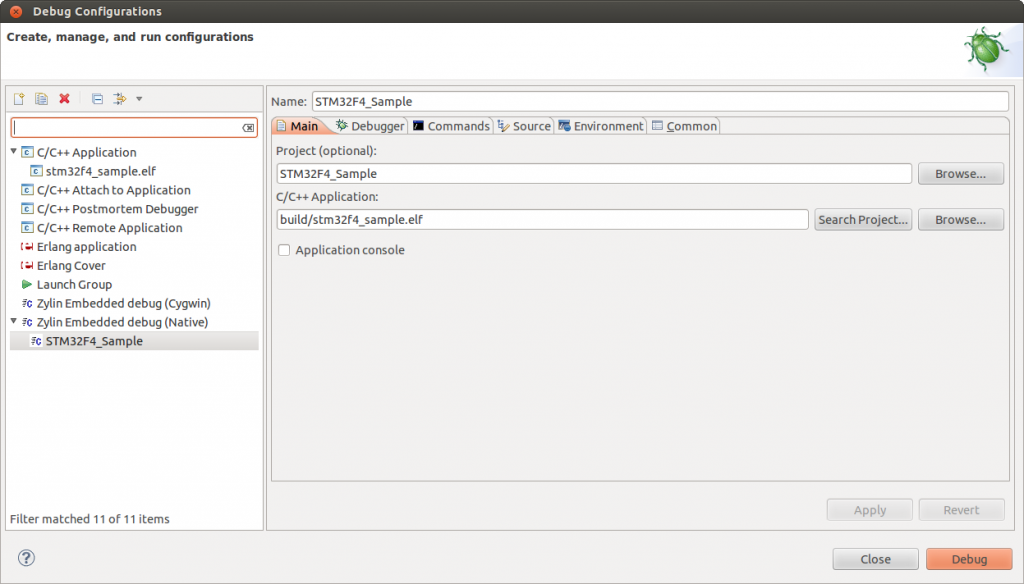
In Eclipse, open Run > Debug Configurations… and create a new launch configuration under Zylin Embedded debug (Native). Set the project name and choose the .elf file for the application. This can look something like this:
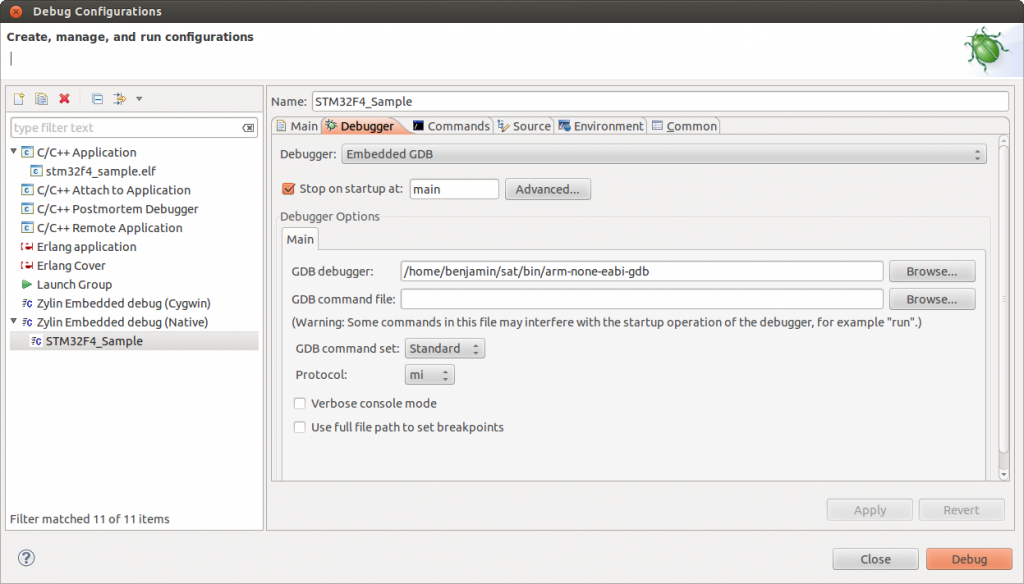
Make sure that the project is built before so you can choose the correct .elf file. Now, go to the Debugger tab and set the correct path to gdb. After running the summon-arm script, it should be
/home/YOUR_USERNAME/sat/bin/arm-none-eabi-gdb
where you replace YOUR_USERNAME with your username. This should look something like the following:
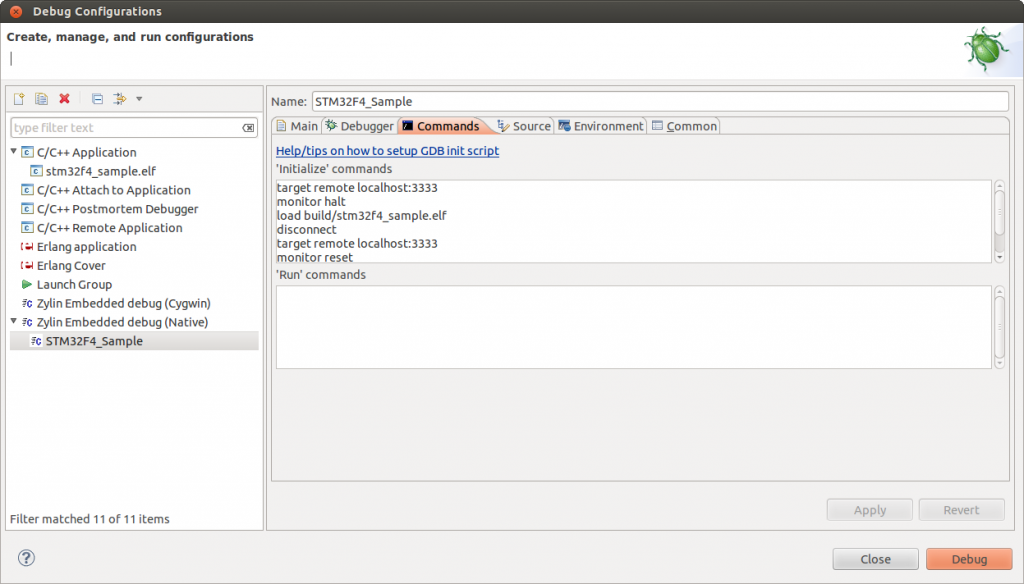
Next, go to the Commands tab and paste in the following ‘Initialize’ commands:
target remote localhost:3333 monitor reset monitor halt load disconnect target remote localhost:3333 monitor reset monitor halt
Make sure that you modify the load line with your .elf file. This should end up looking something like this:
Alternatively, if the above commands don’t work, you can try something like this:
target remote localhost:3333 monitor reset monitor halt monitor flash protect 0 0 11 off monitor flash write_image erase "/path/to/hex/file" 0 ihex disconnect target remote localhost:3333 monitor reset monitor halt
You have to change the path to the hex file in the write_image command above.
That’s it for the Eclipse part! You can’t start debugging yet though, you have to start the openocd server first.
Starting the openocd server
Create a file called stm32f4discovery.cfg with the following content:
This is an STM32F4 discovery board with a single STM32F407VGT6 chip.
http://www.st.com/internet/evalboard/product/252419.jsp
source [find interface/stlink-v2.cfg]
source [find target/stm32f4x_stlink.cfg]
use hardware reset, connect under reset
reset_config srst_only srst_nogate
As you can see, it should be fairly easy to modify this file for other MCUs. You can go to ~/sat/share/openocd/scripts/target to find other target files for openocd.
Now, from the same directory, run openocd with the following command:
openocd -f stm32f4discovery.cfg
If everything went well, you should get something like the following output:
Open On-Chip Debugger 0.7.0-dev-snapshot (2012-12-28-09:05) Licensed under GNU GPL v2 For bug reports, read http://openocd.sourceforge.net/doc/doxygen/bugs.html adapter speed: 1000 kHz srst_only separate srst_nogate srst_open_drain Info : clock speed 1000 kHz Info : stm32f4x.cpu: hardware has 6 breakpoints, 4 watchpoints
Start debugging!
Now that openocd is running, you can launch the debug configuration in Eclipse and open the Debug perspective. Then you should see something like the screenshot in the beginning. Note that when you start debugging, the program will be uploaded to flash of the STM32 as well.
When the debug session is started, you can click on Resume (F8) to start execution. Then the program will run until you click Suspend or until you hit a breakpoint, then you will see the current line you are executing in the source code and the variables and their values in the current scope. Breakpoints can be set/toggled/reset by right-clicking in the leftmost part of the source code editor. If this is done while the program is running, it will halt as soon as the breakpoint is hit.
Troubleshooting
Here are some problems that I encountered while working on this and possible workarounds:
Sometimes it is not possible to start the debug session or it “kind of” starts, but does not seem to work correctly.
This can often be solved by stopping openocd, unplugging and re-plugging the board and then starting openocd again.
Some variables cannot be seen or changed and the assembler code does not seem to match the c-code perfectly.
This is most likely because the code is compiled with optimizations enabled. If you are using my example project, you can open the makefile and change this line:
CFLAGS = -std=gnu99 -g -O2 -Wall -Tstm32_flash.ld
to
CFLAGS = -std=gnu99 -g -O0 -Wall -Tstm32_flash.ld
Only the disassembly is shown when pausing the program or when hitting breakpoints, but not the c source file.
This can happen when the program is compiled without the -g option. This option will tell the compiler to generate:
- symbol names
- type information for the symbols
- file and line numbers where the symbols came from
This information is then used to display the line numbers and variables in the source file.


