Tropical Cyclone Monica (original) (raw)
16 – 27 April 2006
Summary
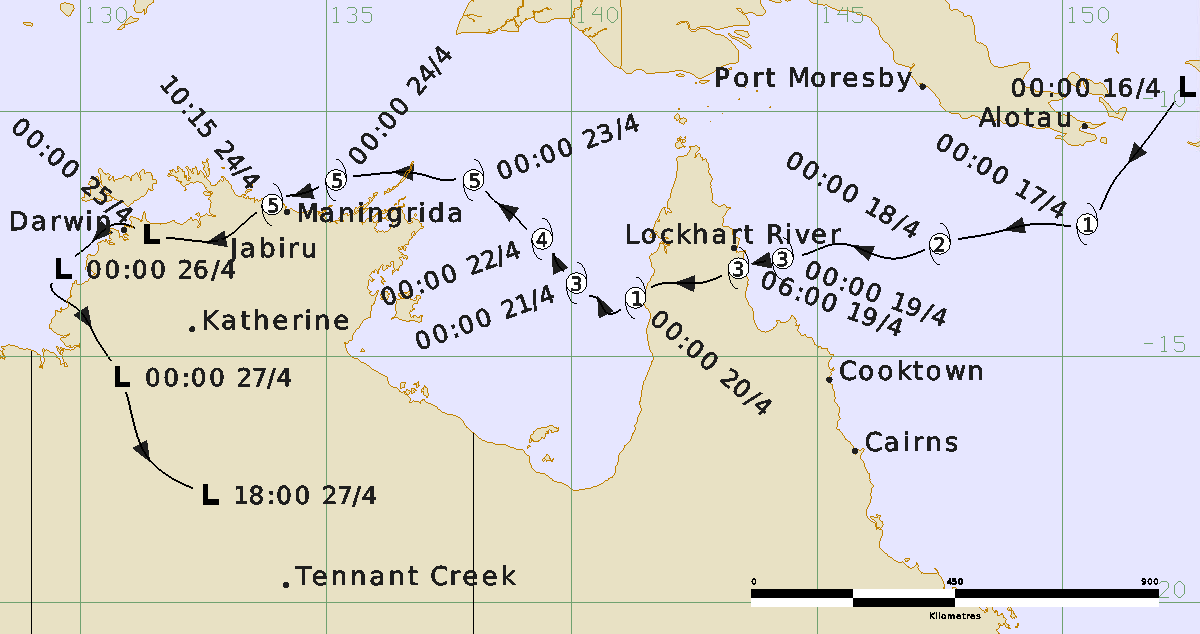
Severe Tropical Cyclone Monica made two significant landfalls, firstly as a category three system on the far north Queensland coast north of Cooktown on 19 April and then on the north coast of the Northern Territory near Maningrida at category 5 intensity on 24 April. Monica was the most intense tropical cyclone in the Australian region and the strongest to ever make landfall in Australia. Monica is also one of only three category 5 tropical cyclones to affect the Northern Territory coast, the others being Kathy (1984) and Ingrid (2005).
A tropical low was analysed in the far northern Coral Sea on 16 April. The low moved towards the southwest under the influence of a weakening ridge to the south. There it reached cyclone intensity on 17 April and began a more westward track toward Cape York Peninsula. The system intensified to hurricane-force strength before making landfall 40 km south of Lockhart River on the afternoon of 19 April. The system weakened over land, before entering the Gulf of Carpentaria as a weak cyclone early the following day.
Monica began to intensify rapidly as it tracked to the northwest over the Gulf of Carpentaria reaching category 5 intensity at 0600 UTC 22 April then attaining maximum intensity of 135 kn (250 km/h) 24 hours later about 110 km to the northeast of Nhulunbuy. This is the highest intensity of any cyclone in the Australian region. At this time, Monica had an eye diameter of around 30 km but the effects of the very destructive core were very much confined near to the eye wall. The Cape Wessel AWS recorded a mean wind of 70 kn (130 km/h) at 1030 UTC (2000 ACST) 23 April prior to failing as Monica 's maximum winds approached to within an estimated 15 km of the station. The convective structure of Monica maintained its intense nature until it made landfall at 1015 UTC (1945 ACST) 24 April at Junction Bay, 35 km west of Maningrida.
Monica quickly weakened after landfall, passing over northern parts of Kakadu National Park near Jabiru at category 2 intensity and then weakening below tropical cyclone intensity just 12 hours after landfall. The system passed to the north of Darwin as a tropical low during the afternoon of 25 April and then turned to the southwest then to the southeast weakening over land on 27 April.
Fortunately, Monica crossed Cape York Peninsula at a remote location, avoiding the local townships of Lockhart River and Coen. However, there was widespread tree damage and moderate damage to infrastructure along the Arnhem Land coast, extending as far west as the township of Jabiru. Maningrida community received substantial damage as the cyclone passed just to the north of the township, with several houses damaged by fallen trees and debris. The uninhabited coastal crossing point suffered severe vegetation damage, with 60-80 per cent of all trees uprooted or snapped, as well as evidence of a 5-6 m storm surge in Junction Bay.
Heavy rainfall caused flooding in the Adelaide, Victoria, Daly and Katherine River catchments.
For more information see the TC Monica Report (doc).
Track and Intensity (Time in UTC)

Observations summary
Maximum Winds
109 km/h gust at Lockhart River at 15:00 EST 19 April.
130 km/h mean wind at Cape Wessel, 8 pm CST 23 April.
148 km/h gust at Maningrida, 6:40 pm CST 24 April.
118 km/h gust at Jabiru, 3:02 am CST 25 April.
Lowest Reported Pressure
986.0 hPa at Lockhart River.
970.2 hPa at Cape Wessell.
986.2 hPa at Maningrida.
986.6 hPa at Jabiru Airport.
Daily Rainfall
Rainfall - Queensland
215 mm at Lockhart River in the 24 hours until 9am on 19 April.
239 mm at Violet Vale in the 24 hours until 9am on 20 April
282 mm at Musgrave in the 24 hours until 9am on 21 April
Rainfall - Northern Territory
190 mm at Ngayawili in the 24 hours until 9am on 25 April
340 mm at Majestic Orchids (near Darwin River Dam) in the 24 hours until 9am on 26 April
261 mm at Kidman Springs in the 24 hours until 9am on 27 April
Figure 1. Rainfall during the week ending 23 April, 2006

Figure 2. Rainfall during the week ending 29 April, 2006

Satellite and radar Images
Figure 3. TC Monica near the Queensland coast, 19/04/2006, 12:30pm EST. Image from MTSAT satellite.

Figure 4. TC Monica near the NT coast, 24/04/2006, 3pm CST. Image from MTSAT satellite.

Figure 5. Weipa radar at 4pm EST on 19 April 2006.

Figure 6. Gove radar at 9:20pm CST on 23 April 2006.
