population, maps, real estate, averages, homes, statistics, relocation, travel, jobs, hospitals, schools, crime, moving, houses, news, sex offenders (original) (raw)
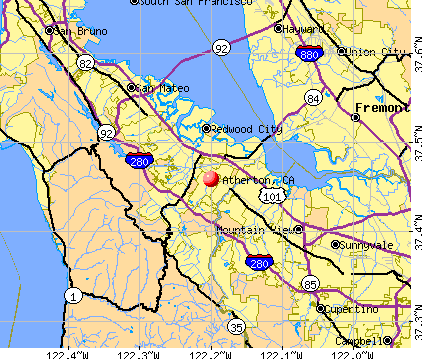
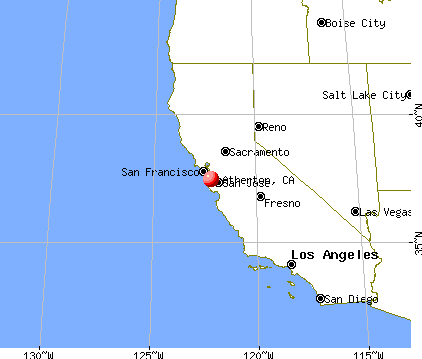
Atherton, California
Submit your own pictures of this town and show them to the world
OSM Map
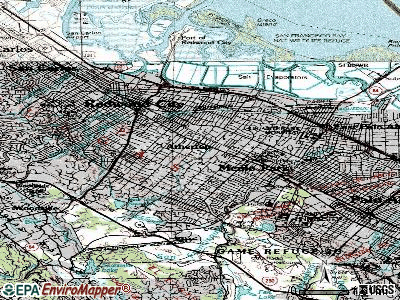
General Map
Google Map
MSN Map
OSM Map
General Map
Google Map
MSN Map
OSM Map
General Map
Google Map
MSN Map
OSM Map
General Map
Google Map
MSN Map
Please wait while loading the map...
Current weather forecast for Atherton, CA
Population in 2022: 6,898 (100% urban, 0% rural).
Population change since 2000: -4.1%
| Median resident age: | 47.5 years |
|---|---|
| California median age: | 37.9 years |
Zip codes: 94027.
Estimated median household income in 2022: over 200,000(∗∗itwas∗∗over200,000 (it was over 200,000(∗∗itwas∗∗over200,000 in 2000)
| Atherton: | over $200,000 |
|---|---|
| CA: | $91,551 |
Estimated per capita income in 2022: 192,529(∗∗itwas∗∗192,529 (it was 192,529(∗∗itwas∗∗112,408 in 2000)
Atherton town income, earnings, and wages data
Estimated median house or condo value in 2022: over 1,000,000(∗∗itwas∗∗over1,000,000 (it was over 1,000,000(∗∗itwas∗∗over1,000,000 in 2000)
| Atherton: | over $1,000,000 |
|---|---|
| CA: | $715,900 |
Mean prices in 2022: all housing units: over 1,000,000;∗∗detachedhouses:∗∗over1,000,000; detached houses: over 1,000,000;∗∗detachedhouses:∗∗over1,000,000; townhouses or other attached units: over $1,000,000
Median gross rent in 2022: $3,357.
March 2022 cost of living index in Atherton: 132.1 (high, U.S. average is 100)
Atherton, CA residents, houses, and apartments details
Percentage of residents living in poverty in 2022: 3.9%
(4.4% for White Non-Hispanic residents, 6.0% for Hispanic or Latino residents, 10.9% for other race residents, 7.7% for two or more races residents)
Detailed information about poverty and poor residents in Atherton, CA
Business Search - 14 Million verified businesses
- 4,37663.5%White alone
- 1,40520.4%Asian alone
- 6209.0%Hispanic
- 2313.4%Two or more races
- 941.4%Black alone
- 130.2%Native Hawaiian and Other
Pacific Islander alone - 30.04%American Indian alone
Crime rates in Atherton by year
| Type | 2009 | 2010 | 2011 | 2012 | 2013 | 2014 | 2015 | 2016 | 2017 | 2018 | 2019 | 2020 | 2022 |
|---|---|---|---|---|---|---|---|---|---|---|---|---|---|
| Murders(per 100,000) | 0(0.0) | 0(0.0) | 0(0.0) | 0(0.0) | 0(0.0) | 0(0.0) | 0(0.0) | 0(0.0) | 0(0.0) | 0(0.0) | 0(0.0) | 0(0.0) | 0(0.0) |
| Rapes(per 100,000) | 0(0.0) | 3(43.4) | 0(0.0) | 0(0.0) | 1(13.7) | 1(13.8) | 1(13.9) | 1(13.9) | 3(41.3) | 3(41.2) | 2(27.7) | 3(41.9) | 0(0.0) |
| Robberies(per 100,000) | 4(53.8) | 4(57.9) | 0(0.0) | 3(42.5) | 1(13.7) | 0(0.0) | 2(27.8) | 1(13.9) | 0(0.0) | 2(27.5) | 4(55.4) | 2(27.9) | 0(0.0) |
| Assaults(per 100,000) | 17(228.8) | 14(202.5) | 3(42.9) | 3(42.5) | 8(109.9) | 2(27.7) | 0(0.0) | 1(13.9) | 1(13.8) | 0(0.0) | 6(83.1) | 10(139.6) | 6(89.5) |
| Burglaries(per 100,000) | 42(565.3) | 28(405.0) | 11(157.3) | 27(382.4) | 34(467.2) | 31(429.3) | 30(416.4) | 14(194.0) | 12(165.4) | 31(425.5) | 32(443.1) | 39(544.5) | 18(268.5) |
| Thefts(per 100,000) | 153(2,059) | 107(1,548) | 121(1,730) | 97(1,374) | 78(1,072) | 42(581.6) | 54(749.5) | 84(1,164) | 61(840.7) | 73(1,002) | 74(1,025) | 99(1,382) | 58(865.2) |
| Auto thefts(per 100,000) | 9(121.1) | 1(14.5) | 3(42.9) | 0(0.0) | 3(41.2) | 2(27.7) | 2(27.8) | 6(83.1) | 2(27.6) | 3(41.2) | 4(55.4) | 4(55.9) | 1(14.9) |
| Arson(per 100,000) | 0(0.0) | 0(0.0) | 2(28.6) | 0(0.0) | 1(13.7) | 0(0.0) | 1(13.9) | 0(0.0) | 0(0.0) | 0(0.0) | 0(0.0) | 1(14.0) | 1(14.9) |
| City-Data.com crime index | 193.5 | 184.0 | 92.2 | 103.0 | 116.0 | 72.2 | 80.8 | 84.8 | 83.2 | 114.3 | 131.8 | 167.7 | 72.5 |
The City-Data.com crime index weighs serious crimes and violent crimes more heavily. Higher means more crime, U.S. average is 246.1. It adjusts for the number of visitors and daily workers commuting into cities.
Click on a table row to update graph
Full-time law enforcement employees in 2021, including police officers: 30 (22 officers - 20 male; 2 female).
| Officers per 1,000 residents here: | 3.13 |
|---|---|
| California average: | 2.30 |
Latest news from Atherton, CA collected exclusively by city-data.com from local newspapers, TV, and radio stations
Ancestries: German (7.6%), European (6.8%), Italian (5.8%), English (5.2%), American (3.8%), Irish (3.1%).
Current Local Time: PST time zone
Incorporated on 09/12/1923
Elevation: 60 feet
Land area: 4.90 square miles.
Population density: 1,407 people per square mile (low).
1,476 residents are foreign born (11.2% Asia, 7.1% Europe).
| This town: | 21.4% |
|---|---|
| California: | 26.5% |
Median real estate property taxes paid for housing units with mortgages in 2022: $10,118 (0.5%)
Median real estate property taxes paid for housing units with no mortgage in 2022: $10,893 (0.5%)
Nearest city with pop. 50,000+: Redwood City, CA (2.6 miles , pop. 75,402).
Nearest city with pop. 200,000+: Fremont, CA (13.3 miles , pop. 203,413).
Nearest city with pop. 1,000,000+: Los Angeles, CA (316.9 miles , pop. 3,694,820).
Nearest cities:
Latitude: 37.46 N**, Longitude:** 122.20 W
Daytime population change due to commuting: +857 (+12.4%)
Workers who live and work in this town: 1,383 (49.9%)
Area code commonly used in this area: 650
Property values in Atherton, CA
Atherton, California accommodation & food services, waste management - Economy and Business Data
Single-family new house construction building permits:
- 2022: 23 buildings , average cost: $3,211,800
- 2021: 27 buildings , average cost: $3,322,500
- 2020: 23 buildings , average cost: $2,619,600
- 2019: 20 buildings , average cost: $3,173,700
- 2018: 29 buildings , average cost: $3,240,400
- 2017: 30 buildings , average cost: $3,945,600
- 2016: 27 buildings , average cost: $2,971,900
- 2015: 31 buildings , average cost: $3,097,000
- 2014: 33 buildings , average cost: $3,229,100
- 2013: 28 buildings , average cost: $3,335,700
- 2012: 31 buildings , average cost: $2,912,700
- 2011: 27 buildings , average cost: $2,728,500
- 2010: 14 buildings , average cost: $3,608,400
- 2009: 10 buildings , average cost: $2,738,000
- 2008: 24 buildings , average cost: $2,828,100
- 2007: 14 buildings , average cost: $2,173,500
- 2006: 22 buildings , average cost: $1,759,500
- 2005: 31 buildings , average cost: $1,890,300
- 2004: 31 buildings , average cost: $1,898,800
- 2003: 27 buildings , average cost: $1,860,900
- 2002: 28 buildings , average cost: $2,007,600
- 2001: 12 buildings , average cost: $687,300
- 2000: 12 buildings , average cost: $687,300
- 1999: 12 buildings , average cost: $687,400
- 1998: 14 buildings , average cost: $686,900
- 1997: 14 buildings , average cost: $689,100
Unemployment in December 2023:
Population change in the 1990s: +309 (+4.5%).
Most common industries in Atherton, CA (%)
- Professional, scientific, technical services (20.0%)
- Finance & insurance (9.1%)
- Health care (8.5%)
- Educational services (8.4%)
- Computer & electronic products (8.4%)
- Real estate & rental & leasing (4.6%)
- Construction (4.4%)
Most common occupations in Atherton, CA (%)
- Top executives (10.9%)
- Other management occupations, except farmers and farm managers (10.6%)
- Other sales and related occupations, including supervisors (6.3%)
- Other financial specialists (4.6%)
- Lawyers (4.6%)
- Physicians and surgeons (4.2%)
- Sales representatives, services, wholesale and manufacturing (3.8%)
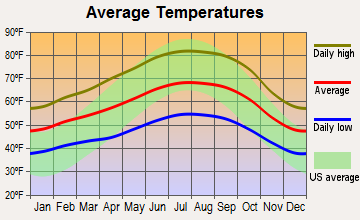
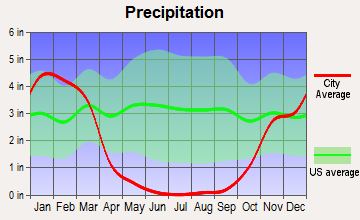
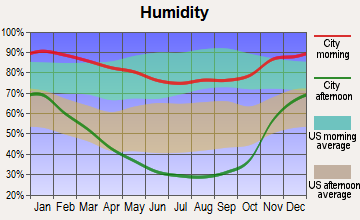
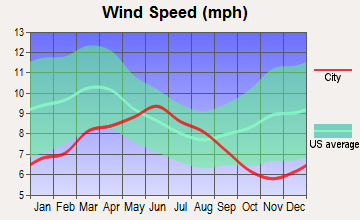
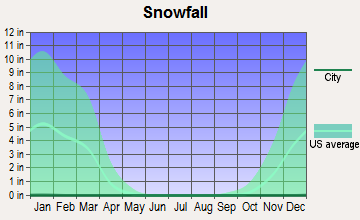
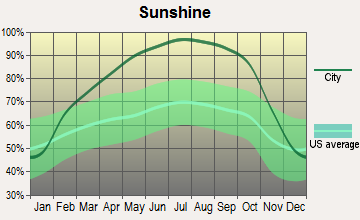
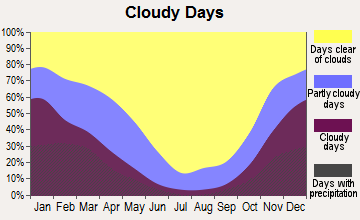
Average climate in Atherton, California
Based on data reported by over 4,000 weather stations

Air pollution and air quality trends (lower is better)
Air Quality Index (AQI) level in 2023 was 85.6**. This is about average.**
Earthquake activity:
Atherton-area historical earthquake activity is significantly above California state average. It is 7467% greater than the overall U.S. average.
On 4/18/1906 at 13:12:21**, a magnitude** 7.9 (7.9 UK**, Class:** Major**, Intensity:** VIII - XII) earthquake occurred 57.6 miles away from Atherton center, causing $524,000,000 total damage
On 10/18/1989 at 00:04:15**, a magnitude** 7.1 (6.5 MB**,** 7.1 MS**,** 6.9 MW**,** 7.0 ML) earthquake occurred 33.8 miles away from the city center, causing 62 deaths (62 shaking deaths) and 3757 injuries, causing $1,305,032,704 total damage
On 11/4/1927 at 13:51:53**, a magnitude** 7.5 (7.5 UK) earthquake occurred 187.6 miles away from the city center
On 7/21/1952 at 11:52:14**, a magnitude** 7.7 (7.7 UK) earthquake occurred 246.5 miles away from Atherton center, causing $50,000,000 total damage
On 1/31/1922 at 13:17:28**, a magnitude** 7.6 (7.6 UK) earthquake occurred 287.5 miles away from Atherton center
On 4/25/1992 at 18:06:04**, a magnitude** 7.2 (6.3 MB**,** 7.1 MS**,** 7.2 MW**,** 7.1 MW**, Depth:** 9.4 mi) earthquake occurred 223.8 miles away from Atherton center, causing $75,000,000 total damage
Magnitude types: body-wave magnitude (MB), local magnitude (ML), surface-wave magnitude (MS), moment magnitude (MW)
Natural disasters:
The number of natural disasters in San Mateo County (18) is near the US average (15).
Major Disasters (Presidential) Declared: 11
Emergencies Declared: 2
Causes of natural disasters: Floods: 11**, Storms:** 6**, Mudslides:** 5**, Winter Storms:** 5**, Landslides:** 4**, Fires:** 2**, Drought:** 1**, Earthquake:** 1**, Freeze:** 1**, Hurricane:** 1**, Tornado:** 1**, Other:** 1 (Note: some incidents may be assigned to more than one category).
Hospitals and medical centers near Atherton:
- ATHERTON HEALTHCARE (Nursing Home, about 1 miles away; MENLO PARK, CA)
- PENINSULA PLAZA HEALTH CARE CENTER (Nursing Home, about 1 miles away; MENLO PARK, CA)
- LAUREL GLEN CONVALESCENT HOSPITAL (Nursing Home, about 2 miles away; REDWOOD CITY, CA)
- ELLIPSE (Nursing Home, about 2 miles away; REDWOOD CITY, CA)
- WOODSIDE WOMENS HOSPITAL (Hospital, about 2 miles away; REDWOOD CITY, CA)
- VI AT PALO ALTO (Nursing Home, about 2 miles away; PALO ALTO, CA)
- STANFORD HOSPITAL Acute Care Hospitals (about 3 miles away; STANFORD, CA)
Amtrak stations near Atherton:
- 13 miles: FREMONT (CENTERVILLE, FREMONT & PERALTA BLVDS.) . Services: fully wheelchair accessible, enclosed waiting area, public restrooms, public payphones, snack bar, free short-term parking, free long-term parking, call for car rental service, call for taxi service, public transit connection.
- 15 miles: MILLBRAE (MILLBRAE AVE. & CALIFORNIA DR.) - Bus Station . Services: fully wheelchair accessible, public payphones, free short-term parking, call for taxi service, public transit connection.
- 15 miles: SAN FRANCISCO INT'L AIRPO (SAN BRUNO, SAN FRANCISCO INTERNATIONAL AIRPORT) - Bus Station . Services: fully wheelchair accessible, enclosed waiting area, public restrooms, public payphones, snack bar, paid short-term parking, paid long-term parking, car rental agency, taxi stand, public transit connection.
College/University in Atherton:
- Menlo College (Full-time enrollment: 723; Location: 1000 El Camino Real; Private, not-for-profit; Website: www.menlo.edu)
Colleges/universities with over 2000 students nearest to Atherton:
- Stanford University (about 3 miles; Stanford, CA; Full-time enrollment: 14,410)
- Canada College (about 4 miles; Redwood City, CA; FT enrollment: 3,446)
- Foothill College (about 8 miles; Los Altos Hills, CA; FT enrollment: 9,635)
- College of San Mateo (about 10 miles; San Mateo, CA; FT enrollment: 5,398)
- Mission College (about 13 miles; Santa Clara, CA; FT enrollment: 5,625)
- De Anza College (about 13 miles; Cupertino, CA; FT enrollment: 16,729)
- Chabot College (about 14 miles; Hayward, CA; FT enrollment: 7,610)
Public high school in Atherton:
- MENLO-ATHERTON HIGH (Students: 1,429, Location: 555 MIDDLEFIELD RD., Grades: 9-12)
Private high school in Atherton:
- SACRED HEART SCHOOLS ATHERTON (Students: 1,103, Location: 150 VALPARAISO AVE, Grades: PK-12)
Public elementary/middle schools in Atherton:
- SELBY LANE ELEMENTARY (Students: 511, Location: 170 SELBY LN., Grades: KG-8)
- ENCINAL ELEMENTARY (Students: 436, Location: 195 ENCINAL AVE., Grades: KG-5)
- LAS LOMITAS ELEMENTARY (Students: 263, Location: 299 ALAMEDA DE LAS PULGAS, Grades: KG-3)
- LAUREL ELEMENTARY (Location: 95 EDGE RD., Grades: KG-3)
See full list of schools located in Atherton
Points of interest:
Click to draw/clear town borders
Notable locations in Atherton: Menlo Circus Club (A), Vallombrosa Catholic Retreat Center (B), Atherton City Hall (C), Atherton Branch San Mateo County Library (D), Bowman Library (E), O'Brien Hall (F), Michaels Hall (G), Kratt Hall (H), Howard Hall (I), Haynes-Prim Pavilion Sports Center (J), Florence Moore Science Building (K), El Camino Hall (L), Brawner Hall (M), Menlo Park Fire Protection District Station 3 (N). Display/hide their locations on the map
Church in Atherton: Church of the Nativity (A). Display/hide its location on the map
Reservoir: Bear Gulch Reservoir (A). Display/hide its location on the map
Parks in Atherton include: Cartan Athletic Fields (1), Holbrook-Palmer Park (2), Redding Park (3). Display/hide their locations on the map
Birthplace of: Drew Fuller - Film actor.
San Mateo County has a predicted average indoor radon screening level between 2 and 4 pCi/L (pico curies per liter) - Moderate Potential
Average household size:
| This town: | 2.8 people |
|---|---|
| California: | 2.9 people |
Percentage of family households:
| This town: | 82.1% |
|---|---|
| Whole state: | 68.7% |
Percentage of households with unmarried partners:
| This town: | 2.1% |
|---|---|
| Whole state: | 7.2% |
Likely homosexual households (counted as self-reported same-sex unmarried-partner households)
- Lesbian couples: 0.3% of all households
- Gay men: 0.3% of all households
332 people in college/university student housing in 2010
53 people in other noninstitutional facilities in 2010
People in group quarters in Atherton in 2000:
- 254 people in college dormitories (includes college quarters off campus)
- 49 people in religious group quarters
- 15 people in nursing homes
For population 15 years and over in Atherton:
- Never married: 37.5%
- Now married: 55.6%
- Separated: 1.2%
- Widowed: 3.6%
- Divorced: 2.2%
For population 25 years and over in Atherton:
- High school or higher: 99.5%
- Bachelor's degree or higher: 86.0%
- Graduate or professional degree: 56.7%
- Unemployed: 2.0%
- Mean travel time to work (commute): 12.2 minutes
Education Gini index (Inequality in education)
| Here: | 7.6 |
|---|---|
| California average: | 15.5 |
Graphs represent county-level data. Detailed 2008 Election Results
Political contributions by individuals in Atherton, CA
Religion statistics for Atherton, CA (based on San Mateo County data)
| Religion | Adherents | Congregations |
|---|---|---|
| Catholic | 243,634 | 22 |
| Other | 31,697 | 78 |
| Evangelical Protestant | 24,771 | 166 |
| Mainline Protestant | 23,840 | 74 |
| Orthodox | 5,350 | 5 |
| Black Protestant | 2,046 | 12 |
| None | 387,113 | - |
Source: Clifford Grammich, Kirk Hadaway, Richard Houseal, Dale E.Jones, Alexei Krindatch, Richie Stanley and Richard H.Taylor. 2012. 2010 U.S.Religion Census: Religious Congregations & Membership Study. Association of Statisticians of American Religious Bodies. Jones, Dale E., et al. 2002. Congregations and Membership in the United States 2000. Nashville, TN: Glenmary Research Center. Graphs represent county-level data
Food Environment Statistics:
**Number of grocery stores: 171
| Here: | 2.44 / 10,000 pop. |
|---|---|
| California: | 2.14 / 10,000 pop. |
**Number of supercenters and club stores: 4
| This county: | 0.06 / 10,000 pop. |
|---|---|
| California: | 0.04 / 10,000 pop. |
**Number of convenience stores (no gas): 39
| San Mateo County: | 0.56 / 10,000 pop. |
|---|---|
| California: | 0.62 / 10,000 pop. |
**Number of convenience stores (with gas): 114
| San Mateo County: | 1.62 / 10,000 pop. |
|---|---|
| State: | 1.49 / 10,000 pop. |
**Number of full-service restaurants: 703
| This county: | 10.02 / 10,000 pop. |
|---|---|
| California: | 7.42 / 10,000 pop. |
**Adult diabetes rate:
| San Mateo County: | 7.1% |
|---|---|
| California: | 7.3% |
**Low-income preschool obesity rate:
| San Mateo County: | 18.0% |
|---|---|
| California: | 17.9% |
Health and Nutrition:
**Average overall health of teeth and gums:
**Average BMI:
| This city: | 27.4 |
|---|---|
| California: | 28.1 |
**People feeling badly about themselves:
| Atherton: | 15.8% |
|---|---|
| State: | 20.2% |
**People not drinking alcohol at all:
| Atherton: | 8.9% |
|---|---|
| California: | 11.2% |
**Average hours sleeping at night:
| This city: | 7.0 |
|---|---|
| California: | 6.8 |
**Overweight people:
| Atherton: | 33.8% |
|---|---|
| State: | 31.5% |
**General health condition:
| Here: | 63.6% |
|---|---|
| California: | 56.4% |
**Average condition of hearing:
| Atherton: | 79.8% |
|---|---|
| State: | 80.9% |
More about Health and Nutrition of Atherton, CA Residents
| Local government employment and payroll (March 2022) | |||||
|---|---|---|---|---|---|
| Function | Full-time employees | Monthly full-time payroll | Average yearly full-time wage | Part-time employees | Monthly part-time payroll |
| Police Protection - Officers | 21 | 284,250∣284,250 | 284,250∣162,429 | 3 | $7,805 |
| Police - Other | 9 | 81,993∣81,993 | 81,993∣109,324 | 0 | $0 |
| Other and Unallocable | 3 | 40,716∣40,716 | 40,716∣162,864 | 0 | $0 |
| Other Government Administration | 3 | 44,651∣44,651 | 44,651∣178,604 | 1 | $531 |
| Financial Administration | 3 | 38,192∣38,192 | 38,192∣152,768 | 0 | $0 |
| Parks and Recreation | 1 | 5,509∣5,509 | 5,509∣66,108 | 0 | $0 |
| Totals for Government | 40 | 495,311∣495,311 | 495,311∣148,593 | 4 | $8,337 |
Atherton government finances - Expenditure in 2017 (per resident):
- Construction - Regular Highways: 1,655,000(1,655,000 (1,655,000(239.92)
- Current Operations - Police Protection: 6,614,000(6,614,000 (6,614,000(958.83)
Central Staff Services: 4,058,000(4,058,000 (4,058,000(588.29)
Regular Highways: 1,743,000(1,743,000 (1,743,000(252.68)
Protective Inspection and Regulation - Other: 1,199,000(1,199,000 (1,199,000(173.82)
Financial Administration: 615,000(615,000 (615,000(89.16)
Parks and Recreation: 125,000(125,000 (125,000(18.12)
Libraries: 21,000(21,000 (21,000(3.04)
Sewerage: 1,000(1,000 (1,000(0.14) - Other Capital Outlay - Police Protection: 43,000(43,000 (43,000(6.23)
Parks and Recreation: 38,000(38,000 (38,000(5.51)
Central Staff Services: 37,000(37,000 (37,000(5.36)
Protective Inspection and Regulation - Other: 2,000(2,000 (2,000(0.29)
Atherton government finances - Revenue in 2017 (per resident):
- Charges - Other: 2,510,000(2,510,000 (2,510,000(363.87)
Parks and Recreation: 273,000(273,000 (273,000(39.58)
- Miscellaneous - Donations From Private Sources: 783,000(783,000 (783,000(113.51)
Interest Earnings: 194,000(194,000 (194,000(28.12)
Fines and Forfeits: 168,000(168,000 (168,000(24.35)
Rents: 141,000(141,000 (141,000(20.44)
General Revenue - Other: 22,000(22,000 (22,000(3.19) - State Intergovernmental - Other: 239,000(239,000 (239,000(34.65)
Highways: 148,000(148,000 (148,000(21.46)
General Local Government Support: 36,000(36,000 (36,000(5.22) - Tax - Property: 9,037,000(9,037,000 (9,037,000(1310.09)
Other: 2,864,000(2,864,000 (2,864,000(415.19)
Other License: 1,762,000(1,762,000 (1,762,000(255.44)
General Sales and Gross Receipts: 1,070,000(1,070,000 (1,070,000(155.12)
Public Utilities Sales: 833,000(833,000 (833,000(120.76)
Documentary and Stock Transfer: 409,000(409,000 (409,000(59.29)
Occupation and Business License - Other: 241,000(241,000 (241,000(34.94)
Atherton government finances - Cash and Securities in 2017 (per resident):
- Bond Funds - Cash and Securities: 8,155,000(8,155,000 (8,155,000(1182.23)
- Other Funds - Cash and Securities: 32,883,000(32,883,000 (32,883,000(4767.03)
6.99% of this county's 2021 resident taxpayers lived in other counties in 2020 ($178,839 average adjusted gross income)
| Here: | 6.99% |
|---|---|
| California average: | 5.19% |
0.01% of residents moved from foreign countries ($58 average AGI)
San Mateo County: 0.01% California average: 0.03%
Top counties from which taxpayers relocated into this county between 2020 and 2021:
9.90% of this county's 2020 resident taxpayers moved to other counties in 2021 ($222,747 average adjusted gross income)
| Here: | 9.90% |
|---|---|
| California average: | 6.14% |
0.01% of residents moved to foreign countries ($372 average AGI)
San Mateo County: 0.01% California average: 0.02%
Top counties to which taxpayers relocated from this county between 2020 and 2021:
Strongest AM radio stations in Atherton:
- KNBR (680 AM; 50 kW; SAN FRANCISCO, CA; Owner: KNBR LICO, INC.)
- KGO (810 AM; 50 kW; SAN FRANCISCO, CA; Owner: KGO-AM RADIO, INC.)
- KYCY (1550 AM; 50 kW; SAN FRANCISCO, CA; Owner: INFINITY BROADCASTING OPERATIONS, INC.)
- KTCT (1050 AM; 50 kW; SAN MATEO, CA; Owner: SUSQUEHANNA RADIO CORP.)
- KSFB (1220 AM; 5 kW; PALO ALTO, CA; Owner: SCA-PALO ALTO, LLC)
- KFAX (1100 AM; 50 kW; SAN FRANCISCO, CA; Owner: GOLDEN GATE BROADCASTING CO, INC.)
- KTRB (860 AM; 50 kW; MODESTO, CA; Owner: PAPPAS RADIO OF CALIFORNIA, A CALIFORNIA LIMITED PARTNERSHIP)
- KLOK (1170 AM; 50 kW; SAN JOSE, CA; Owner: ENTRAVISION HOLDINGS, LLC)
- KIQI (1010 AM; 35 kW; SAN FRANCISCO, CA; Owner: RADIO UNICA OF SAN FRANCISCO LICENSE CORP.)
- KCBS (740 AM; 50 kW; SAN FRANCISCO, CA; Owner: INFINITY BROADCASTING OPERATIONS, INC.)
- KNEW (910 AM; 20 kW; OAKLAND, CA; Owner: AMFM RADIO LICENSES, L.L.C.)
- KSJX (1500 AM; 10 kW; SAN JOSE, CA; Owner: MULTICULTURAL RADIO BROADCASTING INC)
- KSFO (560 AM; 5 kW; SAN FRANCISCO, CA; Owner: KGO-AM RADIO, INC.)
Strongest FM radio stations in Atherton:
- KFJC (89.7 FM; LOS ALTOS, CA; Owner: FOOTHILL-DE ANZA COMM. COLLEGE DIST.)
- KCEA (89.1 FM; ATHERTON, CA; Owner: MENLO-ATHERTON HIGH SCHOOL)
- KZBR-FM2 (95.7 FM; LIVERMORE, ETC., CA; Owner: BONNEVILLE HOLDING COMPANY)
- KKSF-FM1 (103.7 FM; PLEASANTON, ETC., CA; Owner: AMFM RADIO LICENSES, L.L.C.)
- KBAA (94.5 FM; GILROY, CA; Owner: INFINITY RADIO OPERATIONS INC.)
- KFRC-FM3 (99.7 FM; WALNUT CREEK, CA; Owner: INFINITY KFRC-FM, INC.)
- KZBR-FM1 (95.7 FM; WALNUT CREEK, CA; Owner: BONNEVILLE HOLDING COMPANY)
- KBLX-FM2 (102.9 FM; PLEASANTON, CA; Owner: ICBC BROADCAST HOLDINGS -CA, INC.)
- KSOL-FM3 (98.9 FM; PLEASANTON, CA; Owner: TMS LICENSE CALIFORNIA, INC)
- KISQ-FM3 (98.1 FM; CONCORD, CA; Owner: AMFM RADIO LICENSES, L.L.C.)
- KSQL (99.1 FM; SANTA CRUZ, CA; Owner: TMS LICENSE CALIFORNIA, INC)
- KKUP (91.5 FM; CUPERTINO, CA; Owner: ASSURANCE SCIENCES FOUNDATION)
- KBRG (100.3 FM; SAN JOSE, CA; Owner: ENTRAVISION HOLDINGS, LLC)
- KMEL-FM1 (106.1 FM; CONCORD, CA; Owner: AMFM RADIO LICENSES, L.L.C.)
- KYLD (94.9 FM; SAN FRANCISCO, CA; Owner: AMFM RADIO LICENSES, L.L.C.)
- KFRC-FM (99.7 FM; SAN FRANCISCO, CA; Owner: INFINITY KFRC-FM, INC.)
- KBLX-FM (102.9 FM; BERKELEY, CA; Owner: ICBC BROADCAST HOLDINGS - CA, INC.)
- KZBR (95.7 FM; SAN FRANCISCO, CA; Owner: BONNEVILLE HOLDING COMPANY)
- KMEL (106.1 FM; SAN FRANCISCO, CA; Owner: AMFM RADIO LICENSES, L.L.C.)
- KSAN (107.7 FM; SAN MATEO, CA; Owner: SUSQUEHANNA RADIO CORP.)
TV broadcast stations around Atherton:
- KQED (Channel 9; SAN FRANCISCO, CA; Owner: KQED, INC.)
- KGO-TV (Channel 7; SAN FRANCISCO, CA; Owner: KGO TELEVISION, INC.)
- KPIX-TV (Channel 5; SAN FRANCISCO, CA; Owner: CBS BROADCASTING INC.)
- KTVU (Channel 2; OAKLAND, CA; Owner: KTVU PARTNERSHIP)
- KBIT-CA (Channel 28; SAN FRANCISCO, ETC., CA; Owner: POLAR BROADCASTING, INC.)
- KRON-TV (Channel 4; SAN FRANCISCO, CA; Owner: YOUNG BROADCASTING OF SAN FRANCISCO, INC.)
- KMTP-TV (Channel 32; SAN FRANCISCO, CA; Owner: MINORITY TELEVISION PROJECT)
- KBHK-TV (Channel 44; SAN FRANCISCO, CA; Owner: VIACOM TELEVISION STATIONS GROUP OF SAN FRANCISCO INC.)
- KCSM-TV (Channel 60; SAN MATEO, CA; Owner: SAN MATEO COUNTY COMMUNITY COLLEGE DISTRICT)
- KICU-TV (Channel 36; SAN JOSE, CA; Owner: KTVU PARTNERSHIP)
- KBWB (Channel 20; SAN FRANCISCO, CA; Owner: KBWB LICENSE, INC.)
- KFSF (Channel 66; VALLEJO, CA; Owner: TELEFUTURA SAN FRANCISCO LLC)
- KCNS (Channel 38; SAN FRANCISCO, CA; Owner: WRAY, INC.)
- KTEH (Channel 54; SAN JOSE, CA; Owner: KTEH FOUNDATION)
- KDTV (Channel 14; SAN FRANCISCO, CA; Owner: KDTV LICENSE PARTNERSHIP, G.P.)
- KSTS (Channel 48; SAN JOSE, CA; Owner: TELEMUNDO OF NORTHERN CALIFORNIA LICENSE CORP.)
- KTSF (Channel 26; SAN FRANCISCO, CA; Owner: LINCOLN BROADCASTING COMPANY, A CALIFORNIA LP)
Atherton fatal accident statistics for 1975 - 2021
FCC Registered Antenna Towers:
11 (See the full list of FCC Registered Antenna Towers in Atherton)
FCC Registered Broadcast Land Mobile Towers:
4
- 2600 Se Of Woodside Rd On Moore Rd (Lat: 37.433278 Lon: -122.233028), Call Sign: KML373,
Assigned Frequencies: 47.9000 MHz, Grant Date: 04/01/2014, Expiration Date: 06/20/2024, Registrant: Callifornia Water Service Company, 1720 North First Street, San Jose, CA 95112, Phone: (408) 367-8242, Fax: (408) 367-8427, Email: - Lat: 37.440278 Lon: -122.221389, Call Sign: WQBJ957,
Assigned Frequencies: 451.337 MHz, 456.337 MHz, Grant Date: 10/15/2014, Expiration Date: 10/22/2024, Certifier: Ellen Michelson, Registrant: Universal Licensing Service, 4401-A Connecticut Ave Nw #232, Washington, DC 20008, Phone: (877) 677-3639, Email: - 555 Middlefield Rd (Lat: 37.461889 Lon: -122.175528), Type: Bant, Structure height: 12.2 m, Overall height: 15.2 m, Call Sign: WQCR762,
Assigned Frequencies: 464.150 MHz, 463.200 MHz, Grant Date: 02/25/2015, Expiration Date: 05/10/2025, Certifier: Clint Walker, Registrant: Bridge Wireless, 2988 Meridian Avenue, San Jose, CA 95124, Phone: (408) 264-8500, Fax: (650) 306-1766, Email: - Lat: 37.463806 Lon: -122.186250, Call Sign: WRDQ964,
Assigned Frequencies: 467.900 MHz, 468.462 MHz, 468.962 MHz, 469.262 MHz, Grant Date: 07/02/2019, Expiration Date: 07/02/2029, Certifier: Ahmad R Sheikholeslami, Registrant: Atlas License Company & Data Services, 176 West Logan Street, Ste. 227, Noblesville, IN 46060, Phone: (317) 813-4865, Fax: (317) 900-7940, Email:
FCC Registered Microwave Towers:
5
- 555 Middlefield Road, 555 Middlefield Road (Lat: 37.461333 Lon: -122.175833), Type: Nntann, Structure height: 8.5 m, Overall height: 12.2 m, Call Sign: WPQQ795,
Assigned Frequencies: 949.500 MHz, Grant Date: 08/21/2000, Expiration Date: 12/01/2029, Certifier: Donald G Gielow, Registrant: Garvey, Schubert & Barer, 1000 Potomac Str. Nw, 5th Floor, Washington, DC 20007, Phone: (202) 965-7880, Fax: (202) 965-1729, Email: - Bear Gulch Station 5, 0.5mi Se Of Woodside Rd On Moore Rd (Lat: 37.433111 Lon: -122.231722), Type: Pole, Structure height: 19.8 m, Overall height: 21.3 m, Call Sign: WQUY953,
Assigned Frequencies: 10895.0 MHz, Grant Date: 11/21/2014, Expiration Date: 11/21/2024, Cancellation Date: 05/02/2016, Certifier: Clyde Mcmorrow, Registrant: Black & Associates, 2052 Bridgegate Court, Westlake Village, CA 91361, Phone: (805) 495-7619, Email: - ATHERTON, 1 Edge Rd (Lat: 37.466861 Lon: -122.175083), Type: Building, Structure height: 26 m, Overall height: 27 m, Call Sign: WQYB787,
Assigned Frequencies: 11565.0 MHz, 11565.0 MHz, 11565.0 MHz, 11565.0 MHz, 11565.0 MHz, 11565.0 MHz, 11645.0 MHz, 11645.0 MHz, 11645.0 MHz, 11645.0 MHz, 11645.0 MHz, 11645.0 MHz, Grant Date: 08/10/2016, Expiration Date: 08/10/2026, Certifier: Paul M Farmwald, Registrant: Intelpath, 111 Fuller Rd, Hinsdale, IL 60521, Phone: (312) 841-9188, Email: - Atherton, 1142 Moore Road (Lat: 37.433111 Lon: -122.231722), Type: Pole, Structure height: 18.3 m, Overall height: 21.3 m, Call Sign: WRKA682,
Assigned Frequencies: 941.293 MHz, 932.293 MHz, 941.293 MHz, 932.293 MHz, 941.293 MHz, 932.293 MHz, Grant Date: 12/01/2020, Expiration Date: 12/01/2030, Certifier: Brian Nance, Registrant: Black & Associates, 2052 Bridgegate Court, Westlake Village, CA 91361, Phone: (805) 495-7619, Email: - STATION, 91 Ashfield Rd (Lat: 37.463528 Lon: -122.197444), Overall height: 30.5 m, Call Sign: KZI88,
Assigned Frequencies: 6645.00 MHz, 23175.0 MHz, Grant Date: 03/17/2020, Expiration Date: 06/07/2030, Registrant: San Mateo County Isd-Radio Shop, 455 County Center, Redwood City, CA 94063, Phone: (650) 363-4442, Email:
FCC Registered Amateur Radio Licenses:
73 (See the full list of FCC Registered Amateur Radio Licenses in Atherton)
FAA Registered Aircraft:
24 (See the full list of FAA Registered Aircraft in Atherton)
| Home Mortgage Disclosure Act Aggregated Statistics For Year 2009_(Based on 2 full tracts)_ | ||||||||||
|---|---|---|---|---|---|---|---|---|---|---|
| A) FHA, FSA/RHS & VAHome Purchase Loans | B) ConventionalHome Purchase Loans | C) Refinancings | D) Home Improvement Loans | F) Non-occupant Loans on < 5 Family Dwellings (A B C & D) | ||||||
| Number | Average Value | Number | Average Value | Number | Average Value | Number | Average Value | Number | Average Value | |
| LOANS ORIGINATED | 1 | 743,000∣43∣743,000 | 43 | 743,000∣43∣1,168,930 | 236 | 1,043,114∣5∣1,043,114 | 5 | 1,043,114∣5∣514,400 | 6 | $1,676,667 |
| APPLICATIONS APPROVED, NOT ACCEPTED | 0 | 0∣3∣0 | 3 | 0∣3∣695,333 | 30 | 624,400∣0∣624,400 | 0 | 624,400∣0∣0 | 1 | $1,713,000 |
| APPLICATIONS DENIED | 0 | 0∣5∣0 | 5 | 0∣5∣1,598,600 | 38 | 1,437,789∣3∣1,437,789 | 3 | 1,437,789∣3∣795,000 | 0 | $0 |
| APPLICATIONS WITHDRAWN | 0 | 0∣7∣0 | 7 | 0∣7∣840,429 | 31 | 872,065∣4∣872,065 | 4 | 872,065∣4∣800,000 | 1 | $300,000 |
| FILES CLOSED FOR INCOMPLETENESS | 0 | 0∣3∣0 | 3 | 0∣3∣2,313,333 | 4 | 1,048,500∣0∣1,048,500 | 0 | 1,048,500∣0∣0 | 0 | $0 |
| Aggregated Statistics For Year 2008_(Based on 2 full tracts)_ | ||||||||
|---|---|---|---|---|---|---|---|---|
| B) ConventionalHome Purchase Loans | C) Refinancings | D) Home Improvement Loans | F) Non-occupant Loans on < 5 Family Dwellings (A B C & D) | |||||
| Number | Average Value | Number | Average Value | Number | Average Value | Number | Average Value | |
| LOANS ORIGINATED | 35 | 2,112,543∣110∣2,112,543 | 110 | 2,112,543∣110∣1,418,773 | 3 | 944,667∣7∣944,667 | 7 | 944,667∣7∣2,317,429 |
| APPLICATIONS APPROVED, NOT ACCEPTED | 9 | 1,422,556∣16∣1,422,556 | 16 | 1,422,556∣16∣1,931,562 | 1 | 367,000∣2∣367,000 | 2 | 367,000∣2∣1,100,000 |
| APPLICATIONS DENIED | 7 | 2,143,571∣29∣2,143,571 | 29 | 2,143,571∣29∣1,947,379 | 4 | 1,502,500∣1∣1,502,500 | 1 | 1,502,500∣1∣1,000,000 |
| APPLICATIONS WITHDRAWN | 9 | 2,072,222∣20∣2,072,222 | 20 | 2,072,222∣20∣1,524,150 | 3 | 2,666,667∣2∣2,666,667 | 2 | 2,666,667∣2∣1,925,000 |
| FILES CLOSED FOR INCOMPLETENESS | 1 | 2,000,000∣6∣2,000,000 | 6 | 2,000,000∣6∣995,000 | 1 | 100,000∣1∣100,000 | 1 | 100,000∣1∣1,200,000 |
| Aggregated Statistics For Year 2007_(Based on 2 full tracts)_ | ||||||||||
|---|---|---|---|---|---|---|---|---|---|---|
| B) ConventionalHome Purchase Loans | C) Refinancings | D) Home Improvement Loans | F) Non-occupant Loans on < 5 Family Dwellings (A B C & D) | G) Loans On ManufacturedHome Dwelling (A B C & D) | ||||||
| Number | Average Value | Number | Average Value | Number | Average Value | Number | Average Value | Number | Average Value | |
| LOANS ORIGINATED | 83 | 2,652,205∣129∣2,652,205 | 129 | 2,652,205∣129∣1,892,217 | 6 | 1,862,333∣12∣1,862,333 | 12 | 1,862,333∣12∣2,670,500 | 0 | $0 |
| APPLICATIONS APPROVED, NOT ACCEPTED | 9 | 1,229,444∣27∣1,229,444 | 27 | 1,229,444∣27∣1,745,852 | 0 | 0∣1∣0 | 1 | 0∣1∣500,000 | 1 | $110,000 |
| APPLICATIONS DENIED | 9 | 2,189,111∣47∣2,189,111 | 47 | 2,189,111∣47∣2,042,340 | 2 | 3,542,500∣1∣3,542,500 | 1 | 3,542,500∣1∣1,000,000 | 1 | $72,000 |
| APPLICATIONS WITHDRAWN | 9 | 1,827,111∣24∣1,827,111 | 24 | 1,827,111∣24∣1,688,042 | 0 | 0∣1∣0 | 1 | 0∣1∣2,100,000 | 0 | $0 |
| FILES CLOSED FOR INCOMPLETENESS | 2 | 1,345,000∣6∣1,345,000 | 6 | 1,345,000∣6∣1,096,167 | 0 | 0∣0∣0 | 0 | 0∣0∣0 | 0 | $0 |
| Aggregated Statistics For Year 2006_(Based on 2 full tracts)_ | ||||||||||
|---|---|---|---|---|---|---|---|---|---|---|
| B) ConventionalHome Purchase Loans | C) Refinancings | D) Home Improvement Loans | F) Non-occupant Loans on < 5 Family Dwellings (A B C & D) | G) Loans On ManufacturedHome Dwelling (A B C & D) | ||||||
| Number | Average Value | Number | Average Value | Number | Average Value | Number | Average Value | Number | Average Value | |
| LOANS ORIGINATED | 93 | 1,940,957∣160∣1,940,957 | 160 | 1,940,957∣160∣1,613,106 | 12 | 1,614,583∣14∣1,614,583 | 14 | 1,614,583∣14∣2,070,571 | 0 | $0 |
| APPLICATIONS APPROVED, NOT ACCEPTED | 26 | 1,386,269∣19∣1,386,269 | 19 | 1,386,269∣19∣1,378,000 | 3 | 443,333∣0∣443,333 | 0 | 443,333∣0∣0 | 0 | $0 |
| APPLICATIONS DENIED | 23 | 1,986,913∣43∣1,986,913 | 43 | 1,986,913∣43∣1,796,349 | 4 | 1,173,000∣0∣1,173,000 | 0 | 1,173,000∣0∣0 | 0 | $0 |
| APPLICATIONS WITHDRAWN | 9 | 1,645,667∣23∣1,645,667 | 23 | 1,645,667∣23∣1,445,696 | 3 | 1,583,333∣3∣1,583,333 | 3 | 1,583,333∣3∣1,600,000 | 1 | $200,000 |
| FILES CLOSED FOR INCOMPLETENESS | 3 | 920,000∣3∣920,000 | 3 | 920,000∣3∣2,156,667 | 1 | 6,000,000∣0∣6,000,000 | 0 | 6,000,000∣0∣0 | 0 | $0 |
| Aggregated Statistics For Year 2005_(Based on 2 full tracts)_ | ||||||||
|---|---|---|---|---|---|---|---|---|
| B) ConventionalHome Purchase Loans | C) Refinancings | D) Home Improvement Loans | F) Non-occupant Loans on < 5 Family Dwellings (A B C & D) | |||||
| Number | Average Value | Number | Average Value | Number | Average Value | Number | Average Value | |
| LOANS ORIGINATED | 93 | 1,762,527∣200∣1,762,527 | 200 | 1,762,527∣200∣1,378,490 | 17 | 1,228,235∣18∣1,228,235 | 18 | 1,228,235∣18∣1,294,944 |
| APPLICATIONS APPROVED, NOT ACCEPTED | 20 | 1,723,550∣30∣1,723,550 | 30 | 1,723,550∣30∣1,042,833 | 0 | 0∣1∣0 | 1 | 0∣1∣580,000 |
| APPLICATIONS DENIED | 29 | 1,786,793∣30∣1,786,793 | 30 | 1,786,793∣30∣1,861,467 | 5 | 1,429,000∣4∣1,429,000 | 4 | 1,429,000∣4∣3,205,750 |
| APPLICATIONS WITHDRAWN | 28 | 2,335,750∣21∣2,335,750 | 21 | 2,335,750∣21∣1,259,476 | 2 | 800,000∣0∣800,000 | 0 | 800,000∣0∣0 |
| FILES CLOSED FOR INCOMPLETENESS | 3 | 1,876,667∣7∣1,876,667 | 7 | 1,876,667∣7∣1,269,429 | 0 | 0∣1∣0 | 1 | 0∣1∣488,000 |
| Aggregated Statistics For Year 2004_(Based on 2 full tracts)_ | ||||||||
|---|---|---|---|---|---|---|---|---|
| B) ConventionalHome Purchase Loans | C) Refinancings | D) Home Improvement Loans | F) Non-occupant Loans on < 5 Family Dwellings (A B C & D) | |||||
| Number | Average Value | Number | Average Value | Number | Average Value | Number | Average Value | |
| LOANS ORIGINATED | 95 | 1,569,421∣373∣1,569,421 | 373 | 1,569,421∣373∣1,241,367 | 14 | 863,214∣14∣863,214 | 14 | 863,214∣14∣1,505,429 |
| APPLICATIONS APPROVED, NOT ACCEPTED | 10 | 1,573,600∣37∣1,573,600 | 37 | 1,573,600∣37∣1,393,189 | 1 | 600,000∣1∣600,000 | 1 | 600,000∣1∣1,940,000 |
| APPLICATIONS DENIED | 11 | 1,454,273∣61∣1,454,273 | 61 | 1,454,273∣61∣1,738,049 | 6 | 1,208,333∣3∣1,208,333 | 3 | 1,208,333∣3∣3,692,667 |
| APPLICATIONS WITHDRAWN | 7 | 1,778,714∣41∣1,778,714 | 41 | 1,778,714∣41∣1,104,976 | 3 | 1,405,333∣0∣1,405,333 | 0 | 1,405,333∣0∣0 |
| FILES CLOSED FOR INCOMPLETENESS | 2 | 4,050,000∣8∣4,050,000 | 8 | 4,050,000∣8∣1,076,500 | 0 | 0∣0∣0 | 0 | 0∣0∣0 |
| Aggregated Statistics For Year 2003_(Based on 2 full tracts)_ | ||||||||
|---|---|---|---|---|---|---|---|---|
| B) ConventionalHome Purchase Loans | C) Refinancings | D) Home Improvement Loans | F) Non-occupant Loans on < 5 Family Dwellings (A B C & D) | |||||
| Number | Average Value | Number | Average Value | Number | Average Value | Number | Average Value | |
| LOANS ORIGINATED | 96 | 1,245,094∣771∣1,245,094 | 771 | 1,245,094∣771∣897,065 | 7 | 537,143∣17∣537,143 | 17 | 537,143∣17∣989,824 |
| APPLICATIONS APPROVED, NOT ACCEPTED | 20 | 1,317,550∣93∣1,317,550 | 93 | 1,317,550∣93∣1,034,828 | 2 | 236,000∣2∣236,000 | 2 | 236,000∣2∣2,112,500 |
| APPLICATIONS DENIED | 8 | 1,120,875∣90∣1,120,875 | 90 | 1,120,875∣90∣1,106,133 | 1 | 2,000,000∣7∣2,000,000 | 7 | 2,000,000∣7∣2,044,000 |
| APPLICATIONS WITHDRAWN | 12 | 1,278,500∣84∣1,278,500 | 84 | 1,278,500∣84∣1,043,036 | 0 | 0∣4∣0 | 4 | 0∣4∣2,106,000 |
| FILES CLOSED FOR INCOMPLETENESS | 2 | 708,000∣14∣708,000 | 14 | 708,000∣14∣2,046,143 | 1 | 200,000∣0∣200,000 | 0 | 200,000∣0∣0 |
| Aggregated Statistics For Year 2002_(Based on 2 full tracts)_ | ||||||||||
|---|---|---|---|---|---|---|---|---|---|---|
| A) FHA, FSA/RHS & VAHome Purchase Loans | B) ConventionalHome Purchase Loans | C) Refinancings | D) Home Improvement Loans | F) Non-occupant Loans on < 5 Family Dwellings (A B C & D) | ||||||
| Number | Average Value | Number | Average Value | Number | Average Value | Number | Average Value | Number | Average Value | |
| LOANS ORIGINATED | 1 | 82,000∣79∣82,000 | 79 | 82,000∣79∣1,189,152 | 723 | 972,591∣4∣972,591 | 4 | 972,591∣4∣1,141,750 | 28 | $888,750 |
| APPLICATIONS APPROVED, NOT ACCEPTED | 0 | 0∣7∣0 | 7 | 0∣7∣1,470,143 | 92 | 1,081,989∣1∣1,081,989 | 1 | 1,081,989∣1∣100,000 | 1 | $1,680,000 |
| APPLICATIONS DENIED | 0 | 0∣4∣0 | 4 | 0∣4∣601,750 | 41 | 1,287,073∣3∣1,287,073 | 3 | 1,287,073∣3∣35,000 | 2 | $895,000 |
| APPLICATIONS WITHDRAWN | 0 | 0∣9∣0 | 9 | 0∣9∣1,134,444 | 48 | 1,102,292∣0∣1,102,292 | 0 | 1,102,292∣0∣0 | 1 | $1,500,000 |
| FILES CLOSED FOR INCOMPLETENESS | 0 | 0∣4∣0 | 4 | 0∣4∣1,130,000 | 17 | 793,941∣0∣793,941 | 0 | 793,941∣0∣0 | 1 | $2,500,000 |
| Aggregated Statistics For Year 2001_(Based on 2 full tracts)_ | ||||||||
|---|---|---|---|---|---|---|---|---|
| B) ConventionalHome Purchase Loans | C) Refinancings | D) Home Improvement Loans | F) Non-occupant Loans on < 5 Family Dwellings (A B C & D) | |||||
| Number | Average Value | Number | Average Value | Number | Average Value | Number | Average Value | |
| LOANS ORIGINATED | 53 | 1,268,491∣402∣1,268,491 | 402 | 1,268,491∣402∣1,059,423 | 14 | 267,857∣16∣267,857 | 16 | 267,857∣16∣2,031,312 |
| APPLICATIONS APPROVED, NOT ACCEPTED | 8 | 1,917,875∣52∣1,917,875 | 52 | 1,917,875∣52∣935,500 | 3 | 96,667∣3∣96,667 | 3 | 96,667∣3∣2,574,667 |
| APPLICATIONS DENIED | 9 | 2,721,444∣45∣2,721,444 | 45 | 2,721,444∣45∣1,146,178 | 5 | 155,000∣4∣155,000 | 4 | 155,000∣4∣1,095,250 |
| APPLICATIONS WITHDRAWN | 10 | 1,363,500∣34∣1,363,500 | 34 | 1,363,500∣34∣1,092,529 | 3 | 198,333∣0∣198,333 | 0 | 198,333∣0∣0 |
| FILES CLOSED FOR INCOMPLETENESS | 1 | 700,000∣11∣700,000 | 11 | 700,000∣11∣1,533,636 | 0 | 0∣2∣0 | 2 | 0∣2∣1,690,000 |
| Aggregated Statistics For Year 2000_(Based on 2 full tracts)_ | ||||||||
|---|---|---|---|---|---|---|---|---|
| B) ConventionalHome Purchase Loans | C) Refinancings | D) Home Improvement Loans | F) Non-occupant Loans on < 5 Family Dwellings (A B C & D) | |||||
| Number | Average Value | Number | Average Value | Number | Average Value | Number | Average Value | |
| LOANS ORIGINATED | 75 | 1,983,947∣115∣1,983,947 | 115 | 1,983,947∣115∣1,361,443 | 21 | 161,190∣11∣161,190 | 11 | 161,190∣11∣3,870,909 |
| APPLICATIONS APPROVED, NOT ACCEPTED | 7 | 506,143∣13∣506,143 | 13 | 506,143∣13∣899,462 | 5 | 241,400∣0∣241,400 | 0 | 241,400∣0∣0 |
| APPLICATIONS DENIED | 15 | 2,052,867∣21∣2,052,867 | 21 | 2,052,867∣21∣1,060,286 | 6 | 370,000∣1∣370,000 | 1 | 370,000∣1∣500,000 |
| APPLICATIONS WITHDRAWN | 9 | 1,902,556∣14∣1,902,556 | 14 | 1,902,556∣14∣676,214 | 5 | 258,400∣1∣258,400 | 1 | 258,400∣1∣650,000 |
| FILES CLOSED FOR INCOMPLETENESS | 4 | 1,273,000∣6∣1,273,000 | 6 | 1,273,000∣6∣1,134,167 | 2 | 500,000∣2∣500,000 | 2 | 500,000∣2∣1,322,500 |
| Aggregated Statistics For Year 1999_(Based on 3 partial tracts)_ | ||||||||
|---|---|---|---|---|---|---|---|---|
| B) ConventionalHome Purchase Loans | C) Refinancings | D) Home Improvement Loans | F) Non-occupant Loans on < 5 Family Dwellings (A B C & D) | |||||
| Number | Average Value | Number | Average Value | Number | Average Value | Number | Average Value | |
| LOANS ORIGINATED | 132 | 1,037,049∣288∣1,037,049 | 288 | 1,037,049∣288∣776,893 | 19 | 132,231∣10∣132,231 | 10 | 132,231∣10∣488,144 |
| APPLICATIONS APPROVED, NOT ACCEPTED | 19 | 1,227,317∣53∣1,227,317 | 53 | 1,227,317∣53∣741,973 | 1 | 114,140∣3∣114,140 | 3 | 114,140∣3∣584,313 |
| APPLICATIONS DENIED | 18 | 1,489,209∣43∣1,489,209 | 43 | 1,489,209∣43∣961,085 | 5 | 117,154∣4∣117,154 | 4 | 117,154∣4∣443,728 |
| APPLICATIONS WITHDRAWN | 20 | 1,273,622∣37∣1,273,622 | 37 | 1,273,622∣37∣1,093,635 | 0 | 0∣1∣0 | 1 | 0∣1∣226,080 |
| FILES CLOSED FOR INCOMPLETENESS | 1 | 1,165,050∣11∣1,165,050 | 11 | 1,165,050∣11∣910,699 | 0 | 0∣1∣0 | 1 | 0∣1∣942,000 |
Detailed HMDA statistics for the following Tracts: 6114.00, 6115.00
| Private Mortgage Insurance Companies Aggregated Statistics For Year 2000_(Based on 1 full tract)_ | ||
|---|---|---|
| A) ConventionalHome Purchase Loans | ||
| Number | Average Value | |
| LOANS ORIGINATED | 1 | $247,000 |
| APPLICATIONS APPROVED, NOT ACCEPTED | 0 | $0 |
| APPLICATIONS DENIED | 0 | $0 |
| APPLICATIONS WITHDRAWN | 0 | $0 |
| FILES CLOSED FOR INCOMPLETENESS | 0 | $0 |
| Aggregated Statistics For Year 1999_(Based on 2 partial tracts)_ | ||
|---|---|---|
| A) ConventionalHome Purchase Loans | ||
| Number | Average Value | |
| LOANS ORIGINATED | 2 | $210,495 |
| APPLICATIONS APPROVED, NOT ACCEPTED | 0 | $0 |
| APPLICATIONS DENIED | 0 | $0 |
| APPLICATIONS WITHDRAWN | 0 | $0 |
| FILES CLOSED FOR INCOMPLETENESS | 0 | $0 |
Detailed PMIC statistics for the following Tracts: 6114.00
2005 - 2018 National Fire Incident Reporting System (NFIRS) incidents
See full National Fire Incident Reporting System statistics for Atherton, CA
| Most common first names in Atherton, CA among deceased individuals | ||
|---|---|---|
| Name | Count | Lived (average) |
| John | 29 | 80.2 years |
| Mary | 22 | 81.8 years |
| Robert | 21 | 78.9 years |
| William | 17 | 81.5 years |
| Margaret | 16 | 85.9 years |
| Charles | 12 | 78.4 years |
| Helen | 12 | 88.6 years |
| Frances | 10 | 83.2 years |
| James | 10 | 83.5 years |
| Virginia | 10 | 85.0 years |
| Most common last names in Atherton, CA among deceased individuals | ||
|---|---|---|
| Last name | Count | Lived (average) |
| Johnson | 7 | 79.3 years |
| Davis | 5 | 89.4 years |
| Miller | 5 | 87.0 years |
| Murphy | 5 | 87.6 years |
| Nelson | 5 | 84.2 years |
| Smith | 5 | 81.0 years |
| Benetti | 4 | 88.7 years |
| Jones | 4 | 83.8 years |
| Allen | 4 | 85.5 years |
| Hughes | 4 | 80.3 years |
Atherton compared to California state average:
- Median household income above state average.
- Median house value significantly above state average.
- Unemployed percentage significantly below state average.
- Black race population percentage significantly below state average.
- Hispanic race population percentage significantly below state average.
- Median age significantly above state average.
- Renting percentage significantly below state average.
- Number of rooms per house significantly above state average.
- Percentage of population with a bachelor's degree or higher significantly above state average.
Atherton on our top lists:
- #1 on the list of "Top 101 cities with the highest cost per building permit(population 5,000+)"
- #2 on the list of "Top 101 cities with largest percentage of males in occupations: management occupations (population 5,000+)"
- #2 on the list of "Top 101 cities with largest percentage of females in occupations: management occupations (population 5,000+)"
- #7 on the list of "Top 101 cities with the smallest house values disparities (population 5,000+)"
- #8 on the list of "Top 100 cities with biggest houses"
- #21 on the list of "Top 101 cities with the most cars per house, population 5,000+"
- #24 on the list of "Top 100 cities with highest median house value"
- #26 on the list of "Top 101 cities with the smallest household incomes disparities (population 5,000+)"
- #29 on the list of "Top 101 cities with the highest percentage of workers working at home, population 5,000+"
- #35 on the list of "Top 101 cities with the largest percentage of one, detached housing units in structures (2,000+ housing units)"
- #36 on the list of "Top 100 cities with highest median household income"
- #40 on the list of "Top 101 cities with largest percentage of males in industries: finance and insurance (population 5,000+)"
- #49 on the list of "Top 100 best educated cities (highest percentage of bachelor degree holding residents)"
- #50 on the list of "Top 101 cities with the most people having Master's or Doctorate degrees (population 5,000+)"
- #94 on the list of "Top 101 cities with the most residents born in Malaysia (population 500+)"
- #98 on the list of "Top 101 cities with the largest percentage of people in religious group quarters (population 1,000+)"
- #100 on the list of "Top 101 cities with the most residents born in Hong Kong (population 500+)"
- #1 (94027) on the list of "Top 101 zip codes with the highest 2012 average Adjusted Gross Income (AGI) for individuals (pop 1,000+)"
- #1 (94027) on the list of "Top 101 zip codes with the highest 2012 average reported profit/loss from business (pop 5,000+)"
- #1 (94027) on the list of "Top 101 zip codes with the highest average reported salary/wage in 2012 (pop 1,000+)"
- #2 (94027) on the list of "Top 101 zip codes with the highest 2012 average net capital gain/loss (pop 5,000+)"
- #2 (94027) on the list of "Top 101 zip codes with the largest percentage of taxpayers reporting net capital gain/loss in 2012 (pop 5,000+)"
- #5 (94027) on the list of "Top 101 zip codes with the largest percentage of taxpayers reporting taxable interest in 2012 (pop 5,000+)"
- #6 (94027) on the list of "Top 101 zip codes with the highest 2012 average taxable interest for individuals (pop 5,000+)"
- #45 (94027) on the list of "Top 101 zip codes with the largest percentage of taxpayers using charity contributions deductions in 2012 (pop 5,000+)"
- #93 (94027) on the list of "Top 101 zip codes with the smallest percentage of returns reporting salary or wage in 2012 (pop 5,000+)"
- #6 on the list of "Top 101 counties with the highest percentage of residents that exercised in the past month"
- #8 on the list of "Top 101 counties with the highest percentage of residents that drank alcohol in the past 30 days"
- #9 on the list of "Top 101 counties with the lowest Ozone (1-hour) air pollution readings in 2012 (ppm)"
- #10 on the list of "Top 101 counties with the highest carbon monoxide air pollution readings in 2012 (ppm)"
- #11 on the list of "Top 101 counties with the lowest average weight of females"
There are 45 pilots and 7 other airmen in this city.

Top Patent Applicants
| Vahid Saadat (75) Benjamin D. Pless (45) Keng Lim (35) Dennis S. Fernandez (30) Thierry Nivaggioli (29) | Reza Kassayan (27) Thomas B. Neff (27) John M. Cioffi (26) Lawrence Horowitz (25) Mojan Goshayeshgar (25) |
|---|
Total of 1611 patent applications in 2008-2024.