population, maps, real estate, averages, homes, statistics, relocation, travel, jobs, hospitals, schools, crime, moving, houses, news, sex offenders (original) (raw)
Bolivar Peninsula, Texas
Submit your own pictures of this place and show them to the world
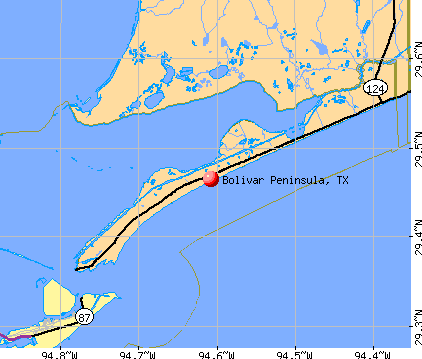
OSM Map
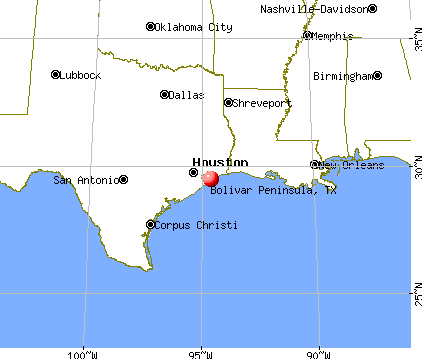
General Map
Google Map
MSN Map
OSM Map
General Map
Google Map
MSN Map
OSM Map
General Map
Google Map
MSN Map
OSM Map
General Map
Google Map
MSN Map
Please wait while loading the map...
Current weather forecast for Bolivar Peninsula, TX
Population in 2010: 2,417.
Population change since 2000: -37.3%
| Median resident age: | 66.1 years |
|---|---|
| Texas median age: | 35.6 years |
Zip codes: 77617, 77623, 77650.
Bolivar Peninsula Zip Code Map
Estimated median household income in 2022: 56,018(∗∗itwas∗∗56,018 (it was 56,018(∗∗itwas∗∗34,235 in 2000)
| Bolivar Peninsula: | $56,018 |
|---|---|
| TX: | $72,284 |
Estimated per capita income in 2022: 35,334(∗∗itwas∗∗35,334 (it was 35,334(∗∗itwas∗∗26,137 in 2000)
Bolivar Peninsula CDP income, earnings, and wages data
Estimated median house or condo value in 2022: 362,747(∗∗itwas∗∗362,747 (it was 362,747(∗∗itwas∗∗52,900 in 2000)
| Bolivar Peninsula: | $362,747 |
|---|---|
| TX: | $275,400 |
Mean prices in 2022: all housing units: 384,042;∗∗detachedhouses:∗∗384,042; detached houses: 384,042;∗∗detachedhouses:∗∗417,617; mobile homes: 128,971;∗∗occupiedboats,rvs,vans,etc.:∗∗128,971; occupied boats, rvs, vans, etc.: 128,971;∗∗occupiedboats,rvs,vans,etc.:∗∗18,659
Median gross rent in 2022: $515.
March 2022 cost of living index in Bolivar Peninsula: 90.4 (less than average, U.S. average is 100)
Bolivar Peninsula, TX residents, houses, and apartments details
Percentage of residents living in poverty in 2022: 12.4%
(15.3% for White Non-Hispanic residents, 0.4% for Hispanic or Latino residents)
Detailed information about poverty and poor residents in Bolivar Peninsula, TX
Business Search - 14 Million verified businesses
- 2,09578.4%White alone
- 28810.8%Hispanic
- 1806.7%Black alone
- 612.3%Two or more races
- 20.07%American Indian alone
Races in Bolivar Peninsula detailed stats: ancestries, foreign born residents, place of birth
Latest news from Bolivar Peninsula, TX collected exclusively by city-data.com from local newspapers, TV, and radio stations
Ancestries: English (13.3%), French (11.0%), German (9.9%), Cajun (6.1%), Polish (4.6%), Irish (4.1%).
Current Local Time: CST time zone
Land area: 45.2 square miles.
Population density: 53 people per square mile (very low).
234 residents are foreign born (5.7% Latin America, 2.8% Europe).
| This place: | 8.8% |
|---|---|
| Texas: | 17.1% |
Median real estate property taxes paid for housing units with mortgages in 2022: $3,288 (0.9%)
Median real estate property taxes paid for housing units with no mortgage in 2022: $3,292 (0.9%)
Nearest city with pop. 50,000+: Galveston, TX (18.3 miles , pop. 57,247).
Nearest city with pop. 200,000+: Houston, TX (51.0 miles , pop. 1,953,631).
Nearest cities:
Latitude: 29.46 N**, Longitude:** 94.61 W
Area code commonly used in this area: 409
Unemployment in December 2023:
Most common industries in Bolivar Peninsula, TX (%)
- Construction (11.9%)
- Educational services (8.2%)
- Accommodation & food services (7.6%)
- Health care (6.3%)
- Professional, scientific, technical services (6.2%)
- Mining, quarrying, oil & gas extraction (3.3%)
- Public administration (3.2%)
Most common occupations in Bolivar Peninsula, TX (%)
- Other production occupations, including supervisors (5.9%)
- Other office and administrative support workers, including supervisors (5.4%)
- Carpenters (4.8%)
- Electrical equipment mechanics and other installation, maintenance, and repair workers, including supervisors (4.7%)
- Driver/sales workers and truck drivers (4.4%)
- Preschool, kindergarten, elementary, and middle school teachers (3.4%)
- Other sales and related occupations, including supervisors (3.4%)
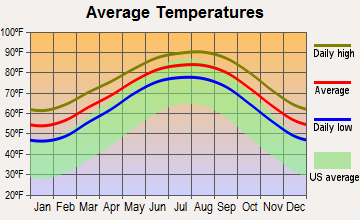
Average climate in Bolivar Peninsula, Texas
Based on data reported by over 4,000 weather stations
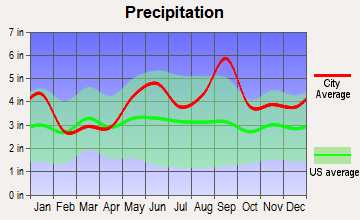
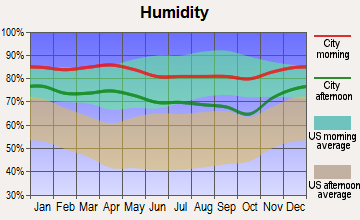
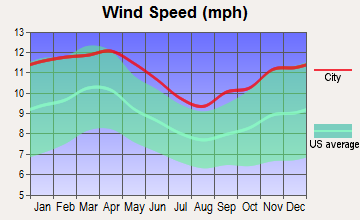
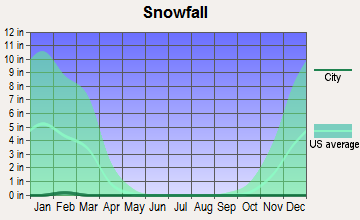
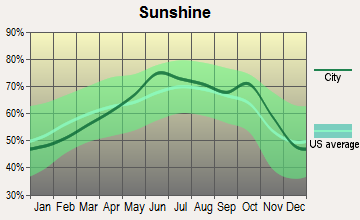
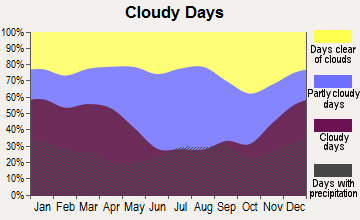
Air pollution and air quality trends (lower is better)
Air Quality Index (AQI) level in 2022 was 68.2**. This is about average.**
Tornado activity:
Bolivar Peninsula-area historical tornado activity is near Texas state average. It is 46% greater than the overall U.S. average.
On 9/12/1961**, a** category F4 (max. wind speeds 207-260 mph) tornado 14.4 miles away from the Bolivar Peninsula place center killed 8 people and injured 200 people.
On 5/21/1959**, a** category F3 (max. wind speeds 158-206 mph) tornado 7.4 miles away from the place center caused between 5000∗∗and∗∗5000 and 5000∗∗and∗∗50,000 in damages.
Earthquake activity:
Bolivar Peninsula-area historical earthquake activity is significantly above Texas state average. It is 44% smaller than the overall U.S. average.
On 5/17/2012 at 08:12:00**, a magnitude** 4.8 (4.8 MW**, Depth:** 3.1 mi**, Class:** Light**, Intensity:** IV - V) earthquake occurred 170.9 miles away from the city center
On 10/20/2011 at 12:24:41**, a magnitude** 4.8 (4.8 MW**, Depth:** 3.1 mi) earthquake occurred 213.7 miles away from Bolivar Peninsula center
On 9/2/2013 at 23:51:15**, a magnitude** 4.3 (4.3 MW**, Depth:** 2.9 mi) earthquake occurred 169.5 miles away from Bolivar Peninsula center
On 9/2/2013 at 21:52:38**, a magnitude** 4.2 (4.2 MW**, Depth:** 3.0 mi) earthquake occurred 173.1 miles away from the city center
On 1/25/2013 at 07:01:19**, a magnitude** 4.1 (4.1 MB**, Depth:** 3.1 mi) earthquake occurred 165.6 miles away from Bolivar Peninsula center
On 4/9/1993 at 12:29:19**, a magnitude** 4.3 (4.1 MB**,** 4.3 LG**, Depth:** 3.1 mi) earthquake occurred 217.2 miles away from Bolivar Peninsula center
Magnitude types: regional Lg-wave magnitude (LG), body-wave magnitude (MB), moment magnitude (MW)
Natural disasters:
The number of natural disasters in Galveston County (23) is greater than the US average (15).
Major Disasters (Presidential) Declared: 14
Emergencies Declared: 7
Causes of natural disasters: Hurricanes: 11**, Storms:** 7**, Floods:** 6**, Fires:** 2**, Tornadoes:** 2**, Tropical Storms:** 2**, Flash Flood:** 1**, Wind:** 1**, Other:** 1 (Note: some incidents may be assigned to more than one category).

Hospitals and medical centers near Bolivar Peninsula:
- UNIV OF TEXAS MEDICAL BRANCH (Dialysis Facility, about 15 miles away; GALVESTON, TX)
- UNIVERSITY OF TEXAS MEDICAL BRANCH GAL Acute Care Hospitals (about 15 miles away; GALVESTON, TX)
- ST MARYS HOSPITAL (Nursing Home, about 15 miles away; GALVESTON, TX)
- HEALTH RELATED SERVICES INC (Home Health Center, about 16 miles away; GALVESTON, TX)
Amtrak station near Bolivar Peninsula:
- 17 miles: GALVESTON (BEACH CENTRAL STA., 21ST AT SEAWALL) - Bus Station
Colleges/universities with over 2000 students nearest to Bolivar Peninsula:
- The University of Texas Medical Branch (about 15 miles; Galveston, TX; Full-time enrollment: 2,314)
- College of the Mainland (about 25 miles; Texas City, TX; FT enrollment: 2,739)
- Lee College (about 29 miles; Baytown, TX; FT enrollment: 4,278)
- University of Houston-Clear Lake (about 31 miles; Houston, TX; FT enrollment: 5,833)
- San Jacinto Community College (about 34 miles; Pasadena, TX; FT enrollment: 13,517)
- Alvin Community College (about 39 miles; Alvin, TX; FT enrollment: 3,953)
- University of Houston (about 48 miles; Houston, TX; FT enrollment: 31,888)
Points of interest:
Click to draw/clear place borders
Notable locations in Bolivar Peninsula: High Island Station (A), Coyle Slip (B), Stingaree Marina (C), Bolivar Yacht Basin Marina (D), Charpiot Marina (E), Flake (F), Point Bolivar Lighthouse (G), High Island Recreational Vehicle Park (H), Port Bolivar Volunteer Fire Department (I), Crystal Beach Volunteer Fire Department and Emergency Medical Services (J), High Island Volunteer Fire Department (K), Gilchrist Volunteer Fire Department (L), The Breakers Building (M). Display/hide their locations on the map
Cemetery: Port Bolivar Cemetery (1). Display/hide its location on the map
Lakes and swamps: Clark Lake (A), Beacon Bayou (B), Clay Bottom Pond (C), Smith Pond (D), Crab Lake (E), Oyster Lake (F), Horseshoe Lake (G), Knoll Ponds (H). Display/hide their locations on the map
Streams, rivers, and creeks: Beacon Bayou (A), Johnson Bayou (B). Display/hide their locations on the map
Beaches: Bolivar Beach (A), Crystal Beach (B). Display/hide their locations on the map
Galveston County has a predicted average indoor radon screening level less than 2 pCi/L (pico curies per liter) - Low Potential
Average household size:
| This place: | 2.2 people |
|---|---|
| Texas: | 2.8 people |
Percentage of family households:
| This place: | 60.9% |
|---|---|
| Whole state: | 69.9% |
Percentage of households with unmarried partners:
| This place: | 7.1% |
|---|---|
| Whole state: | 6.0% |
Likely homosexual households (counted as self-reported same-sex unmarried-partner households)
- Lesbian couples: 0.5% of all households
- Gay men: 0.4% of all households
4 people in other noninstitutional facilities in 2010
For population 15 years and over in Bolivar Peninsula:
- Never married: 5.9%
- Now married: 69.9%
- Separated: 2.3%
- Widowed: 9.0%
- Divorced: 12.9%
For population 25 years and over in Bolivar Peninsula:
- High school or higher: 95.6%
- Bachelor's degree or higher: 14.1%
- Graduate or professional degree: 2.6%
- Unemployed: 5.8%
- Mean travel time to work (commute): 41.8 minutes
Education Gini index (Inequality in education)
| Here: | 7.1 |
|---|---|
| Texas average: | 14.0 |
Graphs represent county-level data. Detailed 2008 Election Results
Religion statistics for Bolivar Peninsula, TX (based on Galveston County data)
| Religion | Adherents | Congregations |
|---|---|---|
| Evangelical Protestant | 61,765 | 195 |
| Catholic | 57,907 | 8 |
| Mainline Protestant | 18,373 | 50 |
| Other | 13,728 | 26 |
| Black Protestant | 5,373 | 17 |
| Orthodox | 559 | 3 |
| None | 133,604 | - |
Source: Clifford Grammich, Kirk Hadaway, Richard Houseal, Dale E.Jones, Alexei Krindatch, Richie Stanley and Richard H.Taylor. 2012. 2010 U.S.Religion Census: Religious Congregations & Membership Study. Association of Statisticians of American Religious Bodies. Jones, Dale E., et al. 2002. Congregations and Membership in the United States 2000. Nashville, TN: Glenmary Research Center. Graphs represent county-level data
Food Environment Statistics:
**Number of grocery stores: 48
| This county: | 1.70 / 10,000 pop. |
|---|---|
| Texas: | 1.47 / 10,000 pop. |
**Number of supercenters and club stores: 5
| Galveston County: | 0.18 / 10,000 pop. |
|---|---|
| State: | 0.14 / 10,000 pop. |
**Number of convenience stores (no gas): 40
| Here: | 1.41 / 10,000 pop. |
|---|---|
| State: | 1.11 / 10,000 pop. |
**Number of convenience stores (with gas): 126
| Galveston County: | 4.45 / 10,000 pop. |
|---|---|
| Texas: | 3.95 / 10,000 pop. |
**Number of full-service restaurants: 195
| Galveston County: | 6.89 / 10,000 pop. |
|---|---|
| Texas: | 6.13 / 10,000 pop. |
**Adult diabetes rate:
| Galveston County: | 10.1% |
|---|---|
| Texas: | 8.9% |
**Adult obesity rate:
| Galveston County: | 28.4% |
|---|---|
| State: | 26.6% |
**Low-income preschool obesity rate:
| Galveston County: | 16.7% |
|---|---|
| Texas: | 15.7% |
Health and Nutrition:
**Average overall health of teeth and gums:
| Bolivar Peninsula: | 42.8% |
|---|---|
| Texas: | 47.4% |
**Average BMI:
| Bolivar Peninsula: | 29.2 |
|---|---|
| Texas: | 28.5 |
**People feeling badly about themselves:
| This city: | 23.9% |
|---|---|
| State: | 20.6% |
**People not drinking alcohol at all:
**Average hours sleeping at night:
**Overweight people:
| Bolivar Peninsula: | 38.1% |
|---|---|
| State: | 33.1% |
**General health condition:
**Average condition of hearing:
| Bolivar Peninsula: | 73.1% |
|---|---|
| State: | 80.7% |
More about Health and Nutrition of Bolivar Peninsula, TX Residents
8.54% of this county's 2021 resident taxpayers lived in other counties in 2020 ($73,500 average adjusted gross income)
| Here: | 8.54% |
|---|---|
| Texas average: | 8.12% |
0.02% of residents moved from foreign countries ($187 average AGI)
Galveston County: 0.02% Texas average: 0.04%
Top counties from which taxpayers relocated into this county between 2020 and 2021:
7.72% of this county's 2020 resident taxpayers moved to other counties in 2021 ($74,429 average adjusted gross income)
| Here: | 7.72% |
|---|---|
| Texas average: | 7.40% |
0.02% of residents moved to foreign countries ($137 average AGI)
Galveston County: 0.02% Texas average: 0.03%
Top counties to which taxpayers relocated from this county between 2020 and 2021:
Strongest AM radio stations in Bolivar Peninsula:
- KTRH (740 AM; 50 kW; HOUSTON, TX; Owner: AMFM TEXAS LICENSES LIMITED PARTNERSHIP)
- KYST (920 AM; 5 kW; TEXAS CITY, TX; Owner: HISPANIC BROADCASTING, INC.)
- KGOL (1180 AM; 50 kW; HUMBLE, TX; Owner: ENTRAVISION HOLDINGS, LLC)
- KILE (1560 AM; 50 kW; BELLAIRE, TX; Owner: THE RAFTT CORPORATION)
- KGBC (1540 AM; 2 kW; GALVESTON, TX; Owner: SIGA BROADCASTING CORP.)
- KLAT (1010 AM; 10 kW; HOUSTON, TX; Owner: TICHENOR LICENSE CORPORATION ("TLC"))
- KWWJ (1360 AM; 5 kW; BAYTOWN, TX; Owner: SALT OF THE EARTH BROADCASTING, INC.)
- KSEV (700 AM; 15 kW; TOMBALL, TX; Owner: LIBERMAN BROADCASTING OF HOUSTON LICENSE CORP.)
- KEYH (850 AM; 10 kW; HOUSTON, TX; Owner: LIBERMAN BROADCASTING OF HOUSTON LICENSE CORP.)
- KXYZ (1320 AM; 5 kW; HOUSTON, TX; Owner: BLAYA INC.)
- KLVI (560 AM; 5 kW; BEAUMONT, TX; Owner: CAPSTAR TX LIMITED PARTNERSHIP)
- KPRC (950 AM; 5 kW; HOUSTON, TX; Owner: CCB TEXAS LICENSES, L.P.)
- KKHT (1070 AM; 10 kW; HOUSTON, TX; Owner: SOUTH TEXAS BROADCASTING, INC.)
Strongest FM radio stations in Bolivar Peninsula:
- KOBT (100.7 FM; WINNIE, TX; Owner: TICHENOR LICENSE CORPORATION ("TLC"))
- KLTO (105.3 FM; CRYSTAL BEACH, TX; Owner: TICHENOR LICENSE CORPORATION ("TLC"))
- KLDE (107.5 FM; LAKE JACKSON, TX; Owner: CXR HOLDINGS, INC.)
- KOVE-FM (106.5 FM; GALVESTON, TX; Owner: HBC LICENSE CORPORATION)
- KQBU-FM (93.3 FM; PORT ARTHUR, TX; Owner: TICHENOR LICENSE CORPORATION ("TLC"))
- KQQK (107.9 FM; BEAUMONT, TX; Owner: LIBERMAN BROADCASTING OF HOUSTON LICENSE CORP.)
- KTJM (98.5 FM; PORT ARTHUR, TX; Owner: LIBERMAN BROADCASTING OF HOUSTON LICENSE CORP.)
- KSTB (101.5 FM; CRYSTAL BEACH, TX; Owner: CUMULUS LICENSING CORP.)
- K247AF (97.3 FM; GALVESTON, TX; Owner: THE KSBJ EDUCATIONAL FOUNDATION)
- KJIC (90.5 FM; SANTA FE, TX; Owner: COMMUNITY RADIO, INC.)
- KRBE (104.1 FM; HOUSTON, TX; Owner: KRBE LICO, INC.)
- KBXX (97.9 FM; HOUSTON, TX; Owner: RADIO ONE LICENSES, LLC)
- KHJZ-FM (95.7 FM; HOUSTON, TX; Owner: TEXAS INFINITY BROADCASTING L.P.)
- KHMX (96.5 FM; HOUSTON, TX; Owner: CITICASTERS LICENSES, L.P.)
- KILT-FM (100.3 FM; HOUSTON, TX; Owner: TEXAS INFINITY BROADCASTING L.P.)
- KKBQ-FM (92.9 FM; PASADENA, TX; Owner: CXR HOLDINGS, INC.)
- KLOL (101.1 FM; HOUSTON, TX; Owner: AMFM TEXAS LICENSES LIMITED PARTNERSHIP)
- KODA (99.1 FM; HOUSTON, TX; Owner: AMFM TEXAS LICENSES LIMITED PARTNERSHIP)
- KTBZ-FM (94.5 FM; HOUSTON, TX; Owner: AMFM TEXAS LICENSES LIMITED PARTNERSHIP)
- K201DZ (88.1 FM; PORT BOLIVAR, TX; Owner: ALELUYA CHRISTIAN BROADCASTING, INC.)
TV broadcast stations around Bolivar Peninsula:
- KJIB-LP (Channel 5; CLEAR LAKE CITY, TX; Owner: FAR EASTERN TELECASTERS)
- KTMD (Channel 48; GALVESTON, TX; Owner: TELEMUNDO OF TEXAS PARTNERSHIP, LP)
- KLTJ (Channel 22; GALVESTON, TX; Owner: WORD OF GOD FELLOWSHIP, INC.)
- KAZH (Channel 57; BAYTOWN, TX; Owner: KAZH LICENSE, LLC)
- KHOU-TV (Channel 11; HOUSTON, TX; Owner: KHOU-TV, L.P.)
- KPRC-TV (Channel 2; HOUSTON, TX; Owner: POST-NEWSWEEK STATIONS, HOUSTON, LP)
- K09VO (Channel 9; BEAUMONT, TX; Owner: BEAUMONT BROADCASTING CORPORATION)
- KRIV (Channel 26; HOUSTON, TX; Owner: FOX TELEVISION STATIONS, INC.)
- KNWS-TV (Channel 51; KATY, TX; Owner: JOHNSON BROADCASTING, INC.)
- KHWB (Channel 39; HOUSTON, TX; Owner: KHWB, INC.)
- KXLN-TV (Channel 45; ROSENBERG, TX; Owner: KXLN LICENSE PARTNERSHIP, L.P.)
- KTRK-TV (Channel 13; HOUSTON, TX; Owner: KTRK TELEVISION, INC.)
- KPXB (Channel 49; CONROE, TX; Owner: PAXSON HOUSTON LICENSE, INC.)
- KTBU (Channel 55; CONROE, TX; Owner: HUMANITY INTERESTED MEDIA, INC.)
- KFTH (Channel 67; ALVIN, TX; Owner: TELEFUTURA HOUSTON LLC)
- KTXH (Channel 20; HOUSTON, TX; Owner: FOX TELEVISION STATIONS, INC.)
- KZJL (Channel 61; HOUSTON, TX; Owner: KZJL LICENSE CORP.)
- KETH (Channel 14; HOUSTON, TX; Owner: COMMUNITY EDUCATIONAL TV, INC.)
- KUHT (Channel 8; HOUSTON, TX; Owner: UNIVERSITY OF HOUSTON SYSTEM)
- KVDO-LP (Channel 69; CLEAR LAKE, TX; Owner: FAR EASTERN TELECASTERS)
- KBPX-LP (Channel 33; HOUSTON, TX; Owner: PAXSON COMMUNICATIONS LPTV, INC.)
Bolivar Peninsula fatal accident statistics for 1975 - 2021
- National Bridge Inventory (NBI) Statistics
- 9Number of bridges
- 509ft / 155mTotal length
- $5,499,000Total costs
- 17,001Total average daily traffic
- 962Total average daily truck traffic
- 19,642Total future (year 2028) average daily traffic
FCC Registered Antenna Towers:
1
- Donna-Marie Stipo, 1685 Tx-87 (Lat: 29.458917 Lon: -94.647139), Type: 30.5, Structure height: 48167 m, Overall height: 25.9 m, Registrant: Tillman Infrastructure, LLC, Dmstipo@tillmaninfrastructure.Com, 27th Floor, New Y-ork, Phone: (212) 706-1677
FCC Registered Microwave Towers:
15 (See the full list of FCC Registered Microwave Towers in this town)
| Home Mortgage Disclosure Act Aggregated Statistics For Year 2009_(Based on 1 partial tract)_ | ||||||||||||
|---|---|---|---|---|---|---|---|---|---|---|---|---|
| A) FHA, FSA/RHS & VAHome Purchase Loans | B) ConventionalHome Purchase Loans | C) Refinancings | D) Home Improvement Loans | F) Non-occupant Loans on < 5 Family Dwellings (A B C & D) | G) Loans On ManufacturedHome Dwelling (A B C & D) | |||||||
| Number | Average Value | Number | Average Value | Number | Average Value | Number | Average Value | Number | Average Value | Number | Average Value | |
| LOANS ORIGINATED | 2 | 159,080∣34∣159,080 | 34 | 159,080∣34∣169,029 | 29 | 157,722∣4∣157,722 | 4 | 157,722∣4∣81,410 | 50 | 169,678∣1∣169,678 | 1 | 169,678∣1∣46,410 |
| APPLICATIONS APPROVED, NOT ACCEPTED | 1 | 101,810∣4∣101,810 | 4 | 101,810∣4∣156,082 | 6 | 189,770∣0∣189,770 | 0 | 189,770∣0∣0 | 7 | 180,627∣0∣180,627 | 0 | 180,627∣0∣0 |
| APPLICATIONS DENIED | 0 | 0∣7∣0 | 7 | 0∣7∣119,027 | 14 | 178,701∣4∣178,701 | 4 | 178,701∣4∣33,688 | 11 | 175,036∣1∣175,036 | 1 | 175,036∣1∣81,600 |
| APPLICATIONS WITHDRAWN | 0 | 0∣3∣0 | 3 | 0∣3∣194,387 | 5 | 182,958∣1∣182,958 | 1 | 182,958∣1∣37,430 | 6 | 180,537∣0∣180,537 | 0 | 180,537∣0∣0 |
| FILES CLOSED FOR INCOMPLETENESS | 0 | 0∣1∣0 | 1 | 0∣1∣126,510 | 1 | 290,460∣1∣290,460 | 1 | 290,460∣1∣20,210 | 1 | 416,970∣0∣416,970 | 0 | 416,970∣0∣0 |
| Aggregated Statistics For Year 2008_(Based on 1 partial tract)_ | ||||||||||||
|---|---|---|---|---|---|---|---|---|---|---|---|---|
| A) FHA, FSA/RHS & VAHome Purchase Loans | B) ConventionalHome Purchase Loans | C) Refinancings | D) Home Improvement Loans | F) Non-occupant Loans on < 5 Family Dwellings (A B C & D) | G) Loans On ManufacturedHome Dwelling (A B C & D) | |||||||
| Number | Average Value | Number | Average Value | Number | Average Value | Number | Average Value | Number | Average Value | Number | Average Value | |
| LOANS ORIGINATED | 1 | 56,150∣82∣56,150 | 82 | 56,150∣82∣144,315 | 41 | 164,765∣10∣164,765 | 10 | 164,765∣10∣61,909 | 91 | 151,900∣0∣151,900 | 0 | 151,900∣0∣0 |
| APPLICATIONS APPROVED, NOT ACCEPTED | 0 | 0∣13∣0 | 13 | 0∣13∣149,490 | 4 | 206,240∣3∣206,240 | 3 | 206,240∣3∣36,680 | 11 | 145,773∣2∣145,773 | 2 | 145,773∣2∣122,395 |
| APPLICATIONS DENIED | 0 | 0∣20∣0 | 20 | 0∣20∣138,229 | 31 | 162,881∣10∣162,881 | 10 | 162,881∣10∣39,975 | 28 | 143,384∣3∣143,384 | 3 | 143,384∣3∣49,407 |
| APPLICATIONS WITHDRAWN | 1 | 68,870∣11∣68,870 | 11 | 68,870∣11∣183,407 | 10 | 149,346∣2∣149,346 | 2 | 149,346∣2∣51,655 | 13 | 179,031∣0∣179,031 | 0 | 179,031∣0∣0 |
| FILES CLOSED FOR INCOMPLETENESS | 0 | 0∣2∣0 | 2 | 0∣2∣73,735 | 1 | 139,240∣1∣139,240 | 1 | 139,240∣1∣56,150 | 2 | 73,735∣0∣73,735 | 0 | 73,735∣0∣0 |
| Aggregated Statistics For Year 2007_(Based on 1 partial tract)_ | ||||||||||||
|---|---|---|---|---|---|---|---|---|---|---|---|---|
| A) FHA, FSA/RHS & VAHome Purchase Loans | B) ConventionalHome Purchase Loans | C) Refinancings | D) Home Improvement Loans | F) Non-occupant Loans on < 5 Family Dwellings (A B C & D) | G) Loans On ManufacturedHome Dwelling (A B C & D) | |||||||
| Number | Average Value | Number | Average Value | Number | Average Value | Number | Average Value | Number | Average Value | Number | Average Value | |
| LOANS ORIGINATED | 1 | 194,640∣201∣194,640 | 201 | 194,640∣201∣131,847 | 68 | 171,165∣15∣171,165 | 15 | 171,165∣15∣66,276 | 175 | 141,267∣1∣141,267 | 1 | 141,267∣1∣127,260 |
| APPLICATIONS APPROVED, NOT ACCEPTED | 1 | 34,440∣26∣34,440 | 26 | 34,440∣26∣144,739 | 16 | 182,939∣2∣182,939 | 2 | 182,939∣2∣59,890 | 25 | 169,004∣1∣169,004 | 1 | 169,004∣1∣34,440 |
| APPLICATIONS DENIED | 0 | 0∣47∣0 | 47 | 0∣47∣126,131 | 48 | 154,820∣10∣154,820 | 10 | 154,820∣10∣61,011 | 46 | 147,474∣0∣147,474 | 0 | 147,474∣0∣0 |
| APPLICATIONS WITHDRAWN | 1 | 152,710∣20∣152,710 | 20 | 152,710∣20∣110,119 | 25 | 159,242∣2∣159,242 | 2 | 159,242∣2∣52,400 | 19 | 130,099∣0∣130,099 | 0 | 130,099∣0∣0 |
| FILES CLOSED FOR INCOMPLETENESS | 0 | 0∣6∣0 | 6 | 0∣6∣171,055 | 4 | 179,102∣1∣179,102 | 1 | 179,102∣1∣7,490 | 4 | 229,820∣0∣229,820 | 0 | 229,820∣0∣0 |
| Aggregated Statistics For Year 2006_(Based on 1 partial tract)_ | ||||||||||||
|---|---|---|---|---|---|---|---|---|---|---|---|---|
| A) FHA, FSA/RHS & VAHome Purchase Loans | B) ConventionalHome Purchase Loans | C) Refinancings | D) Home Improvement Loans | F) Non-occupant Loans on < 5 Family Dwellings (A B C & D) | G) Loans On ManufacturedHome Dwelling (A B C & D) | |||||||
| Number | Average Value | Number | Average Value | Number | Average Value | Number | Average Value | Number | Average Value | Number | Average Value | |
| LOANS ORIGINATED | 1 | 65,130∣246∣65,130 | 246 | 65,130∣246∣117,874 | 77 | 135,924∣12∣135,924 | 12 | 135,924∣12∣49,033 | 228 | 122,718∣0∣122,718 | 0 | 122,718∣0∣0 |
| APPLICATIONS APPROVED, NOT ACCEPTED | 0 | 0∣43∣0 | 43 | 0∣43∣92,827 | 10 | 194,786∣4∣194,786 | 4 | 194,786∣4∣82,345 | 25 | 100,552∣1∣100,552 | 1 | 100,552∣1∣62,880 |
| APPLICATIONS DENIED | 1 | 62,880∣76∣62,880 | 76 | 62,880∣76∣117,077 | 41 | 96,515∣16∣96,515 | 16 | 96,515∣16∣40,799 | 60 | 91,329∣1∣91,329 | 1 | 91,329∣1∣67,370 |
| APPLICATIONS WITHDRAWN | 0 | 0∣19∣0 | 19 | 0∣19∣129,468 | 29 | 106,095∣0∣106,095 | 0 | 106,095∣0∣0 | 10 | 150,169∣0∣150,169 | 0 | 150,169∣0∣0 |
| FILES CLOSED FOR INCOMPLETENESS | 0 | 0∣12∣0 | 12 | 0∣12∣131,567 | 8 | 160,388∣0∣160,388 | 0 | 160,388∣0∣0 | 6 | 90,332∣0∣90,332 | 0 | 90,332∣0∣0 |
| Aggregated Statistics For Year 2005_(Based on 1 partial tract)_ | ||||||||||||||
|---|---|---|---|---|---|---|---|---|---|---|---|---|---|---|
| A) FHA, FSA/RHS & VAHome Purchase Loans | B) ConventionalHome Purchase Loans | C) Refinancings | D) Home Improvement Loans | E) Loans on Dwellings For 5+ Families | F) Non-occupant Loans on < 5 Family Dwellings (A B C & D) | G) Loans On ManufacturedHome Dwelling (A B C & D) | ||||||||
| Number | Average Value | Number | Average Value | Number | Average Value | Number | Average Value | Number | Average Value | Number | Average Value | Number | Average Value | |
| LOANS ORIGINATED | 1 | 116,780∣231∣116,780 | 231 | 116,780∣231∣112,559 | 72 | 118,320∣16∣118,320 | 16 | 118,320∣16∣78,837 | 1 | 47,910∣214∣47,910 | 214 | 47,910∣214∣119,811 | 1 | $25,450 |
| APPLICATIONS APPROVED, NOT ACCEPTED | 0 | 0∣32∣0 | 32 | 0∣32∣120,127 | 10 | 60,262∣2∣60,262 | 2 | 60,262∣2∣28,445 | 0 | 0∣20∣0 | 20 | 0∣20∣110,905 | 1 | $54,650 |
| APPLICATIONS DENIED | 0 | 0∣55∣0 | 55 | 0∣55∣98,911 | 41 | 87,495∣12∣87,495 | 12 | 87,495∣12∣36,308 | 0 | 0∣38∣0 | 38 | 0∣38∣97,338 | 0 | $0 |
| APPLICATIONS WITHDRAWN | 0 | 0∣19∣0 | 19 | 0∣19∣94,166 | 28 | 103,922∣4∣103,922 | 4 | 103,922∣4∣151,592 | 0 | 0∣13∣0 | 13 | 0∣13∣129,220 | 0 | $0 |
| FILES CLOSED FOR INCOMPLETENESS | 0 | 0∣4∣0 | 4 | 0∣4∣74,298 | 16 | 116,267∣1∣116,267 | 1 | 116,267∣1∣56,890 | 0 | 0∣8∣0 | 8 | 0∣8∣84,779 | 0 | $0 |
| Aggregated Statistics For Year 2004_(Based on 1 partial tract)_ | ||||||||
|---|---|---|---|---|---|---|---|---|
| B) ConventionalHome Purchase Loans | C) Refinancings | D) Home Improvement Loans | F) Non-occupant Loans on < 5 Family Dwellings (A B C & D) | |||||
| Number | Average Value | Number | Average Value | Number | Average Value | Number | Average Value | |
| LOANS ORIGINATED | 181 | 92,156∣93∣92,156 | 93 | 92,156∣93∣107,179 | 19 | 44,483∣177∣44,483 | 177 | 44,483∣177∣98,883 |
| APPLICATIONS APPROVED, NOT ACCEPTED | 16 | 88,616∣14∣88,616 | 14 | 88,616∣14∣89,886 | 1 | 49,410∣14∣49,410 | 14 | 49,410∣14∣79,886 |
| APPLICATIONS DENIED | 22 | 79,794∣61∣79,794 | 61 | 79,794∣61∣85,390 | 12 | 33,687∣25∣33,687 | 25 | 33,687∣25∣84,023 |
| APPLICATIONS WITHDRAWN | 10 | 110,269∣28∣110,269 | 28 | 110,269∣28∣101,515 | 1 | 29,940∣15∣29,940 | 15 | 29,940∣15∣122,022 |
| FILES CLOSED FOR INCOMPLETENESS | 4 | 69,995∣19∣69,995 | 19 | 69,995∣19∣85,380 | 0 | 0∣2∣0 | 2 | 0∣2∣121,275 |
| Aggregated Statistics For Year 2003_(Based on 1 partial tract)_ | ||||||||||
|---|---|---|---|---|---|---|---|---|---|---|
| A) FHA, FSA/RHS & VAHome Purchase Loans | B) ConventionalHome Purchase Loans | C) Refinancings | D) Home Improvement Loans | F) Non-occupant Loans on < 5 Family Dwellings (A B C & D) | ||||||
| Number | Average Value | Number | Average Value | Number | Average Value | Number | Average Value | Number | Average Value | |
| LOANS ORIGINATED | 2 | 72,615∣156∣72,615 | 156 | 72,615∣156∣84,198 | 117 | 100,517∣9∣100,517 | 9 | 100,517∣9∣47,494 | 165 | $90,857 |
| APPLICATIONS APPROVED, NOT ACCEPTED | 0 | 0∣10∣0 | 10 | 0∣10∣87,137 | 16 | 91,750∣1∣91,750 | 1 | 91,750∣1∣14,970 | 13 | $109,008 |
| APPLICATIONS DENIED | 0 | 0∣17∣0 | 17 | 0∣17∣67,771 | 59 | 78,882∣6∣78,882 | 6 | 78,882∣6∣21,085 | 20 | $101,772 |
| APPLICATIONS WITHDRAWN | 1 | 62,130∣16∣62,130 | 16 | 62,130∣16∣76,404 | 26 | 85,139∣1∣85,139 | 1 | 85,139∣1∣3,740 | 11 | $83,163 |
| FILES CLOSED FOR INCOMPLETENESS | 1 | 50,160∣4∣50,160 | 4 | 50,160∣4∣117,718 | 6 | 127,637∣0∣127,637 | 0 | 127,637∣0∣0 | 3 | $82,847 |
| Aggregated Statistics For Year 1999_(Based on 1 partial tract)_ | ||||||||||||
|---|---|---|---|---|---|---|---|---|---|---|---|---|
| A) FHA, FSA/RHS & VAHome Purchase Loans | B) ConventionalHome Purchase Loans | C) Refinancings | D) Home Improvement Loans | E) Loans on Dwellings For 5+ Families | F) Non-occupant Loans on < 5 Family Dwellings (A B C & D) | |||||||
| Number | Average Value | Number | Average Value | Number | Average Value | Number | Average Value | Number | Average Value | Number | Average Value | |
| LOANS ORIGINATED | 3 | 63,203∣99∣63,203 | 99 | 63,203∣99∣73,891 | 33 | 69,658∣15∣69,658 | 15 | 69,658∣15∣16,809 | 1 | 68,010∣68∣68,010 | 68 | 68,010∣68∣70,569 |
| APPLICATIONS APPROVED, NOT ACCEPTED | 1 | 52,900∣8∣52,900 | 8 | 52,900∣8∣44,741 | 6 | 88,280∣1∣88,280 | 1 | 88,280∣1∣55,650 | 0 | 0∣5∣0 | 5 | 0∣5∣64,166 |
| APPLICATIONS DENIED | 0 | 0∣13∣0 | 13 | 0∣13∣41,008 | 12 | 63,605∣3∣63,605 | 3 | 63,605∣3∣15,800 | 0 | 0∣10∣0 | 10 | 0∣10∣56,540 |
| APPLICATIONS WITHDRAWN | 0 | 0∣7∣0 | 7 | 0∣7∣69,093 | 5 | 68,562∣0∣68,562 | 0 | 68,562∣0∣0 | 0 | 0∣3∣0 | 3 | 0∣3∣106,027 |
| FILES CLOSED FOR INCOMPLETENESS | 0 | 0∣5∣0 | 5 | 0∣5∣47,266 | 5 | 84,088∣1∣84,088 | 1 | 84,088∣1∣12,370 | 0 | 0∣3∣0 | 3 | 0∣3∣56,793 |
Detailed HMDA statistics for the following Tracts: 7239.00
| Private Mortgage Insurance Companies Aggregated Statistics For Year 2009_(Based on 1 partial tract)_ | ||||||
|---|---|---|---|---|---|---|
| A) ConventionalHome Purchase Loans | B) Refinancings | C) Non-occupant Loans on < 5 Family Dwellings (A & B) | ||||
| Number | Average Value | Number | Average Value | Number | Average Value | |
| LOANS ORIGINATED | 1 | 59,140∣1∣59,140 | 1 | 59,140∣1∣118,280 | 1 | $177,420 |
| APPLICATIONS APPROVED, NOT ACCEPTED | 1 | 134,000∣0∣134,000 | 0 | 134,000∣0∣0 | 0 | $0 |
| APPLICATIONS DENIED | 1 | 145,230∣0∣145,230 | 0 | 145,230∣0∣0 | 1 | $145,230 |
| APPLICATIONS WITHDRAWN | 0 | 0∣1∣0 | 1 | 0∣1∣181,160 | 0 | $0 |
| FILES CLOSED FOR INCOMPLETENESS | 1 | 51,650∣0∣51,650 | 0 | 51,650∣0∣0 | 1 | $51,650 |
| Aggregated Statistics For Year 2008_(Based on 1 partial tract)_ | ||||||
|---|---|---|---|---|---|---|
| A) ConventionalHome Purchase Loans | B) Refinancings | C) Non-occupant Loans on < 5 Family Dwellings (A & B) | ||||
| Number | Average Value | Number | Average Value | Number | Average Value | |
| LOANS ORIGINATED | 22 | 178,677∣4∣178,677 | 4 | 178,677∣4∣161,698 | 22 | $172,314 |
| APPLICATIONS APPROVED, NOT ACCEPTED | 6 | 179,165∣1∣179,165 | 1 | 179,165∣1∣276,230 | 4 | $180,038 |
| APPLICATIONS DENIED | 3 | 152,217∣0∣152,217 | 0 | 152,217∣0∣0 | 3 | $152,217 |
| APPLICATIONS WITHDRAWN | 3 | 252,527∣0∣252,527 | 0 | 252,527∣0∣0 | 2 | $225,330 |
| FILES CLOSED FOR INCOMPLETENESS | 1 | 98,820∣0∣98,820 | 0 | 98,820∣0∣0 | 0 | $0 |
| Aggregated Statistics For Year 2007_(Based on 1 partial tract)_ | ||||||
|---|---|---|---|---|---|---|
| A) ConventionalHome Purchase Loans | B) Refinancings | C) Non-occupant Loans on < 5 Family Dwellings (A & B) | ||||
| Number | Average Value | Number | Average Value | Number | Average Value | |
| LOANS ORIGINATED | 50 | 140,617∣3∣140,617 | 3 | 140,617∣3∣164,693 | 37 | $143,913 |
| APPLICATIONS APPROVED, NOT ACCEPTED | 6 | 121,772∣1∣121,772 | 1 | 121,772∣1∣444,670 | 4 | $126,700 |
| APPLICATIONS DENIED | 2 | 136,620∣0∣136,620 | 0 | 136,620∣0∣0 | 1 | $160,200 |
| APPLICATIONS WITHDRAWN | 0 | 0∣0∣0 | 0 | 0∣0∣0 | 0 | $0 |
| FILES CLOSED FOR INCOMPLETENESS | 0 | 0∣0∣0 | 0 | 0∣0∣0 | 0 | $0 |
| Aggregated Statistics For Year 2006_(Based on 1 partial tract)_ | ||||||
|---|---|---|---|---|---|---|
| A) ConventionalHome Purchase Loans | B) Refinancings | C) Non-occupant Loans on < 5 Family Dwellings (A & B) | ||||
| Number | Average Value | Number | Average Value | Number | Average Value | |
| LOANS ORIGINATED | 30 | 132,028∣2∣132,028 | 2 | 132,028∣2∣175,545 | 26 | $128,183 |
| APPLICATIONS APPROVED, NOT ACCEPTED | 4 | 158,515∣1∣158,515 | 1 | 158,515∣1∣54,650 | 3 | $193,637 |
| APPLICATIONS DENIED | 0 | 0∣0∣0 | 0 | 0∣0∣0 | 0 | $0 |
| APPLICATIONS WITHDRAWN | 2 | 139,240∣0∣139,240 | 0 | 139,240∣0∣0 | 1 | $148,220 |
| FILES CLOSED FOR INCOMPLETENESS | 0 | 0∣0∣0 | 0 | 0∣0∣0 | 0 | $0 |
| Aggregated Statistics For Year 2005_(Based on 1 partial tract)_ | ||||||
|---|---|---|---|---|---|---|
| A) ConventionalHome Purchase Loans | B) Refinancings | C) Non-occupant Loans on < 5 Family Dwellings (A & B) | ||||
| Number | Average Value | Number | Average Value | Number | Average Value | |
| LOANS ORIGINATED | 47 | 109,455∣3∣109,455 | 3 | 109,455∣3∣160,700 | 38 | $115,481 |
| APPLICATIONS APPROVED, NOT ACCEPTED | 6 | 130,507∣0∣130,507 | 0 | 130,507∣0∣0 | 5 | $149,420 |
| APPLICATIONS DENIED | 1 | 126,510∣0∣126,510 | 0 | 126,510∣0∣0 | 1 | $126,510 |
| APPLICATIONS WITHDRAWN | 0 | 0∣0∣0 | 0 | 0∣0∣0 | 0 | $0 |
| FILES CLOSED FOR INCOMPLETENESS | 1 | 258,270∣0∣258,270 | 0 | 258,270∣0∣0 | 0 | $0 |
| Aggregated Statistics For Year 2004_(Based on 1 partial tract)_ | ||||||
|---|---|---|---|---|---|---|
| A) ConventionalHome Purchase Loans | B) Refinancings | C) Non-occupant Loans on < 5 Family Dwellings (A & B) | ||||
| Number | Average Value | Number | Average Value | Number | Average Value | |
| LOANS ORIGINATED | 32 | 86,393∣3∣86,393 | 3 | 86,393∣3∣65,127 | 24 | $87,087 |
| APPLICATIONS APPROVED, NOT ACCEPTED | 7 | 80,849∣1∣80,849 | 1 | 80,849∣1∣199,880 | 6 | $99,813 |
| APPLICATIONS DENIED | 0 | 0∣0∣0 | 0 | 0∣0∣0 | 0 | $0 |
| APPLICATIONS WITHDRAWN | 4 | 152,340∣0∣152,340 | 0 | 152,340∣0∣0 | 4 | $152,340 |
| FILES CLOSED FOR INCOMPLETENESS | 0 | 0∣0∣0 | 0 | 0∣0∣0 | 0 | $0 |
| Aggregated Statistics For Year 2003_(Based on 1 partial tract)_ | ||||||
|---|---|---|---|---|---|---|
| A) ConventionalHome Purchase Loans | B) Refinancings | C) Non-occupant Loans on < 5 Family Dwellings (A & B) | ||||
| Number | Average Value | Number | Average Value | Number | Average Value | |
| LOANS ORIGINATED | 38 | 91,723∣7∣91,723 | 7 | 91,723∣7∣127,049 | 29 | $98,893 |
| APPLICATIONS APPROVED, NOT ACCEPTED | 16 | 65,877∣6∣65,877 | 6 | 65,877∣6∣87,835 | 10 | $88,185 |
| APPLICATIONS DENIED | 1 | 65,130∣0∣65,130 | 0 | 65,130∣0∣0 | 0 | $0 |
| APPLICATIONS WITHDRAWN | 1 | 197,630∣0∣197,630 | 0 | 197,630∣0∣0 | 1 | $112,290 |
| FILES CLOSED FOR INCOMPLETENESS | 0 | 0∣0∣0 | 0 | 0∣0∣0 | 0 | $0 |
| Aggregated Statistics For Year 1999_(Based on 1 partial tract)_ | ||||||
|---|---|---|---|---|---|---|
| A) ConventionalHome Purchase Loans | B) Refinancings | C) Non-occupant Loans on < 5 Family Dwellings (A & B) | ||||
| Number | Average Value | Number | Average Value | Number | Average Value | |
| LOANS ORIGINATED | 8 | 59,941∣0∣59,941 | 0 | 59,941∣0∣0 | 5 | $54,274 |
| APPLICATIONS APPROVED, NOT ACCEPTED | 1 | 55,650∣1∣55,650 | 1 | 55,650∣1∣43,280 | 1 | $43,280 |
| APPLICATIONS DENIED | 0 | 0∣0∣0 | 0 | 0∣0∣0 | 0 | $0 |
| APPLICATIONS WITHDRAWN | 0 | 0∣0∣0 | 0 | 0∣0∣0 | 0 | $0 |
| FILES CLOSED FOR INCOMPLETENESS | 0 | 0∣0∣0 | 0 | 0∣0∣0 | 0 | $0 |
Detailed PMIC statistics for the following Tracts: 7239.00
Bolivar Peninsula compared to Texas state average:
- Unemployed percentage below state average.
- Black race population percentage below state average.
- Hispanic race population percentage significantly below state average.
- Median age significantly above state average.
- Foreign-born population percentage significantly below state average.
- Renting percentage below state average.
- Length of stay since moving in above state average.
- Number of rooms per house below state average.
- House age below state average.
- Number of college students significantly below state average.
- Percentage of population with a bachelor's degree or higher below state average.
Bolivar Peninsula on our top lists:
- #15 on the list of "Top 101 cities with the most residents born in Cambodia (population 500+)"
- #14 on the list of "Top 101 counties with the largest decrease in the number of infant deaths per 1000 residents 2000-2006 to 2007-2013 (pop. 50,000+)"
- #30 on the list of "Top 101 counties with the lowest number of infant deaths per 1000 residents 2007-2013 (pop. 50,000+)"
- #35 on the list of "Top 101 counties with the lowest Nitrogen Dioxide air pollution readings in 2012 (ppm)"
- #48 on the list of "Top 101 counties with the lowest surface withdrawal of fresh water for public supply"
- #72 on the list of "Top 101 counties with the largest decrease in the number of deaths per 1000 residents 2000-2006 to 2007-2013 (pop. 50,000+)"
