East St. Louis, Illinois (IL 62205) profile: population, maps, real estate, averages, homes, statistics, relocation, travel, jobs, hospitals, schools, crime, moving, houses, news, sex offenders (original) (raw)
Submit your own pictures of this city and show them to the world
OSM Map
General Map
Google Map
MSN Map
OSM Map
General Map
Google Map
MSN Map
OSM Map
General Map
Google Map
MSN Map
OSM Map
General Map
Google Map
MSN Map
Please wait while loading the map...
Current weather forecast for East St. Louis, IL
Population in 2022: 17,919 (100% urban, 0% rural).
Population change since 2000: -43.2%
| Median resident age: | 43.8 years |
|---|---|
| Illinois median age: | 39.1 years |
Zip codes: 62205.
Estimated median household income in 2022: 27,890(∗∗itwas∗∗27,890 (it was 27,890(∗∗itwas∗∗21,324 in 2000)
| East St. Louis: | $27,890 |
|---|---|
| IL: | $76,708 |
Estimated per capita income in 2022: 20,653(∗∗itwas∗∗20,653 (it was 20,653(∗∗itwas∗∗11,169 in 2000)
East St. Louis city income, earnings, and wages data
Estimated median house or condo value in 2022: 59,133(∗∗itwas∗∗59,133 (it was 59,133(∗∗itwas∗∗41,600 in 2000)
| East St. Louis: | $59,133 |
|---|---|
| IL: | $251,600 |
Mean prices in 2022: all housing units: 186,345;∗∗detachedhouses:∗∗186,345; detached houses: 186,345;∗∗detachedhouses:∗∗193,799; townhouses or other attached units: 211,600;∗∗in2−unitstructures:∗∗211,600; in 2-unit structures: 211,600;∗∗in2−unitstructures:∗∗145,942; in 3-to-4-unit structures: 159,029;∗∗in5−or−more−unitstructures:∗∗159,029; in 5-or-more-unit structures: 159,029;∗∗in5−or−more−unitstructures:∗∗252,106; mobile homes: $52,353
Median gross rent in 2022: $577.
March 2022 cost of living index in East St. Louis: 93.3 (less than average, U.S. average is 100)
East St. Louis, IL residents, houses, and apartments details
Percentage of residents living in poverty in 2022: 31.6%
(23.0% for White Non-Hispanic residents, 31.7% for Black residents, 79.1% for Hispanic or Latino residents, 20.4% for two or more races residents)
Detailed information about poverty and poor residents in East St. Louis, IL
Business Search - 14 Million verified businesses
- 16,84391.1%Black alone
- 3932.1%Two or more races
- 3321.8%White alone
- 2421.3%Hispanic
- 1871.0%Asian alone
- 1831.0%Other race alone
- 10.01%American Indian alone
Races in East St. Louis detailed stats: ancestries, foreign born residents, place of birth
Crime rates in East St. Louis by year
| Type | 2009 | 2010 | 2011 | 2012 | 2013 | 2014 | 2015 | 2016 | 2017 | 2018 | 2019 | 2020 |
|---|---|---|---|---|---|---|---|---|---|---|---|---|
| Murders(per 100,000) | 25(87.8) | 21(77.8) | 25(92.3) | 17(62.9) | 25(93.9) | 27(101.8) | 19(71.4) | 27(100.9) | 30(111.4) | 23(86.4) | 36(137.0) | 1(3.9) |
| Rapes(per 100,000) | 0(0.0) | 79(292.5) | 52(192.0) | 60(221.9) | 71(266.8) | 62(233.8) | 42(157.8) | 35(130.7) | 43(159.7) | 22(82.6) | 27(102.8) | 2(7.7) |
| Robberies(per 100,000) | 321(1,127) | 281(1,041) | 272(1,004) | 198(732.2) | 249(935.5) | 186(701.3) | 146(548.5) | 103(384.8) | 97(360.2) | 51(191.5) | 32(121.8) | 1(3.9) |
| Assaults(per 100,000) | 1,613(5,664) | 1,376(5,095) | 1,278(4,718) | 1,075(3,976) | 964(3,622) | 692(2,609) | 682(2,562) | 592(2,212) | 571(2,121) | 221(829.9) | 173(658.4) | 15(57.8) |
| Burglaries(per 100,000) | 1,026(3,603) | 1,135(4,203) | 990(3,655) | 869(3,214) | 741(2,784) | 314(1,184) | 234(879.2) | 210(784.5) | 173(642.5) | 198(743.5) | 169(643.1) | 12(46.2) |
| Thefts(per 100,000) | 661(2,321) | 786(2,910) | 766(2,828) | 569(2,104) | 570(2,142) | 564(2,126) | 388(1,458) | 266(993.7) | 273(1,014) | 222(833.6) | 139(529.0) | 17(65.5) |
| Auto thefts(per 100,000) | 462(1,622) | 649(2,403) | 420(1,551) | 389(1,439) | 332(1,247) | 217(818.2) | 182(683.8) | 128(478.2) | 144(534.8) | 100(375.5) | 107(407.2) | 14(53.9) |
| Arson(per 100,000) | 60(210.7) | 59(218.5) | 35(129.2) | 37(136.8) | 15(56.4) | 18(67.9) | 12(45.1) | 9(33.6) | 14(52.0) | 24(90.1) | 7(26.6) | 0(0.0) |
| City-Data.com crime index | 2121.3 | 2323.6 | 2076.1 | 1742.3 | 1786.6 | 1356.2 | 1120.6 | 997.0 | 1011.1 | 577.7 | 623.2 | 36.8 |
The City-Data.com crime index weighs serious crimes and violent crimes more heavily. Higher means more crime, U.S. average is 246.1. It adjusts for the number of visitors and daily workers commuting into cities.
Click on a table row to update graph
Full-time law enforcement employees in 2021, including police officers: 36 (35 officers - 30 male; 5 female).
| Officers per 1,000 residents here: | 1.36 |
|---|---|
| Illinois average: | 2.84 |
Latest news from East St. Louis, IL collected exclusively by city-data.com from local newspapers, TV, and radio stations
East St. Louis, IL City Guides:
Ancestries: African (1.3%), American (1.1%).
Current Local Time: CST time zone
Incorporated on 04/18/1878
Elevation: 405 feet
Land area: 14.1 square miles.
Population density: 1,274 people per square mile (low).
229 residents are foreign born
| This city: | 1.2% |
|---|---|
| Illinois: | 14.1% |
Median real estate property taxes paid for housing units with mortgages in 2022: $1,080 (1.9%)
Median real estate property taxes paid for housing units with no mortgage in 2022: $1,181 (2.0%)
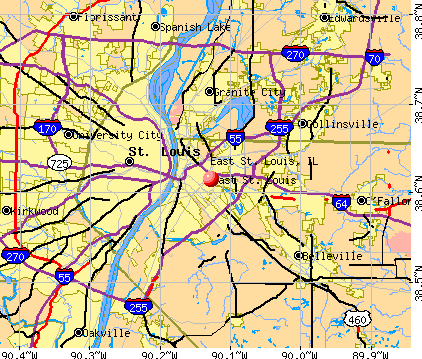
Nearest city with pop. 50,000+: St. Louis, MO (6.3 miles , pop. 348,189).
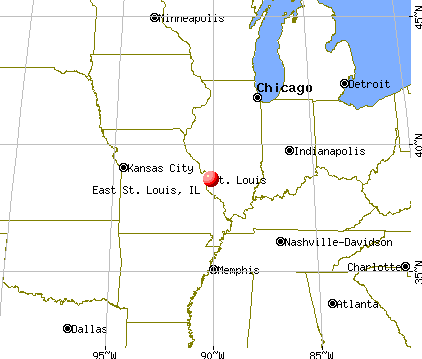
Nearest city with pop. 1,000,000+: Chicago, IL (257.8 miles , pop. 2,896,016).
Nearest cities:
Latitude: 38.62 N**, Longitude:** 90.13 W
Daytime population change due to commuting: +271 (+1.5%)
Workers who live and work in this city: 1,663 (25.1%)
East St. Louis, Illinois accommodation & food services, waste management - Economy and Business Data
Single-family new house construction building permits:
- 2015: 3 buildings , average cost: $195,600
- 2014: 5 buildings , average cost: $195,600
- 2013: 5 buildings , average cost: $195,600
- 2012: 5 buildings , average cost: $195,600
- 2011: 3 buildings , average cost: $195,600
- 2010: 8 buildings , average cost: $195,600
- 2009: 1 building , cost: $78,400
- 2008: 3 buildings , average cost: $78,400
- 2007: 6 buildings , average cost: $78,400
- 2006: 10 buildings , average cost: $78,300
- 2005: 15 buildings , average cost: $78,500
- 2004: 17 buildings , average cost: $77,900
- 2003: 16 buildings , average cost: $80,100
- 2002: 8 buildings , average cost: $61,400
- 2001: 9 buildings , average cost: $91,900
- 2000: 27 buildings , average cost: $88,800
- 1998: 4 buildings , average cost: $75,000
- 1997: 5 buildings , average cost: $75,000
Unemployment in December 2023:
Most common industries in East St. Louis, IL (%)
- Health care (13.5%)
- Educational services (11.1%)
- Accommodation & food services (10.0%)
- Social assistance (6.5%)
- Administrative & support & waste management services (5.5%)
- Public administration (5.4%)
- Arts, entertainment, recreation (3.5%)
Most common occupations in East St. Louis, IL (%)
- Building and grounds cleaning and maintenance occupations (8.5%)
- Other office and administrative support workers, including supervisors (4.5%)
- Cooks and food preparation workers (4.0%)
- Nursing, psychiatric, and home health aides (3.9%)
- Preschool, kindergarten, elementary, and middle school teachers (3.8%)
- Laborers and material movers, hand (3.6%)
- Cashiers (3.2%)
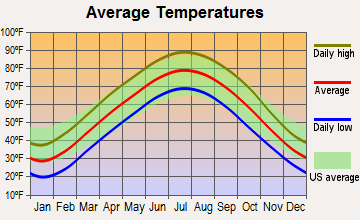
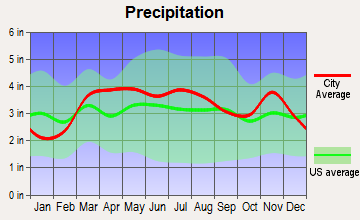
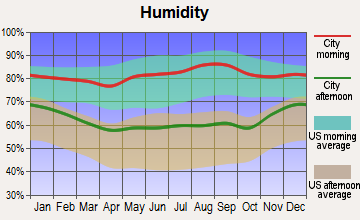
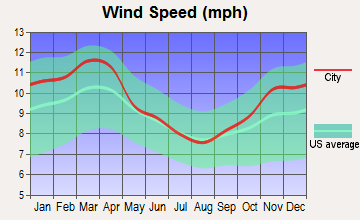
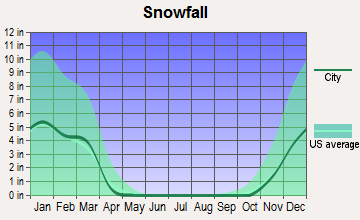
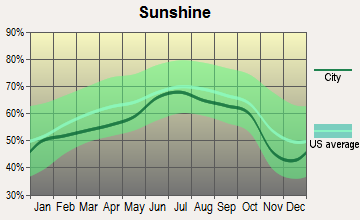
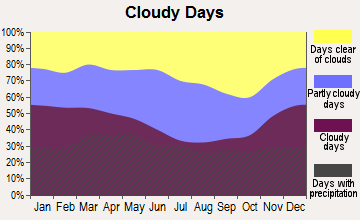
Average climate in East St. Louis, Illinois
Based on data reported by over 4,000 weather stations
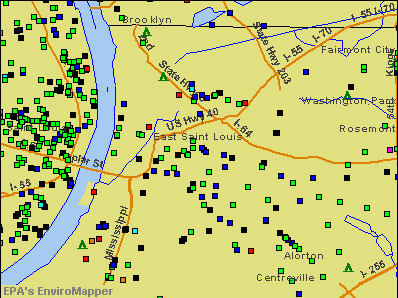
Air pollution and air quality trends (lower is better)
AQI CO NO2 SO2 Ozone PM10 PM2.5 Pb
Air Quality Index (AQI) level in 2023 was 99.6**. This is worse than average.**
Tornado activity:
East St. Louis-area historical tornado activity is slightly above Illinois state average. It is 87% greater than the overall U.S. average.
On 2/10/1959**, a** category F4 (max. wind speeds 207-260 mph) tornado 4.0 miles away from the East St. Louis city center killed 21 people and injured 345 people and caused between 5,000,000∗∗and∗∗5,000,000 and 5,000,000∗∗and∗∗50,000,000 in damages.
On 4/3/1981**, a** category F4 tornado 7.2 miles away from the city center injured 32 people and caused between 5,000,000∗∗and∗∗5,000,000 and 5,000,000∗∗and∗∗50,000,000 in damages.
Earthquake activity:
East St. Louis-area historical earthquake activity is significantly above Illinois state average. It is 309% greater than the overall U.S. average.
On 4/18/2008 at 09:36:59**, a magnitude** 5.4 (5.1 MB**,** 4.8 MS**,** 5.4 MW**,** 5.2 MW**, Class:** Moderate**, Intensity:** VI - VII) earthquake occurred 121.8 miles away from the city center
On 4/18/2008 at 09:36:59**, a magnitude** 5.2 (5.2 MW**, Depth:** 8.9 mi) earthquake occurred 121.8 miles away from the city center
On 6/10/1987 at 23:48:54**, a magnitude** 5.1 (4.9 MB**,** 4.4 MS**,** 4.6 MS**,** 5.1 LG) earthquake occurred 121.9 miles away from the city center
On 9/26/1990 at 13🔞51**, a magnitude** 5.0 (4.7 MB**,** 4.8 LG**,** 5.0 LG**, Depth:** 7.7 mi) earthquake occurred 105.3 miles away from East St. Louis center
On 6/18/2002 at 17:37:15**, a magnitude** 5.0 (4.3 MB**,** 4.6 MW**,** 5.0 LG) earthquake occurred 134.6 miles away from East St. Louis center
On 5/4/1991 at 01🔞54**, a magnitude** 5.0 (4.4 MB**,** 4.6 LG**,** 5.0 LG**, Depth:** 3.1 mi) earthquake occurred 142.9 miles away from East St. Louis center
Magnitude types: regional Lg-wave magnitude (LG), body-wave magnitude (MB), surface-wave magnitude (MS), moment magnitude (MW)
Natural disasters:
The number of natural disasters in St. Clair County (2) is a lot smaller than the US average (15).
Causes of natural disasters: Flood: 1**, Storm:** 1**, Other:** 1 (Note: some incidents may be assigned to more than one category).
Hospitals and medical centers near East St. Louis:
- GATEWAY COMMUNITY HOSPITAL (Hospital, about 1 miles away; EAST ST LOUIS, IL)
- NATHAN HEALTH CARE CENTER (Nursing Home, about 2 miles away; EAST SAINT LOUIS, IL)
- KENNETH HALL REGIONAL HOSPITAL (Hospital, about 2 miles away; EAST SAINT LOUIS, IL)
- TOUCHETTE REGIONAL HOSPITAL INC Acute Care Hospitals (about 4 miles away; CENTREVILLE, IL)
- ST LOUIS CITY HOSP (Hospital, about 5 miles away; SAINT LOUIS, MO)
- MALCOLM BLISS MENTAL HEALTH CTR (Hospital, about 5 miles away; SAINT LOUIS, MO)
- CAHOKIA NURSING AND REHAB CENTER (Nursing Home, about 5 miles away; CAHOKIA, IL)
Amtrak stations near East St. Louis:
- 5 miles: ST. LOUIS (550 S. 16TH ST.) . Services: ticket office, partially wheelchair accessible, enclosed waiting area, public restrooms, public payphones, vending machines, free short-term parking, free long-term parking, call for car rental service, taxi stand.
- 16 miles: KIRKWOOD (110 W. ARGONNE RD.) . Services: ticket office, partially wheelchair accessible, enclosed waiting area, public restrooms, public payphones, free short-term parking, free long-term parking, taxi stand, intercity bus service, public transit connection.
- 20 miles: ALTON (3400 COLLEGE AVE.) . Services: ticket office, fully wheelchair accessible, public payphones, vending machines, free short-term parking, free long-term parking, call for taxi service.
Colleges/universities with over 2000 students nearest to East St. Louis:
- Saint Louis Community College (about 4 miles; Saint Louis, MO; Full-time enrollment: 18,019)
- Saint Louis University (about 6 miles; Saint Louis, MO; FT enrollment: 11,606)
- Ranken Technical College (about 8 miles; Saint Louis, MO; FT enrollment: 2,134)
- Washington University in St Louis (about 11 miles; Saint Louis, MO; FT enrollment: 10,823)
- University of Missouri-St Louis (about 12 miles; Saint Louis, MO; FT enrollment: 10,322)
- Webster University (about 12 miles; Saint Louis, MO; FT enrollment: 12,406)
- Southwestern Illinois College (about 13 miles; Belleville, IL; FT enrollment: 9,085)
See full list of schools located in East St. Louis
User-submitted facts and corrections:
- Holy Angel Catholic church doesn't exist in East St Louis anymore. The only Catholic Church is now St Augustine of Hippo formerly know as St Joseph's located 12th and Columbia Place. All of the Catholic Churches that was in East St. Louis has been consolidated in to one. (St Augustine of Hippo. Also St Mary's Hospital is now Kenneth Hall Regional name for it's long time State Senator Kenneth Hall
- Harris-Stowe State University is within 12 miles of East Saint Louis, and currently boasts a student population of greater than 2000 students, is nationally accredited, and is a historically black academic institution. added by Penny Penny
- St. Marys hospital is now Kenneth Hall Regional Hospital
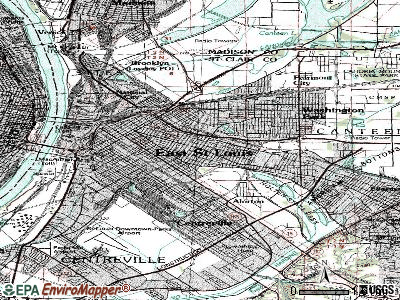
Points of interest:
Click to draw/clear city borders
Notable locations in East St. Louis: Valley Junction (A), East Saint Louis Public Library (B), Fire Station Number 3 (C), Lessie Bates Davis Neighborhood House (D), East Saint Louis Fire Department Company 422 (E), East Saint Louis Fire Department Company 426 (F), East Saint Louis Fire Department Company 424 (G), Hazel Bland Promise Center (H), East Saint Louis Fire Department Company 425 (I), City of East Saint Louis Engine House Number 4 (J), City of East Saint Louis Engine House Number 2 (K). Display/hide their locations on the map
Churches in East St. Louis include: Agudas Achim Congregation (A), Bethel Methodist Church (B), Bethel Temple (C), Bray Temple Christian Methodist Episcopal Church (D), Brown Community African Methodist Episcopal Zion Church (E), Calvary Pentecostal Church (F), Christian and Missionary Alliance Church (G), Church of God (H), Church of God in Christ (I). Display/hide their locations on the map
Parks in East St. Louis include: Lincoln Park (1), Jones Park (2), Jefferson National Expansion Memorial (3). Display/hide their locations on the map
Birthplace of: Dick Durbin - Lawyer**,** Houston Alexander - Martial artist**,** Hank Bauer - Major League Baseball player**,** Boone Guyton - Naval aviator**,** James L. Day - Marine Corps Medal of Honor recipient**,** Ken Kwapis - Film director**,** Frank Wortman - Organized crime figure in St. Louis**,** Harry Edwards (sociologist) - Sociologist of sport**,** Charles Melvin Price - Politician**,** Homer Bush - Baseball player.
St. Clair County has a predicted average indoor radon screening level between 2 and 4 pCi/L (pico curies per liter) - Moderate Potential
Average household size:
| This city: | 2.6 people |
|---|---|
| Illinois: | 2.6 people |
Percentage of family households:
| This city: | 62.9% |
|---|---|
| Whole state: | 65.8% |
Percentage of households with unmarried partners:
| This city: | 6.6% |
|---|---|
| Whole state: | 6.3% |
Likely homosexual households (counted as self-reported same-sex unmarried-partner households)
- Lesbian couples: 0.2% of all households
- Gay men: 0.2% of all households
People in group quarters in East St. Louis in 2010:
- 178 people in other noninstitutional facilities
- 127 people in emergency and transitional shelters (with sleeping facilities) for people experiencing homelessness
- 90 people in nursing facilities/skilled-nursing facilities
- 19 people in correctional residential facilities
- 11 people in group homes intended for adults
- 8 people in residential treatment centers for adults
People in group quarters in East St. Louis in 2000:
- 119 people in nursing homes
- 46 people in other noninstitutional group quarters
- 40 people in mental (psychiatric) hospitals or wards
- 38 people in homes for the mentally retarded
- 23 people in hospitals or wards for drug/alcohol abuse
- 6 people in homes for the mentally ill
Banks with branches in East St. Louis (2011 data):
- Associated Bank, National Association: East St. Louis Branch at 326 Missouri Avenue**, branch established on** 1894/01/01**. Info updated** 2008/09/12: Bank assets: 21,715.0mil∗∗,Deposits:∗∗21,715.0 mil**, Deposits:** 21,715.0mil∗∗,Deposits:∗∗15,244.4 mil**, headquarters in** Green Bay, WI**, positive income**, Commercial Lending Specialization**,** 282 total offices , Holding Company: Associated Banc-Corp
- Regions Bank: Edgemont Facility at 8740 State Street**, branch established on** 1959/06/15**. Info updated** 2011/02/24: Bank assets: 123,368.2mil∗∗,Deposits:∗∗123,368.2 mil**, Deposits:** 123,368.2mil∗∗,Deposits:∗∗98,301.3 mil**, headquarters in** Birmingham, AL**, positive income**, Commercial Lending Specialization**,** 1778 total offices , Holding Company: Regions Financial Corporation
- First Illinois Bank: at 327-333 Missouri Avenue**, branch established on** 1934/05/09**. Info updated** 2006/11/03: Bank assets: 49.9mil∗∗,Deposits:∗∗49.9 mil**, Deposits:** 49.9mil∗∗,Deposits:∗∗44.2 mil**, local headquarters** , positive income, Mortgage Lending Specialization**,** 1 total offices , Holding Company: First Illinois Bancorp, Inc.
For population 15 years and over in East St. Louis:
- Never married: 56.5%
- Now married: 17.4%
- Separated: 3.1%
- Widowed: 10.1%
- Divorced: 12.9%
For population 25 years and over in East St. Louis:
- High school or higher: 82.4%
- Bachelor's degree or higher: 12.4%
- Graduate or professional degree: 4.9%
- Unemployed: 17.0%
- Mean travel time to work (commute): 18.9 minutes
Education Gini index (Inequality in education)
| Here: | 11.2 |
|---|---|
| Illinois average: | 12.5 |
Graphs represent county-level data. Detailed 2008 Election Results
Political contributions by individuals in East St. Louis, IL
Religion statistics for East St. Louis, IL (based on St. Clair County data)
| Religion | Adherents | Congregations |
|---|---|---|
| Evangelical Protestant | 46,903 | 169 |
| Catholic | 46,372 | 28 |
| Mainline Protestant | 24,655 | 53 |
| Black Protestant | 10,290 | 41 |
| Other | 5,880 | 16 |
| Orthodox | 2,100 | 2 |
| None | 133,856 | - |
Source: Clifford Grammich, Kirk Hadaway, Richard Houseal, Dale E.Jones, Alexei Krindatch, Richie Stanley and Richard H.Taylor. 2012. 2010 U.S.Religion Census: Religious Congregations & Membership Study. Association of Statisticians of American Religious Bodies. Jones, Dale E., et al. 2002. Congregations and Membership in the United States 2000. Nashville, TN: Glenmary Research Center. Graphs represent county-level data
Food Environment Statistics:
**Number of grocery stores: 47
| St. Clair County: | 1.80 / 10,000 pop. |
|---|---|
| State: | 2.24 / 10,000 pop. |
**Number of supercenters and club stores: 1
| St. Clair County: | 0.04 / 10,000 pop. |
|---|---|
| Illinois: | 0.08 / 10,000 pop. |
**Number of convenience stores (no gas): 17
| Here: | 0.65 / 10,000 pop. |
|---|---|
| State: | 0.75 / 10,000 pop. |
**Number of convenience stores (with gas): 93
| This county: | 3.56 / 10,000 pop. |
|---|---|
| Illinois: | 2.61 / 10,000 pop. |
**Number of full-service restaurants: 155
| This county: | 5.93 / 10,000 pop. |
|---|---|
| State: | 6.86 / 10,000 pop. |
**Adult obesity rate:
| St. Clair County: | 28.4% |
|---|---|
| Illinois: | 25.2% |
**Low-income preschool obesity rate:
| This county: | 8.2% |
|---|---|
| Illinois: | 14.5% |
Health and Nutrition:
**Healthy diet rate:
| This city: | 47.5% |
|---|---|
| Illinois: | 49.5% |
**Average overall health of teeth and gums:
| East St. Louis: | 44.4% |
|---|---|
| Illinois: | 47.2% |
**Average BMI:
| East St. Louis: | 30.4 |
|---|---|
| Illinois: | 28.6 |
**People feeling badly about themselves:
| East St. Louis: | 17.7% |
|---|---|
| State: | 20.5% |
**People not drinking alcohol at all:
| East St. Louis: | 14.9% |
|---|---|
| State: | 10.8% |
**Average hours sleeping at night:
| East St. Louis: | 6.6 |
|---|---|
| Illinois: | 6.8 |
**Overweight people:
| East St. Louis: | 37.0% |
|---|---|
| State: | 33.4% |
**General health condition:
**Average condition of hearing:
| East St. Louis: | 83.6% |
|---|---|
| Illinois: | 79.9% |
More about Health and Nutrition of East St. Louis, IL Residents
East St. Louis government finances - Expenditure in 2021 (per resident):
- Current Operations - Police Protection: 8,778,000(8,778,000 (8,778,000(489.87)
General - Other: 8,576,000(8,576,000 (8,576,000(478.60)
Local Fire Protection: 8,309,000(8,309,000 (8,309,000(463.70)
Regular Highways: 5,159,000(5,159,000 (5,159,000(287.91)
Financial Administration: 4,655,000(4,655,000 (4,655,000(259.78)
Housing and Community Development: 2,339,000(2,339,000 (2,339,000(130.53)
Central Staff Services: 1,331,000(1,331,000 (1,331,000(74.28)
Libraries: 757,000(757,000 (757,000(42.25)
Parks and Recreation: 475,000(475,000 (475,000(26.51)
Sewerage: 443,000(443,000 (443,000(24.72)
Protective Inspection and Regulation - Other: 241,000(241,000 (241,000(13.45) - General - Interest on Debt: 246,000(246,000 (246,000(13.73)
- Total Salaries and Wages: 10,260,000(10,260,000 (10,260,000(572.58)
East St. Louis government finances - Revenue in 2021 (per resident):
- Charges - Sewerage: 304,000(304,000 (304,000(16.97)
- Federal Intergovernmental - Housing and Community Development: 7,629,000(7,629,000 (7,629,000(425.75)
- Miscellaneous - Interest Earnings: 516,000(516,000 (516,000(28.80)
General Revenue - Other: 166,000(166,000 (166,000(9.26)
- State Intergovernmental - General Local Government Support: 21,992,000(21,992,000 (21,992,000(1227.30)
Highways: 1,247,000(1,247,000 (1,247,000(69.59)
- Tax - Property: 10,674,000(10,674,000 (10,674,000(595.68)
Public Utilities Sales: 2,465,000(2,465,000 (2,465,000(137.56)
Other License: 1,246,000(1,246,000 (1,246,000(69.54)
General Sales and Gross Receipts: 1,180,000(1,180,000 (1,180,000(65.85)
Other Selective Sales: 37,000(37,000 (37,000(2.06)
East St. Louis government finances - Debt in 2021 (per resident):
- Long Term Debt - Beginning Outstanding - Unspecified Public Purpose: 4,435,000(4,435,000 (4,435,000(247.50)
Retired Unspecified Public Purpose: 2,965,000(2,965,000 (2,965,000(165.47)
Outstanding Unspecified Public Purpose: 1,470,000(1,470,000 (1,470,000(82.04)
East St. Louis government finances - Cash and Securities in 2021 (per resident):
- Other Funds - Cash and Securities: 26,337,000(26,337,000 (26,337,000(1469.78)
6.01% of this county's 2021 resident taxpayers lived in other counties in 2020 ($54,121 average adjusted gross income)
| Here: | 6.01% |
|---|---|
| Illinois average: | 5.09% |
0.18% of residents moved from foreign countries ($2,103 average AGI)
St. Clair County: 0.18% Illinois average: 0.01%
Top counties from which taxpayers relocated into this county between 2020 and 2021:
6.69% of this county's 2020 resident taxpayers moved to other counties in 2021 ($61,323 average adjusted gross income)
| Here: | 6.69% |
|---|---|
| Illinois average: | 6.10% |
0.10% of residents moved to foreign countries ($1,075 average AGI)
St. Clair County: 0.10% Illinois average: 0.01%
Top counties to which taxpayers relocated from this county between 2020 and 2021:
| Businesses in East St. Louis, IL | |||
|---|---|---|---|
| Name | Count | Name | Count |
| Cricket Wireless | 1 | McDonald's | 1 |
| Foot Locker | 1 | U.S. Cellular | 1 |
Strongest AM radio stations in East St. Louis:
- KTRS (550 AM; 5 kW; ST. LOUIS, MO; Owner: KTRS-AM LICENSE, L.L.C.)
- KMOX (1120 AM; 50 kW; ST. LOUIS, MO; Owner: INFINITY BROADCASTING OPERATIONS, INC.)
- KJSL (630 AM; 5 kW; ST. LOUIS, MO; Owner: WMUZ RADIO, INC.)
- KATZ (1600 AM; 5 kW; ST. LOUIS, MO; Owner: CITICASTERS LICENSES, L.P.)
- KXEN (1010 AM; 50 kW; FESTUS-ST. LOUIS, MO; Owner: BDJ RADIO ENTERPRISES, LLC)
- KSTL (690 AM; 1 kW; ST. LOUIS, MO; Owner: WMUZ RADIO, INC.)
- WESL (1490 AM; 1 kW; EAST ST. LOUIS, IL; Owner: M&R ENTERPRISES, INC)
- WEW (770 AM; daytime; 1 kW; ST. LOUIS, MO; Owner: METROPOLITAN RADIO GROUP, INC.)
- KRFT (1190 AM; 10 kW; DE SOTO, MO; Owner: ALL SPORTS RADIO, LLC)
- WRTH (1430 AM; 5 kW; ST. LOUIS, MO)
- WSDZ (1260 AM; 20 kW; BELLEVILLE, IL)
- KFUO (850 AM; 5 kW; CLAYTON, MO; Owner: LUTHERAN CHURCH-MISSOURI SYNOD)
- KSLG (1380 AM; 5 kW; ST. LOUIS, MO; Owner: NEW HORIZON 7TH-DAY CHRISTIAN CHURCH, INC.)
Strongest FM radio stations in East St. Louis:
- KSIV-FM (91.5 FM; ST. LOUIS, MO; Owner: COMMUNITY BROADCASTING, INC.)
- KFTK-FM1 (97.1 FM; ST. LOUIS, MO; Owner: EMMIS RADIO LICENSE CORPORATION)
- KSHE (94.7 FM; CRESTWOOD, MO; Owner: EMMIS RADIO LICENSE CORPORATION)
- KSLZ (107.7 FM; ST. LOUIS, MO; Owner: CITICASTERS LICENSES, L.P.)
- KFUO-FM (99.1 FM; CLAYTON, MO; Owner: THE LUTHERAN CHURCH-MISSOURI SYNOD)
- KYKY (98.1 FM; ST. LOUIS, MO; Owner: INFINITY RADIO SUBSIDIARY OPERATIONS INC.)
- WSSM (106.5 FM; GRANITE CITY, IL; Owner: BONNEVILLE HOLDING COMPANY)
- KEZK-FM (102.5 FM; ST. LOUIS, MO; Owner: INFINITY RADIO SUBSIDIARY OPERATIONS INC.)
- KIHT (96.3 FM; ST. LOUIS, MO; Owner: EMMIS RADIO LICENSE CORPORATION)
- KMJM-FM (104.9 FM; COLUMBIA, IL; Owner: CITICASTERS LICENSES, L.P.)
- KWMU (90.7 FM; ST. LOUIS, MO; Owner: THE CURATORS OF THE UNIVERSITY OF MISSOURI)
- KSD (93.7 FM; ST. LOUIS, MO; Owner: CITICASTERS LICENSES, L.P.)
- KLOU (103.3 FM; ST. LOUIS, MO; Owner: CITICASTERS LICENSES, L.P.)
- WSIE (88.7 FM; EDWARDSVILLE, IL; Owner: BOARD OF TRUSTEES, S. ILLINOIS UNIV.)
- WCBW-FM (89.7 FM; EAST ST. LOUIS, IL; Owner: NEW LIFE EVANGELISTIC CENTER, INC.)
- WVRV (101.1 FM; EAST ST. LOUIS, IL; Owner: BONNEVILLE HOLDING COMPANY)
- WIL-FM (92.3 FM; ST. LOUIS, MO; Owner: BONNEVILLE HOLDING COMPANY)
- KDHX (88.1 FM; ST. LOUIS, MO; Owner: DOUBLE HELIX CORPORATION)
- KPNT (105.7 FM; ST. GENEVIEVE, MO; Owner: EMMIS RADIO LICENSE CORPORATION)
- WMLL (104.1 FM; JERSEYVILLE, IL; Owner: EMMIS RADIO LICENSE CORPORATION)
TV broadcast stations around East St. Louis:
- K40FF (Channel 40; ST. LOUIS, MO; Owner: EBC ST. LOUIS, INC.)
- K64DT (Channel 64; ST. LOUIS, MO; Owner: WORD OF GOD FELLOWSHIP, INC.)
- KSDK (Channel 5; ST. LOUIS, MO; Owner: MULTIMEDIA KSDK, INC.)
- KPLR-TV (Channel 11; ST. LOUIS, MO; Owner: KPLR, INC.)
- K49FC (Channel 49; ST. LOUIS, MO; Owner: THREE ANGELS BROADCASTING NETWORK)
- KMOV (Channel 4; ST. LOUIS, MO; Owner: KMOV-TV, INC.)
- KDNL-TV (Channel 30; ST. LOUIS, MO; Owner: KDNL LICENSEE, LLC)
- KTVI (Channel 2; ST. LOUIS, MO; Owner: KTVI LICENSE, INC.)
- KPTN-LP (Channel 58; ST. LOUIS, MO; Owner: KURT J. PETERSEN)
- KETC (Channel 9; ST. LOUIS, MO; Owner: ST. LOUIS REGIONAL & EDUCATIONAL PUBLIC TV COMMISSION)
- K38HD (Channel 38; ST. LOUIS, MO; Owner: VENTANA TELEVISION, INC.)
- K18BT (Channel 18; ST. LOUIS, MO; Owner: TRINITY BROADCASTING NETWORK)
- K65FN (Channel 65; BATESVILLE, AR; Owner: MS COMMUNICATIONS, LLC)
- WRBU (Channel 46; EAST ST. LOUIS, IL; Owner: ROBERTS BROADCASTING COMPANY)
- KNLC (Channel 24; ST. LOUIS, MO; Owner: NEW LIFE EVANGELISTIC CENTER, INC.)
- WPXS (Channel 13; MT. VERNON, IL; Owner: EBC ST. LOUIS, INC.)
- K62EG (Channel 62; ST. LOUIS, MO; Owner: ETERNAL FAMILY NETWORK)
- K63FW (Channel 63; JAMESTOWN, MO; Owner: ROGER E. HARDERS)
- K59GP (Channel 59; ST. CHARLES, MO; Owner: TRINITY BROADCASTING NETWORK)
- National Bridge Inventory (NBI) Statistics
- 182Number of bridges
- 6,342ft / 1,933mTotal length
- $671,536,000Total costs
- 3,946,450Total average daily traffic
- 478,774Total average daily truck traffic
- New bridges - historical statistics
- 3Before 1900
- 51900-1909
- 11910-1919
- 91930-1939
- 21940-1949
- 61950-1959
- 711960-1969
- 201970-1979
- 91980-1989
- 91990-1999
- 32000-2009
- 442010-2019
See full National Bridge Inventory statistics for East St. Louis, IL
| Home Mortgage Disclosure Act Aggregated Statistics For Year 2009_(Based on 8 full and 4 partial tracts)_ | ||||||||||||||
|---|---|---|---|---|---|---|---|---|---|---|---|---|---|---|
| A) FHA, FSA/RHS & VAHome Purchase Loans | B) ConventionalHome Purchase Loans | C) Refinancings | D) Home Improvement Loans | E) Loans on Dwellings For 5+ Families | F) Non-occupant Loans on < 5 Family Dwellings (A B C & D) | G) Loans On ManufacturedHome Dwelling (A B C & D) | ||||||||
| Number | Average Value | Number | Average Value | Number | Average Value | Number | Average Value | Number | Average Value | Number | Average Value | Number | Average Value | |
| LOANS ORIGINATED | 6 | 51,165∣9∣51,165 | 9 | 51,165∣9∣49,212 | 41 | 59,885∣5∣59,885 | 5 | 59,885∣5∣28,540 | 0 | 0∣11∣0 | 11 | 0∣11∣39,648 | 0 | $0 |
| APPLICATIONS APPROVED, NOT ACCEPTED | 1 | 38,260∣2∣38,260 | 2 | 38,260∣2∣27,410 | 12 | 51,777∣3∣51,777 | 3 | 51,777∣3∣26,207 | 0 | 0∣3∣0 | 3 | 0∣3∣28,813 | 0 | $0 |
| APPLICATIONS DENIED | 8 | 71,049∣11∣71,049 | 11 | 71,049∣11∣40,225 | 130 | 50,532∣44∣50,532 | 44 | 50,532∣44∣20,984 | 1 | 51,000∣17∣51,000 | 17 | 51,000∣17∣35,339 | 3 | $48,337 |
| APPLICATIONS WITHDRAWN | 5 | 141,916∣1∣141,916 | 1 | 141,916∣1∣67,420 | 40 | 75,345∣5∣75,345 | 5 | 75,345∣5∣47,812 | 0 | 0∣4∣0 | 4 | 0∣4∣42,130 | 1 | $116,360 |
| FILES CLOSED FOR INCOMPLETENESS | 0 | 0∣0∣0 | 0 | 0∣0∣0 | 9 | 47,909∣3∣47,909 | 3 | 47,909∣3∣30,840 | 0 | 0∣1∣0 | 1 | 0∣1∣50,000 | 0 | $0 |
| Aggregated Statistics For Year 2008_(Based on 8 full and 4 partial tracts)_ | ||||||||||||||
|---|---|---|---|---|---|---|---|---|---|---|---|---|---|---|
| A) FHA, FSA/RHS & VAHome Purchase Loans | B) ConventionalHome Purchase Loans | C) Refinancings | D) Home Improvement Loans | E) Loans on Dwellings For 5+ Families | F) Non-occupant Loans on < 5 Family Dwellings (A B C & D) | G) Loans On ManufacturedHome Dwelling (A B C & D) | ||||||||
| Number | Average Value | Number | Average Value | Number | Average Value | Number | Average Value | Number | Average Value | Number | Average Value | Number | Average Value | |
| LOANS ORIGINATED | 19 | 59,482∣20∣59,482 | 20 | 59,482∣20∣65,239 | 71 | 56,405∣35∣56,405 | 35 | 56,405∣35∣21,037 | 2 | 213,085∣28∣213,085 | 28 | 213,085∣28∣49,261 | 1 | $34,890 |
| APPLICATIONS APPROVED, NOT ACCEPTED | 4 | 57,310∣7∣57,310 | 7 | 57,310∣7∣84,064 | 31 | 55,885∣7∣55,885 | 7 | 55,885∣7∣22,033 | 0 | 0∣4∣0 | 4 | 0∣4∣46,152 | 0 | $0 |
| APPLICATIONS DENIED | 12 | 73,350∣40∣73,350 | 40 | 73,350∣40∣43,616 | 231 | 57,271∣118∣57,271 | 118 | 57,271∣118∣36,664 | 1 | 19,720∣46∣19,720 | 46 | 19,720∣46∣44,768 | 1 | $84,020 |
| APPLICATIONS WITHDRAWN | 5 | 86,282∣4∣86,282 | 4 | 86,282∣4∣38,675 | 72 | 62,669∣4∣62,669 | 4 | 62,669∣4∣41,665 | 0 | 0∣8∣0 | 8 | 0∣8∣42,289 | 0 | $0 |
| FILES CLOSED FOR INCOMPLETENESS | 3 | 80,207∣5∣80,207 | 5 | 80,207∣5∣56,598 | 9 | 54,519∣1∣54,519 | 1 | 54,519∣1∣44,250 | 0 | 0∣2∣0 | 2 | 0∣2∣75,085 | 0 | $0 |
| Aggregated Statistics For Year 2007_(Based on 8 full and 4 partial tracts)_ | ||||||||||||||
|---|---|---|---|---|---|---|---|---|---|---|---|---|---|---|
| A) FHA, FSA/RHS & VAHome Purchase Loans | B) ConventionalHome Purchase Loans | C) Refinancings | D) Home Improvement Loans | E) Loans on Dwellings For 5+ Families | F) Non-occupant Loans on < 5 Family Dwellings (A B C & D) | G) Loans On ManufacturedHome Dwelling (A B C & D) | ||||||||
| Number | Average Value | Number | Average Value | Number | Average Value | Number | Average Value | Number | Average Value | Number | Average Value | Number | Average Value | |
| LOANS ORIGINATED | 14 | 69,854∣81∣69,854 | 81 | 69,854∣81∣60,673 | 177 | 57,711∣55∣57,711 | 55 | 57,711∣55∣36,414 | 1 | 140,010∣58∣140,010 | 58 | 140,010∣58∣52,414 | 0 | $0 |
| APPLICATIONS APPROVED, NOT ACCEPTED | 3 | 73,667∣23∣73,667 | 23 | 73,667∣23∣58,931 | 71 | 51,057∣23∣51,057 | 23 | 51,057∣23∣33,167 | 0 | 0∣13∣0 | 13 | 0∣13∣49,805 | 3 | $43,870 |
| APPLICATIONS DENIED | 8 | 66,104∣80∣66,104 | 80 | 66,104∣80∣57,973 | 347 | 60,568∣173∣60,568 | 173 | 60,568∣173∣35,499 | 1 | 340,540∣70∣340,540 | 70 | 340,540∣70∣47,371 | 5 | $60,756 |
| APPLICATIONS WITHDRAWN | 1 | 68,120∣29∣68,120 | 29 | 68,120∣29∣63,000 | 125 | 65,478∣26∣65,478 | 26 | 65,478∣26∣56,454 | 0 | 0∣17∣0 | 17 | 0∣17∣45,356 | 0 | $0 |
| FILES CLOSED FOR INCOMPLETENESS | 0 | 0∣12∣0 | 12 | 0∣12∣66,627 | 39 | 58,962∣4∣58,962 | 4 | 58,962∣4∣27,460 | 0 | 0∣7∣0 | 7 | 0∣7∣44,424 | 0 | $0 |
| Aggregated Statistics For Year 2006_(Based on 8 full and 4 partial tracts)_ | ||||||||||||||
|---|---|---|---|---|---|---|---|---|---|---|---|---|---|---|
| A) FHA, FSA/RHS & VAHome Purchase Loans | B) ConventionalHome Purchase Loans | C) Refinancings | D) Home Improvement Loans | E) Loans on Dwellings For 5+ Families | F) Non-occupant Loans on < 5 Family Dwellings (A B C & D) | G) Loans On ManufacturedHome Dwelling (A B C & D) | ||||||||
| Number | Average Value | Number | Average Value | Number | Average Value | Number | Average Value | Number | Average Value | Number | Average Value | Number | Average Value | |
| LOANS ORIGINATED | 8 | 71,281∣136∣71,281 | 136 | 71,281∣136∣62,397 | 225 | 60,054∣73∣60,054 | 73 | 60,054∣73∣27,822 | 1 | 68,000∣83∣68,000 | 83 | 68,000∣83∣60,263 | 1 | $35,010 |
| APPLICATIONS APPROVED, NOT ACCEPTED | 2 | 60,315∣61∣60,315 | 61 | 60,315∣61∣54,838 | 75 | 54,152∣17∣54,152 | 17 | 54,152∣17∣32,895 | 0 | 0∣25∣0 | 25 | 0∣25∣40,544 | 7 | $60,177 |
| APPLICATIONS DENIED | 1 | 58,000∣147∣58,000 | 147 | 58,000∣147∣58,500 | 387 | 58,963∣176∣58,963 | 176 | 58,963∣176∣31,306 | 0 | 0∣81∣0 | 81 | 0∣81∣54,180 | 8 | $51,795 |
| APPLICATIONS WITHDRAWN | 2 | 71,070∣37∣71,070 | 37 | 71,070∣37∣61,686 | 146 | 64,965∣9∣64,965 | 9 | 64,965∣9∣60,253 | 0 | 0∣19∣0 | 19 | 0∣19∣56,952 | 1 | $57,080 |
| FILES CLOSED FOR INCOMPLETENESS | 0 | 0∣18∣0 | 18 | 0∣18∣80,621 | 57 | 72,201∣4∣72,201 | 4 | 72,201∣4∣32,788 | 0 | 0∣8∣0 | 8 | 0∣8∣61,252 | 0 | $0 |
| Aggregated Statistics For Year 2005_(Based on 8 full and 4 partial tracts)_ | ||||||||||||||
|---|---|---|---|---|---|---|---|---|---|---|---|---|---|---|
| A) FHA, FSA/RHS & VAHome Purchase Loans | B) ConventionalHome Purchase Loans | C) Refinancings | D) Home Improvement Loans | E) Loans on Dwellings For 5+ Families | F) Non-occupant Loans on < 5 Family Dwellings (A B C & D) | G) Loans On ManufacturedHome Dwelling (A B C & D) | ||||||||
| Number | Average Value | Number | Average Value | Number | Average Value | Number | Average Value | Number | Average Value | Number | Average Value | Number | Average Value | |
| LOANS ORIGINATED | 5 | 59,722∣123∣59,722 | 123 | 59,722∣123∣54,373 | 209 | 53,140∣64∣53,140 | 64 | 53,140∣64∣35,989 | 0 | 0∣83∣0 | 83 | 0∣83∣45,407 | 0 | $0 |
| APPLICATIONS APPROVED, NOT ACCEPTED | 1 | 63,110∣50∣63,110 | 50 | 63,110∣50∣48,494 | 94 | 52,346∣29∣52,346 | 29 | 52,346∣29∣26,683 | 1 | 56,000∣21∣56,000 | 21 | 56,000∣21∣44,690 | 3 | $61,293 |
| APPLICATIONS DENIED | 2 | 65,640∣116∣65,640 | 116 | 65,640∣116∣56,403 | 458 | 57,646∣146∣57,646 | 146 | 57,646∣146∣28,148 | 1 | 83,820∣81∣83,820 | 81 | 83,820∣81∣46,903 | 14 | $70,868 |
| APPLICATIONS WITHDRAWN | 3 | 63,377∣89∣63,377 | 89 | 63,377∣89∣65,575 | 175 | 70,918∣42∣70,918 | 42 | 70,918∣42∣92,569 | 0 | 0∣31∣0 | 31 | 0∣31∣64,759 | 0 | $0 |
| FILES CLOSED FOR INCOMPLETENESS | 1 | 65,000∣11∣65,000 | 11 | 65,000∣11∣61,376 | 21 | 63,383∣3∣63,383 | 3 | 63,383∣3∣36,870 | 0 | 0∣3∣0 | 3 | 0∣3∣50,040 | 0 | $0 |
| Aggregated Statistics For Year 2004_(Based on 8 full and 4 partial tracts)_ | ||||||||||||||
|---|---|---|---|---|---|---|---|---|---|---|---|---|---|---|
| A) FHA, FSA/RHS & VAHome Purchase Loans | B) ConventionalHome Purchase Loans | C) Refinancings | D) Home Improvement Loans | E) Loans on Dwellings For 5+ Families | F) Non-occupant Loans on < 5 Family Dwellings (A B C & D) | G) Loans On ManufacturedHome Dwelling (A B C & D) | ||||||||
| Number | Average Value | Number | Average Value | Number | Average Value | Number | Average Value | Number | Average Value | Number | Average Value | Number | Average Value | |
| LOANS ORIGINATED | 9 | 74,207∣107∣74,207 | 107 | 74,207∣107∣50,438 | 260 | 49,402∣53∣49,402 | 53 | 49,402∣53∣22,218 | 1 | 180,000∣77∣180,000 | 77 | 180,000∣77∣39,460 | 3 | $54,007 |
| APPLICATIONS APPROVED, NOT ACCEPTED | 1 | 66,000∣47∣66,000 | 47 | 66,000∣47∣53,443 | 115 | 52,437∣11∣52,437 | 11 | 52,437∣11∣32,522 | 0 | 0∣21∣0 | 21 | 0∣21∣51,741 | 6 | $48,913 |
| APPLICATIONS DENIED | 7 | 67,486∣83∣67,486 | 83 | 67,486∣83∣47,998 | 526 | 55,656∣123∣55,656 | 123 | 55,656∣123∣19,865 | 0 | 0∣50∣0 | 50 | 0∣50∣50,719 | 21 | $41,773 |
| APPLICATIONS WITHDRAWN | 0 | 0∣29∣0 | 29 | 0∣29∣51,712 | 232 | 59,282∣12∣59,282 | 12 | 59,282∣12∣35,531 | 0 | 0∣18∣0 | 18 | 0∣18∣44,132 | 0 | $0 |
| FILES CLOSED FOR INCOMPLETENESS | 1 | 54,010∣4∣54,010 | 4 | 54,010∣4∣52,478 | 24 | 68,330∣0∣68,330 | 0 | 68,330∣0∣0 | 0 | 0∣3∣0 | 3 | 0∣3∣64,930 | 1 | $54,000 |
| Aggregated Statistics For Year 2003_(Based on 8 full and 4 partial tracts)_ | ||||||||||||
|---|---|---|---|---|---|---|---|---|---|---|---|---|
| A) FHA, FSA/RHS & VAHome Purchase Loans | B) ConventionalHome Purchase Loans | C) Refinancings | D) Home Improvement Loans | E) Loans on Dwellings For 5+ Families | F) Non-occupant Loans on < 5 Family Dwellings (A B C & D) | |||||||
| Number | Average Value | Number | Average Value | Number | Average Value | Number | Average Value | Number | Average Value | Number | Average Value | |
| LOANS ORIGINATED | 13 | 55,275∣90∣55,275 | 90 | 55,275∣90∣51,818 | 268 | 50,414∣41∣50,414 | 41 | 50,414∣41∣20,229 | 2 | 39,320∣58∣39,320 | 58 | 39,320∣58∣40,549 |
| APPLICATIONS APPROVED, NOT ACCEPTED | 3 | 47,270∣35∣47,270 | 35 | 47,270∣35∣52,681 | 123 | 52,198∣18∣52,198 | 18 | 52,198∣18∣23,921 | 0 | 0∣14∣0 | 14 | 0∣14∣42,767 |
| APPLICATIONS DENIED | 7 | 59,453∣91∣59,453 | 91 | 59,453∣91∣55,589 | 491 | 53,821∣90∣53,821 | 90 | 53,821∣90∣14,342 | 0 | 0∣56∣0 | 56 | 0∣56∣52,685 |
| APPLICATIONS WITHDRAWN | 6 | 52,338∣17∣52,338 | 17 | 52,338∣17∣52,298 | 156 | 57,867∣10∣57,867 | 10 | 57,867∣10∣24,219 | 0 | 0∣16∣0 | 16 | 0∣16∣43,295 |
| FILES CLOSED FOR INCOMPLETENESS | 1 | 54,000∣9∣54,000 | 9 | 54,000∣9∣52,507 | 27 | 111,125∣1∣111,125 | 1 | 111,125∣1∣25,010 | 0 | 0∣3∣0 | 3 | 0∣3∣36,023 |
Detailed mortgage data for all 12 tracts in East St. Louis, IL
| Private Mortgage Insurance Companies Aggregated Statistics For Year 2009_(Based on 1 full and 4 partial tracts)_ | ||||
|---|---|---|---|---|
| A) ConventionalHome Purchase Loans | B) Refinancings | |||
| Number | Average Value | Number | Average Value | |
| LOANS ORIGINATED | 2 | 43,575∣1∣43,575 | 1 | 43,575∣1∣76,320 |
| APPLICATIONS APPROVED, NOT ACCEPTED | 1 | 44,950∣2∣44,950 | 2 | 44,950∣2∣52,720 |
| APPLICATIONS DENIED | 0 | 0∣0∣0 | 0 | 0∣0∣0 |
| APPLICATIONS WITHDRAWN | 0 | 0∣0∣0 | 0 | 0∣0∣0 |
| FILES CLOSED FOR INCOMPLETENESS | 0 | 0∣0∣0 | 0 | 0∣0∣0 |
| Aggregated Statistics For Year 2008_(Based on 6 full and 4 partial tracts)_ | ||||||
|---|---|---|---|---|---|---|
| A) ConventionalHome Purchase Loans | B) Refinancings | C) Non-occupant Loans on < 5 Family Dwellings (A & B) | ||||
| Number | Average Value | Number | Average Value | Number | Average Value | |
| LOANS ORIGINATED | 11 | 49,969∣3∣49,969 | 3 | 49,969∣3∣49,713 | 2 | $47,500 |
| APPLICATIONS APPROVED, NOT ACCEPTED | 8 | 65,771∣9∣65,771 | 9 | 65,771∣9∣74,561 | 2 | $55,905 |
| APPLICATIONS DENIED | 1 | 66,200∣2∣66,200 | 2 | 66,200∣2∣86,640 | 1 | $59,470 |
| APPLICATIONS WITHDRAWN | 1 | 62,120∣0∣62,120 | 0 | 62,120∣0∣0 | 0 | $0 |
| FILES CLOSED FOR INCOMPLETENESS | 1 | 63,000∣1∣63,000 | 1 | 63,000∣1∣65,000 | 2 | $64,000 |
| Aggregated Statistics For Year 2007_(Based on 7 full and 4 partial tracts)_ | ||||||||
|---|---|---|---|---|---|---|---|---|
| A) ConventionalHome Purchase Loans | B) Refinancings | C) Non-occupant Loans on < 5 Family Dwellings (A & B) | D) Loans On ManufacturedHome Dwelling (A & B) | |||||
| Number | Average Value | Number | Average Value | Number | Average Value | Number | Average Value | |
| LOANS ORIGINATED | 30 | 63,470∣17∣63,470 | 17 | 63,470∣17∣64,809 | 1 | 27,010∣1∣27,010 | 1 | 27,010∣1∣49,000 |
| APPLICATIONS APPROVED, NOT ACCEPTED | 7 | 64,607∣4∣64,607 | 4 | 64,607∣4∣55,480 | 0 | 0∣0∣0 | 0 | 0∣0∣0 |
| APPLICATIONS DENIED | 3 | 52,870∣0∣52,870 | 0 | 52,870∣0∣0 | 0 | 0∣0∣0 | 0 | 0∣0∣0 |
| APPLICATIONS WITHDRAWN | 0 | 0∣2∣0 | 2 | 0∣2∣47,295 | 0 | 0∣0∣0 | 0 | 0∣0∣0 |
| FILES CLOSED FOR INCOMPLETENESS | 0 | 0∣0∣0 | 0 | 0∣0∣0 | 0 | 0∣0∣0 | 0 | 0∣0∣0 |
| Aggregated Statistics For Year 2006_(Based on 8 full and 4 partial tracts)_ | ||||||
|---|---|---|---|---|---|---|
| A) ConventionalHome Purchase Loans | B) Refinancings | C) Non-occupant Loans on < 5 Family Dwellings (A & B) | ||||
| Number | Average Value | Number | Average Value | Number | Average Value | |
| LOANS ORIGINATED | 20 | 59,137∣13∣59,137 | 13 | 59,137∣13∣59,522 | 6 | $59,273 |
| APPLICATIONS APPROVED, NOT ACCEPTED | 10 | 51,754∣1∣51,754 | 1 | 51,754∣1∣49,010 | 4 | $40,645 |
| APPLICATIONS DENIED | 0 | 0∣0∣0 | 0 | 0∣0∣0 | 0 | $0 |
| APPLICATIONS WITHDRAWN | 2 | 96,985∣0∣96,985 | 0 | 96,985∣0∣0 | 0 | $0 |
| FILES CLOSED FOR INCOMPLETENESS | 0 | 0∣0∣0 | 0 | 0∣0∣0 | 0 | $0 |
| Aggregated Statistics For Year 2005_(Based on 8 full and 4 partial tracts)_ | ||||||
|---|---|---|---|---|---|---|
| A) ConventionalHome Purchase Loans | B) Refinancings | C) Non-occupant Loans on < 5 Family Dwellings (A & B) | ||||
| Number | Average Value | Number | Average Value | Number | Average Value | |
| LOANS ORIGINATED | 26 | 54,175∣18∣54,175 | 18 | 54,175∣18∣65,157 | 12 | $49,335 |
| APPLICATIONS APPROVED, NOT ACCEPTED | 2 | 43,850∣9∣43,850 | 9 | 43,850∣9∣59,757 | 2 | $47,000 |
| APPLICATIONS DENIED | 1 | 29,810∣0∣29,810 | 0 | 29,810∣0∣0 | 0 | $0 |
| APPLICATIONS WITHDRAWN | 3 | 85,437∣0∣85,437 | 0 | 85,437∣0∣0 | 0 | $0 |
| FILES CLOSED FOR INCOMPLETENESS | 1 | 45,000∣0∣45,000 | 0 | 45,000∣0∣0 | 0 | $0 |
| Aggregated Statistics For Year 2004_(Based on 7 full and 4 partial tracts)_ | ||||||
|---|---|---|---|---|---|---|
| A) ConventionalHome Purchase Loans | B) Refinancings | C) Non-occupant Loans on < 5 Family Dwellings (A & B) | ||||
| Number | Average Value | Number | Average Value | Number | Average Value | |
| LOANS ORIGINATED | 21 | 53,432∣25∣53,432 | 25 | 53,432∣25∣57,596 | 1 | $37,650 |
| APPLICATIONS APPROVED, NOT ACCEPTED | 5 | 60,302∣8∣60,302 | 8 | 60,302∣8∣58,045 | 0 | $0 |
| APPLICATIONS DENIED | 0 | 0∣0∣0 | 0 | 0∣0∣0 | 0 | $0 |
| APPLICATIONS WITHDRAWN | 1 | 33,000∣3∣33,000 | 3 | 33,000∣3∣73,943 | 0 | $0 |
| FILES CLOSED FOR INCOMPLETENESS | 0 | 0∣0∣0 | 0 | 0∣0∣0 | 0 | $0 |
| Aggregated Statistics For Year 2003_(Based on 7 full and 4 partial tracts)_ | ||||||
|---|---|---|---|---|---|---|
| A) ConventionalHome Purchase Loans | B) Refinancings | C) Non-occupant Loans on < 5 Family Dwellings (A & B) | ||||
| Number | Average Value | Number | Average Value | Number | Average Value | |
| LOANS ORIGINATED | 17 | 55,268∣28∣55,268 | 28 | 55,268∣28∣62,169 | 3 | $43,727 |
| APPLICATIONS APPROVED, NOT ACCEPTED | 3 | 33,883∣6∣33,883 | 6 | 33,883∣6∣80,533 | 2 | $41,500 |
| APPLICATIONS DENIED | 0 | 0∣1∣0 | 1 | 0∣1∣88,000 | 0 | $0 |
| APPLICATIONS WITHDRAWN | 0 | 0∣2∣0 | 2 | 0∣2∣73,205 | 0 | $0 |
| FILES CLOSED FOR INCOMPLETENESS | 0 | 0∣0∣0 | 0 | 0∣0∣0 | 0 | $0 |
2003 - 2011 National Fire Incident Reporting System (NFIRS) incidents
See full National Fire Incident Reporting System statistics for East St. Louis, IL
- 85.0%Utility gas
- 12.9%Electricity
- 1.1%Fuel oil, kerosene, etc.
- 0.7%No fuel used
- 0.3%Bottled, tank, or LP gas
East St. Louis compared to Illinois state average:
- Median household income significantly below state average.
- Median house value significantly below state average.
- Black race population percentage significantly above state average.
- Hispanic race population percentage significantly below state average.
- Median age below state average.
- Foreign-born population percentage significantly below state average.
- Renting percentage above state average.
- Length of stay since moving in significantly above state average.
- Number of college students significantly below state average.
- Percentage of population with a bachelor's degree or higher below state average.
East St. Louis on our top lists:
- #1 on the list of "Top 101 cities with the highest city-data.com crime index, excludes tourist destinations and others with a lot of outsiders visiting based on city industries data (population 5,000+)"
- #1 on the list of "Top 101 cities with the highest number of assaults per 100,000 residents, excludes tourist destinations and others with a lot of outsiders visiting based on city industries data (population 5,000+)"
- #3 on the list of "Top 101 cities with the largest city-data.com crime index per police officer (population 5,000+)"
- #6 on the list of "Top 101 cities with the highest number of murders per 100,000 residents, excludes tourist destinations and others with a lot of outsiders visiting based on city industries data (population 5,000+)"
- #7 on the list of "Top 101 cities with the highest number of rapes per 100,000 residents, excludes tourist destinations and others with a lot of outsiders visiting based on city industries data (population 5,000+)"
- #7 on the list of "Top 101 cities with the highest percentage of single-parent households, population 5,000+"
- #13 on the list of "Top 100 least-safe cities (highest city-data.com crime index)"
- #14 on the list of "Top 101 cities with the highest number of arson incidents per 100,000 residents, excludes tourist destinations and others with a lot of outsiders visiting based on city industries data (population 5,000+)"
- #15 on the list of "Top 101 cities with the highest number of robberies per 100,000 residents, excludes tourist destinations and others with a lot of outsiders visiting based on city industries data (population 5,000+)"
- #21 on the list of "Top 101 cities with the highest number of burglaries per 100,000 residents, excludes tourist destinations and others with a lot of outsiders visiting based on city industries data (population 5,000+)"
- #21 on the list of "Top 101 cities with the highest number of auto thefts per 100,000 residents, excludes tourist destinations and others with a lot of outsiders visiting based on city industries data (population 5,000+)"
- #30 on the list of "Top 101 cities with the least cars per house, population 5,000+"
- #39 on the list of "Top 101 cities with largest percentage of females in occupations: healthcare support occupations (population 5,000+)"
- #68 on the list of "Top 101 cities with largest percentage of females in occupations: building and grounds cleaning and maintenance occupations (population 5,000+)"
- #77 on the list of "Top 101 cities with the largest percentage population decrease from 2000 (population 5,000+)"
- #77 on the list of "Top 101 cities where residents moved in more then 10 years ago (10,000+ households)"
- #100 on the list of "Top 101 cities with the highest percentage of English-only speaking households, population 5,000+"
- #22 on the list of "Top 101 counties with the largest decrease in the number of infant deaths per 1000 residents 2000-2006 to 2007-2013 (pop. 50,000+)"
- #41 on the list of "Top 101 counties with the highest Nitrogen Dioxide air pollution readings in 2012 (ppm)"
- #61 on the list of "Top 101 counties with the lowest Ozone (1-hour) air pollution readings in 2012 (ppm)"
- #75 on the list of "Top 101 counties with the highest Sulfur Oxides Annual air pollution readings in 2012 (µg/m3)"
- #76 on the list of "Top 101 counties with the highest percentage of residents relocating from foreign countries between 2010 and 2011 (pop. 50,000+)"