University Park, Florida (FL 33165) profile: population, maps, real estate, averages, homes, statistics, relocation, travel, jobs, hospitals, schools, crime, moving, houses, news, sex offenders (original) (raw)
Submit your own pictures of this place and show them to the world
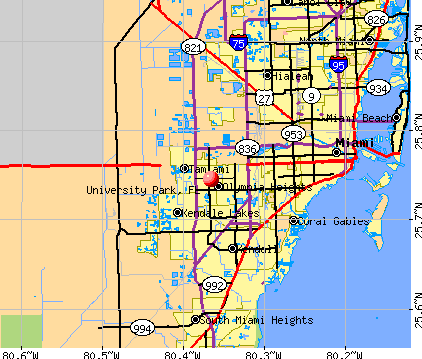
OSM Map
General Map
Google Map
MSN Map
OSM Map
General Map
Google Map
MSN Map
OSM Map
General Map
Google Map
MSN Map
OSM Map
General Map
Google Map
MSN Map
Please wait while loading the map...
Current weather forecast for University Park, FL
Population in 2010: 26,995.
Population change since 2000: +1.7%
| Median resident age: | 42.7 years |
|---|---|
| Florida median age: | 42.7 years |
Zip codes: 33165.
Estimated median household income in 2022: 74,880(∗∗itwas∗∗74,880 (it was 74,880(∗∗itwas∗∗40,039 in 2000)
| University Park: | $74,880 |
|---|---|
| FL: | $69,303 |
Estimated per capita income in 2022: 35,494(∗∗itwas∗∗35,494 (it was 35,494(∗∗itwas∗∗17,249 in 2000)
University Park CDP income, earnings, and wages data
Estimated median house or condo value in 2022: 581,041(∗∗itwas∗∗581,041 (it was 581,041(∗∗itwas∗∗145,100 in 2000)
| University Park: | $581,041 |
|---|---|
| FL: | $354,100 |
Mean prices in 2022: all housing units: 606,087;∗∗detachedhouses:∗∗606,087; detached houses: 606,087;∗∗detachedhouses:∗∗666,163; townhouses or other attached units: 435,342;∗∗in2−unitstructures:∗∗435,342; in 2-unit structures: 435,342;∗∗in2−unitstructures:∗∗480,048; in 3-to-4-unit structures: 325,696;∗∗in5−or−more−unitstructures:∗∗325,696; in 5-or-more-unit structures: 325,696;∗∗in5−or−more−unitstructures:∗∗554,909; mobile homes: 128,887;∗∗occupiedboats,rvs,vans,etc.:∗∗128,887; occupied boats, rvs, vans, etc.: 128,887;∗∗occupiedboats,rvs,vans,etc.:∗∗162,124
Median gross rent in 2022: $1,759.
March 2022 cost of living index in University Park: 108.0 (more than average, U.S. average is 100)
University Park, FL residents, houses, and apartments details
Percentage of residents living in poverty in 2022: 11.9%
(9.6% for White Non-Hispanic residents, 16.5% for Black residents, 11.1% for Hispanic or Latino residents, 100.0% for American Indian residents, 24.7% for two or more races residents)
Detailed information about poverty and poor residents in University Park, FL
Business Search - 14 Million verified businesses
- 24,86689.7%Hispanic
- 1,8306.6%White alone
- 1,0743.9%Black alone
- 8152.9%Asian alone
- 1870.7%Two or more races
- 190.07%American Indian alone
- 190.07%Other race alone
Races in University Park detailed stats: ancestries, foreign born residents, place of birth


Latest news from University Park, FL collected exclusively by city-data.com from local newspapers, TV, and radio stations
Ancestries: American (1.5%).
Current Local Time: EST time zone
Land area: 4.06 square miles.
Population density: 6,648 people per square mile (high).
16,851 residents are foreign born (55.7% Latin America).
| This place: | 60.8% |
|---|---|
| Florida: | 100.0% |
Median real estate property taxes paid for housing units with mortgages in 2022: $3,928 (0.8%)
Median real estate property taxes paid for housing units with no mortgage in 2022: $3,438 (0.7%)
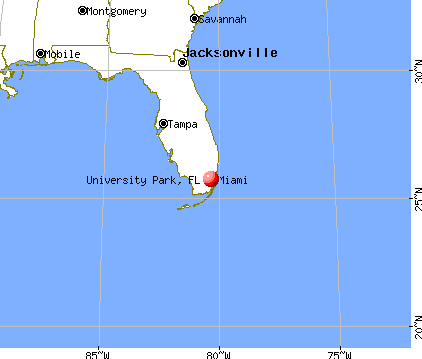
Nearest city with pop. 50,000+: South Westside, FL (1.1 miles , pop. 91,953).
Nearest city with pop. 200,000+: Kendale Lakes-Lindgren Acres, FL (4.9 miles , pop. 314,677).
Nearest city with pop. 1,000,000+: Houston, TX (959.4 miles , pop. 1,953,631).
Nearest cities:
Latitude: 25.75 N**, Longitude:** 80.37 W
Daytime population change due to commuting: +1,234 (+4.4%)
Workers who live and work in this place: 1,989 (13.9%)
Property values in University Park, FL
Unemployment in December 2023:
Most common industries in University Park, FL (%)
- Educational services (9.0%)
- Health care (8.7%)
- Construction (7.9%)
- Finance & insurance (6.4%)
- Accommodation & food services (5.9%)
- Professional, scientific, technical services (5.7%)
- Administrative & support & waste management services (5.2%)
Most common occupations in University Park, FL (%)
- Other office and administrative support workers, including supervisors (6.3%)
- Building and grounds cleaning and maintenance occupations (4.2%)
- Other sales and related occupations, including supervisors (4.1%)
- Sales representatives, services, wholesale and manufacturing (3.8%)
- Other management occupations, except farmers and farm managers (3.8%)
- Secretaries and administrative assistants (3.5%)
- Accountants and auditors (3.2%)
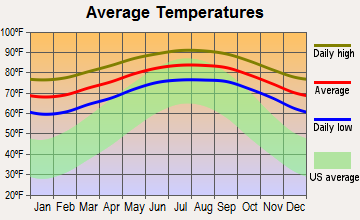
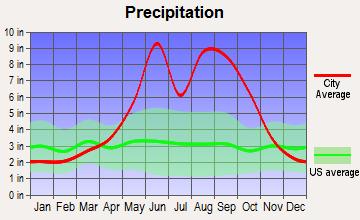
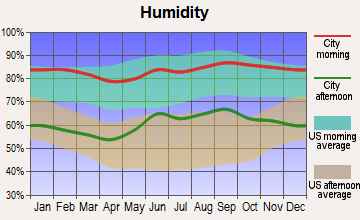
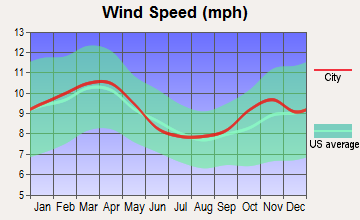
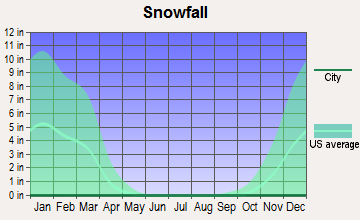
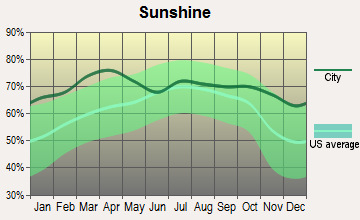
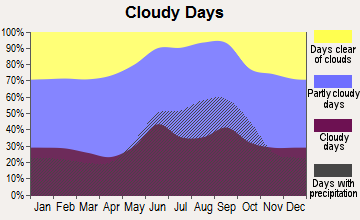
Average climate in University Park, Florida
Based on data reported by over 4,000 weather stations
Air pollution and air quality trends (lower is better)
AQI CO NO2 SO2 Ozone PM10 PM2.5
Air Quality Index (AQI) level in 2022 was 79.1**. This is about average.**
Tornado activity:
University Park-area historical tornado activity is below Florida state average. It is 38% smaller than the overall U.S. average.
On 6/17/1959**, a** category F3 (max. wind speeds 158-206 mph) tornado 5.5 miles away from the University Park place center injured 77 people and caused between 500,000∗∗and∗∗500,000 and 500,000∗∗and∗∗5,000,000 in damages.
On 4/10/1956**, a** category F3 tornado 19.6 miles away from the place center injured 20 people and caused between 500,000∗∗and∗∗500,000 and 500,000∗∗and∗∗5,000,000 in damages.
Earthquake activity:
University Park-area historical earthquake activity is significantly below Florida state average. It is 99% smaller than the overall U.S. average.
On 9/10/2006 at 14:56:08**, a magnitude** 5.9 (5.9 MB**,** 5.5 MS**,** 5.8 MW**, Class:** Moderate**, Intensity:** VI - VII) earthquake occurred 390.9 miles away from University Park center
On 2/22/1992 at 04:21:34**, a magnitude** 3.2 (3.2 MB**, Depth:** 6.2 mi**, Class:** Light**, Intensity:** II - III) earthquake occurred 101.1 miles away from University Park center
On 6/23/2016 at 17:20:29**, a magnitude** 3.8 (3.8 ML) earthquake occurred 299.2 miles away from the city center
On 7/16/2016 at 20:00:10**, a magnitude** 3.7 (3.7 MB) earthquake occurred 283.8 miles away from University Park center
On 9/21/2016 at 16:30:52**, a magnitude** 3.8 (3.8 ML) earthquake occurred 304.0 miles away from University Park center
On 9/4/2016 at 18:29:29**, a magnitude** 3.8 (3.8 ML) earthquake occurred 305.1 miles away from University Park center
Magnitude types: body-wave magnitude (MB), local magnitude (ML), surface-wave magnitude (MS), moment magnitude (MW)
Natural disasters:
The number of natural disasters in Miami-Dade County (10) is smaller than the US average (15).
Major Disasters (Presidential) Declared: 5
Emergencies Declared: 3
Causes of natural disasters: Hurricanes: 7**, Tropical Storms:** 2**, Tornado:** 1**, Other:** 1 (Note: some incidents may be assigned to more than one category).
Hospitals and medical centers in University Park:
- DSI LAKEWOOD RENAL CENTER (8470 COOPER CREEK BLVD)
Other hospitals and medical centers near University Park:
- LLERENA HOME HEALTH CARE INC (Home Health Center, about 1 miles away; MIAMI, FL)
- M A HOME HEALTH LLC (Home Health Center, about 1 miles away; MIAMI, FL)
- NEW HEALTH CARE CORP (Home Health Center, about 1 miles away; MIAMI, FL)
- FIRST HOME HEALTH CARE INC (Home Health Center, about 1 miles away; MIAMI, FL)
- FAITH HEALTH CARE INC (Home Health Center, about 2 miles away; MIAMI, FL)
- SUNSHINE PHYSICAL REHABILITATI (Hospital, about 2 miles away; MIAMI, FL)
- ARMS OF LOVE HOME HEALTH AGENCY INC (Home Health Center, about 2 miles away; MIAMI, FL)
Amtrak stations near University Park:
- 6 miles: MIAMI INT'L AIRPORT (MIAMI, TRANSIT BUS LOADING AREA) - Bus Station
- 10 miles: MIAMI (8303 N.W. 37TH AVE.) . Services: ticket office, fully wheelchair accessible, enclosed waiting area, public restrooms, public payphones, vending machines, free short-term parking, call for car rental service, taxi stand, public transit connection.
Colleges/universities with over 2000 students nearest to University Park:
- Florida Career College-Miami (about 1 miles; Miami, FL; Full-time enrollment: 10,133)
- Florida International University (about 2 miles; Miami, FL; FT enrollment: 41,234)
- University of Miami (about 6 miles; Coral Gables, FL; FT enrollment: 13,674)
- Florida National University-Main Campus (about 9 miles; Hialeah, FL; FT enrollment: 4,106)
- Miami Dade College (about 12 miles; Miami, FL; FT enrollment: 53,787)
- AI Miami International University of Art and Design (about 12 miles; Miami, FL; FT enrollment: 3,578)
- St Thomas University (about 14 miles; Miami Gardens, FL; FT enrollment: 2,096)
Points of interest:
Click to draw/clear place borders
Notable locations in University Park: Tamiami Park Stadium (A), Roxy Performing Arts Center (B), University Park Library (C), Third District Court of Appeals Library (D), Smiling Faces Day Care Center (E), Play and Learn Child Care Center (F), Peter Pan Child Care and Learning Center (G), Olga Music and Day Care Center (H), National Hurricane Center (I), My Garden's Friend Day Care Center (J), Kids Paradise Day Care Center (K), Joyce West Family Day Care Home (L), Kid Station Day Care Center (M), Great Beginnings Day Care Center (N). Display/hide their locations on the map
Shopping Center: Concord Shopping Center (1). Display/hide its location on the map
Churches in University Park include: Trinity Church (A), Saint Agatha Church (B), Gateway Baptist Church (C), Coral Park Baptist Church (D), Our Lady of Lakes Catholic Church (E), Coral Village Church (F). Display/hide their locations on the map
Parks in University Park include: Westbrook Park (1), Concord Park (2), Tamiami Park (3), Tamiami Regional Park (4). Display/hide their locations on the map
Miami-Dade County has a predicted average indoor radon screening level between 2 and 4 pCi/L (pico curies per liter) - Moderate Potential
Average household size:
| This place: | 3.0 people |
|---|---|
| Florida: | 2.5 people |
Percentage of family households:
| This place: | 76.8% |
|---|---|
| Whole state: | 65.2% |
Percentage of households with unmarried partners:
| This place: | 6.5% |
|---|---|
| Whole state: | 7.3% |
Likely homosexual households (counted as self-reported same-sex unmarried-partner households)
- Lesbian couples: 0.2% of all households
- Gay men: 0.2% of all households
People in group quarters in University Park in 2010:
- 2,583 people in college/university student housing
- 65 people in workers' group living quarters and job corps centers
- 17 people in group homes intended for adults
- 2 people in nursing facilities/skilled-nursing facilities
People in group quarters in University Park in 2000:
- 825 people in college dormitories (includes college quarters off campus)
- 103 people in nursing homes
- 15 people in other noninstitutional group quarters
- 10 people in schools, hospitals, or wards for the intellectually disabled
- 3 people in religious group quarters
Banks with branches in University Park (2011 data):
- BMO Harris Bank National Association: University Parkway Branch at 5225 University Parkway**, branch established on** 2009/02/17**. Info updated** 2011/07/14: Bank assets: 97,264.0mil∗∗,Deposits:∗∗97,264.0 mil**, Deposits:** 97,264.0mil∗∗,Deposits:∗∗75,624.6 mil**, headquarters in** Chicago, IL**, positive income** , 717 total offices , Holding Company: Bank Of Montreal
For population 15 years and over in University Park:
- Never married: 38.3%
- Now married: 42.7%
- Separated: 1.7%
- Widowed: 6.3%
- Divorced: 11.0%
For population 25 years and over in University Park:
- High school or higher: 81.1%
- Bachelor's degree or higher: 28.0%
- Graduate or professional degree: 11.3%
- Unemployed: 9.3%
- Mean travel time to work (commute): 28.9 minutes
Education Gini index (Inequality in education)
| Here: | 14.7 |
|---|---|
| Florida average: | 12.2 |
Graphs represent county-level data. Detailed 2008 Election Results
Political contributions by individuals in University Park, FL
Religion statistics for University Park, FL (based on Miami-Dade County data)
| Religion | Adherents | Congregations |
|---|---|---|
| Catholic | 544,449 | 65 |
| Evangelical Protestant | 271,814 | 922 |
| Other | 71,458 | 200 |
| Black Protestant | 60,074 | 94 |
| Mainline Protestant | 40,287 | 146 |
| Orthodox | 4,440 | 10 |
| None | 1,503,913 | - |
Source: Clifford Grammich, Kirk Hadaway, Richard Houseal, Dale E.Jones, Alexei Krindatch, Richie Stanley and Richard H.Taylor. 2012. 2010 U.S.Religion Census: Religious Congregations & Membership Study. Association of Statisticians of American Religious Bodies. Jones, Dale E., et al. 2002. Congregations and Membership in the United States 2000. Nashville, TN: Glenmary Research Center. Graphs represent county-level data
Food Environment Statistics:
**Number of grocery stores: 597
| Here: | 2.51 / 10,000 pop. |
|---|---|
| Florida: | 2.04 / 10,000 pop. |
**Number of supercenters and club stores: 15
| This county: | 0.06 / 10,000 pop. |
|---|---|
| Florida: | 0.11 / 10,000 pop. |
**Number of convenience stores (no gas): 285
| Miami-Dade County: | 1.20 / 10,000 pop. |
|---|---|
| Florida: | 1.28 / 10,000 pop. |
**Number of convenience stores (with gas): 473
| Miami-Dade County: | 1.98 / 10,000 pop. |
|---|---|
| Florida: | 3.04 / 10,000 pop. |
**Number of full-service restaurants: 1,610
| Miami-Dade County: | 6.76 / 10,000 pop. |
|---|---|
| Florida: | 7.45 / 10,000 pop. |
**Adult diabetes rate:
| This county: | 7.9% |
|---|---|
| Florida: | 9.2% |
**Low-income preschool obesity rate:
| Miami-Dade County: | 15.8% |
|---|---|
| Florida: | 14.0% |
Health and Nutrition:
**Healthy diet rate:
| University Park: | 50.2% |
|---|---|
| Florida: | 51.4% |
**Average overall health of teeth and gums:
**Average BMI:
| This city: | 28.5 |
|---|---|
| Florida: | 28.6 |
**People feeling badly about themselves:
| This city: | 18.2% |
|---|---|
| Florida: | 19.5% |
**People not drinking alcohol at all:
| This city: | 12.4% |
|---|---|
| State: | 10.7% |
**Average hours sleeping at night:
| University Park: | 6.9 |
|---|---|
| Florida: | 6.9 |
**Overweight people:
| University Park: | 35.1% |
|---|---|
| Florida: | 34.7% |
**General health condition:
**Average condition of hearing:
| University Park: | 81.1% |
|---|---|
| Florida: | 79.2% |
More about Health and Nutrition of University Park, FL Residents
4.04% of this county's 2021 resident taxpayers lived in other counties in 2020 ($229,296 average adjusted gross income)
| Here: | 4.04% |
|---|---|
| Florida average: | 8.80% |
0.03% of residents moved from foreign countries ($357 average AGI)
Miami-Dade County: 0.03% Florida average: 0.05%
Top counties from which taxpayers relocated into this county between 2020 and 2021:
5.24% of this county's 2020 resident taxpayers moved to other counties in 2021 ($66,399 average adjusted gross income)
| Here: | 5.24% |
|---|---|
| Florida average: | 7.45% |
0.03% of residents moved to foreign countries ($505 average AGI)
Miami-Dade County: 0.03% Florida average: 0.04%
Top counties to which taxpayers relocated from this county between 2020 and 2021:
| Businesses in University Park, FL | |||
|---|---|---|---|
| Name | Count | Name | Count |
| CVS | 1 | SAS Shoes | 1 |
| Comfort Suites | 1 | Sprint Nextel | 1 |
| FedEx | 1 | Staples | 1 |
| Hilton | 1 | UPS | 2 |
| Kohl's | 1 | Value City Furniture | 1 |
| Nike | 1 | Vans | 1 |
| Pier 1 Imports | 1 |
Strongest AM radio stations in University Park:
- WSUA (1260 AM; 50 kW; MIAMI, FL; Owner: WSUA BROADCASTING CORPORATION)
- WQBA (1140 AM; 50 kW; MIAMI, FL; Owner: WQBA-AM LICENSE CORP.)
- WWFE (670 AM; 50 kW; MIAMI, FL; Owner: FENIX BROADCASTING CORP.)
- WACC (830 AM; 5 kW; HIALEAH, FL; Owner: RADIO PEACE CATHOLIC BROADCASTING, INC.)
- WVCG (1080 AM; 50 kW; CORAL GABLES, FL; Owner: RADIO ONE LICENSES, LLC)
- WNMA (1210 AM; 49 kW; MIAMI SPRINGS, FL; Owner: RADIO UNICA OF MIAMI LICENSE CORP.)
- WAQI (710 AM; 50 kW; MIAMI, FL; Owner: LICENSE CORPORATION #1)
- WRHC (1550 AM; 45 kW; CORAL GABLES, FL; Owner: WRHC BROADCASTING CORP.)
- WRFX (940 AM; 50 kW; MIAMI, FL; Owner: CLEAR CHANNEL BROADCASTING LICENSES, INC.)
- WMYM (990 AM; 5 kW; MIAMI, FL; Owner: ABC, INC.)
- WRHB (1020 AM; 9 kW; KENDALL, FL; Owner: NEW WORLD BROADCASTING, INC.)
- WJCC (1700 AM; 10 kW; MIAMI SPRINGS, FL; Owner: RADIO UNICA OF MIAMI LICENSE CORP.)
- WQAM (560 AM; 5 kW; MIAMI, FL; Owner: WQAM LICENSE LIMITED PARTNERSHIP)
Strongest FM radio stations in University Park:
- WDNA (88.9 FM; MIAMI, FL; Owner: BASCOMB MEMORIAL BROADCASTING FOUNDATION)
- WXDJ (95.7 FM; NORTH MIAMI BEACH, FL; Owner: WXDJ LICENSING, INC.)
- WAMR-FM (107.5 FM; MIAMI, FL; Owner: WQBA-FM LICENSE CORP.)
- WRTO (98.3 FM; GOULDS, FL; Owner: LICENSE CORPORATION #2)
- WMCU (89.7 FM; MIAMI, FL; Owner: TRINITY INTERNATIONAL FOUNDATION, INC.)
- WCMQ-FM (92.3 FM; HIALEAH, FL; Owner: WCMQ LICENSING, INC.)
- WHQT (105.1 FM; CORAL GABLES, FL; Owner: COX RADIO, INC.)
- WLVE (93.9 FM; MIAMI BEACH, FL; Owner: CLEAR CHANNEL BROADCASTING LICENSES, INC.)
- WMIB (103.5 FM; FORT LAUDERDALE, FL; Owner: CLEAR CHANNEL BROADCASTING LICENSES, INC.)
- WMXJ (102.7 FM; POMPANO BEACH, FL; Owner: JEFFERSON-PILOT COMMUNICATIONS CO. OF FLORIDA)
- WPOW (96.5 FM; MIAMI, FL; Owner: WPOW LICENSE LIMITED PARTNERSHIP)
- WZTA (94.9 FM; MIAMI BEACH, FL; Owner: CLEAR CHANNEL BROADCASTING LICENSES, INC.)
- WFLC (97.3 FM; MIAMI, FL; Owner: COX RADIO, INC.)
- WPYM (93.1 FM; MIAMI, FL; Owner: COX RADIO-MIAMI, LLC)
- WLRN-FM (91.3 FM; MIAMI, FL; Owner: THE SCHOOL BOARD OF MIAMI - DADE COUNTY, FL)
- WBGG-FM (105.9 FM; FORT LAUDERDALE, FL; Owner: CLEAR CHANNEL BROADCASTING LICENSES, INC.)
- WHYI-FM (100.7 FM; FORT LAUDERDALE, FL; Owner: CLEAR CHANNEL BROADCASTING LICENSES, INC.)
- WKIS (99.9 FM; BOCA RATON, FL; Owner: WKIS LICENSE LIMITED PARTNERSHIP)
- WRMA (106.7 FM; FORT LAUDERDALE, FL; Owner: WRMA LICENSING, INC.)
- WLYF (101.5 FM; MIAMI, FL; Owner: JEFFERSON-PILOT COMMUNICATIONS CO. OF FLORIDA)
TV broadcast stations around University Park:
- WIMP-CA (Channel 25; MIAMI, FL; Owner: SUNSHINE BROADCASTING COMPANY, INC.)
- WJAN-CA (Channel 41; MIAMI, FL; Owner: SHERJAN BROADCASTING COMPANY, INC.)
- WVEB-CA (Channel 21; MIAMI, ETC., FL; Owner: HISPANIC KEYS BROADCASTING CORPORATION)
- WTVJ (Channel 6; MIAMI, FL; Owner: NBC STATIONS MANAGEMENT, INC.)
- WGEN-LP (Channel 55; MIAMI, FL; Owner: WDLP BROADCASTING COMPANY, LLC)
- WPBT (Channel 2; MIAMI, FL; Owner: COMMUNITY TV FOUNDATION OF S. FLORIDA, INC.)
- WSVN (Channel 7; MIAMI, FL; Owner: SUNBEAM TELEVISION CORP.)
- WPLG (Channel 10; MIAMI, FL; Owner: POST-NEWSWEEK STATIONS, FLORIDA, INC.)
- WLTV (Channel 23; MIAMI, FL; Owner: WLTV LICENSE PARTNERSHIP, G.P.)
- WPMF-LP (Channel 31; MIAMI, FL; Owner: JAMES J. CHLADEK)
- WBFS-TV (Channel 33; MIAMI, FL; Owner: VIACOM STATIONS GROUP OF MIAMI INC.)
- WLRN-TV (Channel 17; MIAMI, FL; Owner: THE SCHOOL BOARD OF MIAMI - DADE COUNTY, FL)
- WBZL (Channel 39; MIAMI, FL; Owner: CHANNEL 39, INC.)
- WPXM (Channel 35; MIAMI, FL; Owner: PAXSON COMMUNICATIONS LICENSE COMPANY, LLC)
- WAMI-TV (Channel 69; HOLLYWOOD, FL; Owner: TELEFUTURA MIAMI LLC)
- WSCV (Channel 51; FORT LAUDERDALE, FL; Owner: TELEMUNDO OF FLORIDA LICENSE CORP.)
- WLMF-LP (Channel 53; MIAMI, FL; Owner: PAGING SYSTEMS, INC.)
- WPPB-TV (Channel 63; BOCA RATON, FL; Owner: THE SCHOOL BOARD OF BROWARD COUNTY, FLORIDA)
- W58BU (Channel 58; HALLANDALE, FL; Owner: NBC STATIONS MANAGEMENT,INC.)
- WHFT-TV (Channel 45; MIAMI, FL; Owner: TRINITY BROADCASTING OF FLORIDA, INC.)
- W24CA (Channel 24; MARATHON, FL; Owner: KEY COMMUNICATIONS OF TEXAS)
- WFUN-CA (Channel 48; MIAMI, ETC., FL; Owner: LOCALONE TEXAS, LTD.)
- W54BB (Channel 54; ROCK HARBOR, FL; Owner: WDLP BROADCASTING COMPANY, LLC)
- WEYS-LP (Channel 56; ROCK HARBOR, FL; Owner: CAYO HUESO NETWORKS, LLC)
- WHDT-LP (Channel 44; MIAMI, FL; Owner: GUENTER MARKSTEINER)
- National Bridge Inventory (NBI) Statistics
- 1Number of bridges
- 3ft / 0.8mTotal length
- 17,000Total average daily traffic
- 680Total average daily truck traffic
- 27,700Total future (year 2042) average daily traffic
FCC Registered Antenna Towers:
15 (See the full list of FCC Registered Antenna Towers in University Park)
FCC Registered Broadcast Land Mobile Towers:
3
- Lat: 27.406611 Lon: -82.476278, Call Sign: WQNK700,
Assigned Frequencies: 451.387 MHz, 456.387 MHz, 452.062 MHz, 457.062 MHz, Grant Date: 03/09/2021, Expiration Date: 03/07/2031, Certifier: Jeff Keech, Registrant: Cara Enterprises Inc, Las Vegas, NV 89140-0124, Phone: (702) 838-9728, Fax: (702) 363-4607, Email: - Lat: 27.388667 Lon: -82.455611, Call Sign: WQTJ282,
Assigned Frequencies: 463.837 MHz, 467.850 MHz, 467.875 MHz, 467.900 MHz, 467.437 MHz, Grant Date: 02/13/2014, Expiration Date: 02/13/2024, Certifier: Danine Rehkopf, Registrant: Cara Enterprises Inc, Las Vegas, NV 89140-0124, Phone: (702) 838-9728, Fax: (702) 363-4607, Email: - Lat: 27.405806 Lon: -82.473444, Call Sign: WSAH948,
Assigned Frequencies: 462.287 MHz, 467.287 MHz, 462.387 MHz, 467.387 MHz, Grant Date: 01/18/2024, Expiration Date: 01/18/2034, Certifier: Curtis Nickerson, Registrant: Cara Enterprises, Inc., Las Vegas, NV 89140, Phone: (702) 838-9728, Fax: (702) 363-4607, Email:
FCC Registered Microwave Towers:
9 (See the full list of FCC Registered Microwave Towers in this town)
FCC Registered Amateur Radio Licenses:
6
- Call Sign: K1YPW, Licensee ID: L00932568, Grant Date: 07/05/2018, Expiration Date: 07/14/2028, Certifier: Richard I Hemingway, Registrant: Richard I Hemingway, 7869 Wilton Crescent Circle, University Park, FL 34201
- Call Sign: KA3YRX, Licensee ID: L00664242, Grant Date: 04/03/2003, Expiration Date: 04/03/2013, Cancellation Date: 09/08/2010, Certifier: Frederick M Leedom, Registrant: Frederick M Leedom, 7922 Edmonston Circle, University Park, FL 34201
- Call Sign: KB2ECP, Licensee ID: L01034123, Grant Date: 12/05/2017, Expiration Date: 01/09/2028, Certifier: John M Frank, Registrant: John M Frank, 6178 Palomino Circle, University Park, FL 34201
- Call Sign: N4YYA, Previous Call Sign: KC4OZD, Licensee ID: L00262556, Grant Date: 04/21/2020, Expiration Date: 07/17/2030, Certifier: Joseph R Vazquez, Registrant: Joseph R Vazquez, 5265 University Pkwy Ste 101-320, University Park, FL 34201
- Call Sign: W2VXH, Licensee ID: L01128968, Grant Date: 01/06/2016, Expiration Date: 03/16/2026, Certifier: William W Hardwick, Registrant: William W Hardwick, 7817 Wilton Crescent Circle, University Park, FL 34201
- Call Sign: W1TA, Previous Call Sign: W8NRB, Licensee ID: L00688801, Grant Date: 02/09/2024, Expiration Date: 03/31/2034, Certifier: Lawrence E Demilner, Registrant: Lawrence E Demilner, 6557 Copper Ridge Trail, University Park, FL 34240
FAA Registered Aircraft:
4
- Aircraft: FLIGHT DESIGN GMBH CTLS (Category: Land, Seats: 2, Weight: Up to 12,499 Pounds), Engine: ROTAX 912ULS SERIES (100 HP) (4 Cycle)
N-Number: 544CT, N544CT, N-544CT, Serial Number: 07-11-24, Year manufactured: 2008, Airworthiness Date: 05/05/2008, Certificate Issue Date: 03/30/2011
Registrant (Co-Owned): William J Oneill, 8028 Warwick Gardens Ln, University Park, FL 34201, Other Owners: Joan E Oneill - Aircraft: JABIRU USA SPORT AIRCRAFT LLC J250-SP (Category: Land, Seats: 2, Weight: Up to 12,499 Pounds), Engine: JABIRU 3300 (120 HP) (4 Cycle)
N-Number: 668J, N668J, N-668J, Serial Number: 575, Year manufactured: 2008, Airworthiness Date: 10/21/2008, Certificate Issue Date: 12/09/2008
Registrant (Co-Owned): Gries Bernard Von, 8123 Regents Ct, University Park, FL 34201, Other Owners: Gries Susan Von - Aircraft: VANS AIRCRAFT INC RV-12 (Category: Land, Seats: 2, Weight: Up to 12,499 Pounds), Engine: ROTAX 912ULS SERIES (100 HP) (4 Cycle)
N-Number: 941FL, N941FL, N-941FL, Serial Number: 120151, Airworthiness Date: 12/11/2014, Certificate Issue Date: 12/09/2014
Registrant (Corporation): Rv-12 Inc, 8203 Planters Knoll Ter, University Park, FL 34201 - Aircraft: COSTRUZIONI AERONAUTICHE TECNA P2002 SIERRA (Category: Land, Seats: 2, Weight: Up to 12,499 Pounds), Engine: ROTAX 912ULS SERIES (100 HP) (4 Cycle)
N-Number: 122LS, N122LS, N-122LS, Serial Number: 200, Year manufactured: 2006, Airworthiness Date: 04/23/2008, Certificate Issue Date: 02/02/2009
Registrant (Corporation): Plg Aviation Inc, 8020 Warwick Gardens Ln, University Park, FL 34201
Deregistered: Cancel Date: 01/11/2018
| Home Mortgage Disclosure Act Aggregated Statistics For Year 2009_(Based on 4 full tracts)_ | ||||||||||||
|---|---|---|---|---|---|---|---|---|---|---|---|---|
| A) FHA, FSA/RHS & VAHome Purchase Loans | B) ConventionalHome Purchase Loans | C) Refinancings | D) Home Improvement Loans | E) Loans on Dwellings For 5+ Families | F) Non-occupant Loans on < 5 Family Dwellings (A B C & D) | |||||||
| Number | Average Value | Number | Average Value | Number | Average Value | Number | Average Value | Number | Average Value | Number | Average Value | |
| LOANS ORIGINATED | 27 | 202,721∣26∣202,721 | 26 | 202,721∣26∣195,904 | 127 | 198,900∣7∣198,900 | 7 | 198,900∣7∣124,450 | 0 | 0∣5∣0 | 5 | 0∣5∣138,334 |
| APPLICATIONS APPROVED, NOT ACCEPTED | 4 | 168,622∣4∣168,622 | 4 | 168,622∣4∣219,770 | 17 | 174,962∣6∣174,962 | 6 | 174,962∣6∣101,000 | 0 | 0∣2∣0 | 2 | 0∣2∣175,000 |
| APPLICATIONS DENIED | 14 | 188,151∣19∣188,151 | 19 | 188,151∣19∣168,940 | 90 | 222,604∣14∣222,604 | 14 | 222,604∣14∣59,084 | 0 | 0∣16∣0 | 16 | 0∣16∣149,884 |
| APPLICATIONS WITHDRAWN | 12 | 208,266∣9∣208,266 | 9 | 208,266∣9∣257,342 | 45 | 230,400∣1∣230,400 | 1 | 230,400∣1∣226,000 | 1 | 9,500,000∣4∣9,500,000 | 4 | 9,500,000∣4∣186,125 |
| FILES CLOSED FOR INCOMPLETENESS | 4 | 244,335∣4∣244,335 | 4 | 244,335∣4∣248,860 | 10 | 191,071∣0∣191,071 | 0 | 191,071∣0∣0 | 0 | 0∣2∣0 | 2 | 0∣2∣107,220 |
| Aggregated Statistics For Year 2008_(Based on 4 full tracts)_ | ||||||||||||||
|---|---|---|---|---|---|---|---|---|---|---|---|---|---|---|
| A) FHA, FSA/RHS & VAHome Purchase Loans | B) ConventionalHome Purchase Loans | C) Refinancings | D) Home Improvement Loans | E) Loans on Dwellings For 5+ Families | F) Non-occupant Loans on < 5 Family Dwellings (A B C & D) | G) Loans On ManufacturedHome Dwelling (A B C & D) | ||||||||
| Number | Average Value | Number | Average Value | Number | Average Value | Number | Average Value | Number | Average Value | Number | Average Value | Number | Average Value | |
| LOANS ORIGINATED | 19 | 212,212∣56∣212,212 | 56 | 212,212∣56∣233,192 | 169 | 220,560∣31∣220,560 | 31 | 220,560∣31∣134,913 | 2 | 214,410∣21∣214,410 | 21 | 214,410∣21∣151,815 | 1 | $51,000 |
| APPLICATIONS APPROVED, NOT ACCEPTED | 3 | 214,647∣14∣214,647 | 14 | 214,647∣14∣312,659 | 51 | 231,175∣8∣231,175 | 8 | 231,175∣8∣56,375 | 0 | 0∣5∣0 | 5 | 0∣5∣88,468 | 0 | $0 |
| APPLICATIONS DENIED | 6 | 226,540∣54∣226,540 | 54 | 226,540∣54∣266,092 | 149 | 263,199∣23∣263,199 | 23 | 263,199∣23∣104,943 | 1 | 1,700,000∣22∣1,700,000 | 22 | 1,700,000∣22∣184,824 | 1 | $109,000 |
| APPLICATIONS WITHDRAWN | 5 | 227,194∣21∣227,194 | 21 | 227,194∣21∣258,259 | 51 | 249,076∣1∣249,076 | 1 | 249,076∣1∣355,000 | 0 | 0∣7∣0 | 7 | 0∣7∣181,474 | 0 | $0 |
| FILES CLOSED FOR INCOMPLETENESS | 1 | 138,000∣13∣138,000 | 13 | 138,000∣13∣205,199 | 20 | 256,124∣2∣256,124 | 2 | 256,124∣2∣105,575 | 0 | 0∣3∣0 | 3 | 0∣3∣240,327 | 0 | $0 |
| Aggregated Statistics For Year 2007_(Based on 4 full tracts)_ | ||||||||||||||
|---|---|---|---|---|---|---|---|---|---|---|---|---|---|---|
| A) FHA, FSA/RHS & VAHome Purchase Loans | B) ConventionalHome Purchase Loans | C) Refinancings | D) Home Improvement Loans | E) Loans on Dwellings For 5+ Families | F) Non-occupant Loans on < 5 Family Dwellings (A B C & D) | G) Loans On ManufacturedHome Dwelling (A B C & D) | ||||||||
| Number | Average Value | Number | Average Value | Number | Average Value | Number | Average Value | Number | Average Value | Number | Average Value | Number | Average Value | |
| LOANS ORIGINATED | 3 | 202,793∣226∣202,793 | 226 | 202,793∣226∣250,219 | 427 | 248,604∣42∣248,604 | 42 | 248,604∣42∣136,087 | 3 | 950,967∣46∣950,967 | 46 | 950,967∣46∣204,605 | 1 | $126,000 |
| APPLICATIONS APPROVED, NOT ACCEPTED | 0 | 0∣51∣0 | 51 | 0∣51∣238,909 | 89 | 243,534∣9∣243,534 | 9 | 243,534∣9∣142,460 | 1 | 20,000∣6∣20,000 | 6 | 20,000∣6∣259,142 | 0 | $0 |
| APPLICATIONS DENIED | 1 | 205,050∣151∣205,050 | 151 | 205,050∣151∣272,551 | 250 | 267,674∣47∣267,674 | 47 | 267,674∣47∣153,003 | 0 | 0∣19∣0 | 19 | 0∣19∣250,782 | 0 | $0 |
| APPLICATIONS WITHDRAWN | 0 | 0∣43∣0 | 43 | 0∣43∣268,585 | 107 | 246,008∣16∣246,008 | 16 | 246,008∣16∣205,275 | 2 | 49,290∣6∣49,290 | 6 | 49,290∣6∣185,815 | 0 | $0 |
| FILES CLOSED FOR INCOMPLETENESS | 0 | 0∣15∣0 | 15 | 0∣15∣269,331 | 48 | 262,374∣2∣262,374 | 2 | 262,374∣2∣187,215 | 0 | 0∣1∣0 | 1 | 0∣1∣255,000 | 0 | $0 |
| Aggregated Statistics For Year 2006_(Based on 4 full tracts)_ | ||||||||||||||
|---|---|---|---|---|---|---|---|---|---|---|---|---|---|---|
| A) FHA, FSA/RHS & VAHome Purchase Loans | B) ConventionalHome Purchase Loans | C) Refinancings | D) Home Improvement Loans | E) Loans on Dwellings For 5+ Families | F) Non-occupant Loans on < 5 Family Dwellings (A B C & D) | G) Loans On ManufacturedHome Dwelling (A B C & D) | ||||||||
| Number | Average Value | Number | Average Value | Number | Average Value | Number | Average Value | Number | Average Value | Number | Average Value | Number | Average Value | |
| LOANS ORIGINATED | 2 | 245,850∣658∣245,850 | 658 | 245,850∣658∣182,177 | 476 | 226,056∣46∣226,056 | 46 | 226,056∣46∣122,183 | 3 | 3,798,333∣154∣3,798,333 | 154 | 3,798,333∣154∣143,326 | 0 | $0 |
| APPLICATIONS APPROVED, NOT ACCEPTED | 0 | 0∣114∣0 | 114 | 0∣114∣193,036 | 88 | 231,975∣15∣231,975 | 15 | 231,975∣15∣98,261 | 0 | 0∣26∣0 | 26 | 0∣26∣143,634 | 0 | $0 |
| APPLICATIONS DENIED | 1 | 155,760∣262∣155,760 | 262 | 155,760∣262∣224,424 | 262 | 243,120∣40∣243,120 | 40 | 243,120∣40∣78,446 | 0 | 0∣50∣0 | 50 | 0∣50∣157,767 | 1 | $129,140 |
| APPLICATIONS WITHDRAWN | 2 | 170,545∣157∣170,545 | 157 | 170,545∣157∣175,477 | 140 | 226,289∣4∣226,289 | 4 | 226,289∣4∣104,555 | 0 | 0∣46∣0 | 46 | 0∣46∣123,401 | 0 | $0 |
| FILES CLOSED FOR INCOMPLETENESS | 0 | 0∣33∣0 | 33 | 0∣33∣214,165 | 45 | 251,274∣7∣251,274 | 7 | 251,274∣7∣175,856 | 0 | 0∣5∣0 | 5 | 0∣5∣39,632 | 0 | $0 |
| Aggregated Statistics For Year 2005_(Based on 4 full tracts)_ | ||||||||||||||
|---|---|---|---|---|---|---|---|---|---|---|---|---|---|---|
| A) FHA, FSA/RHS & VAHome Purchase Loans | B) ConventionalHome Purchase Loans | C) Refinancings | D) Home Improvement Loans | E) Loans on Dwellings For 5+ Families | F) Non-occupant Loans on < 5 Family Dwellings (A B C & D) | G) Loans On ManufacturedHome Dwelling (A B C & D) | ||||||||
| Number | Average Value | Number | Average Value | Number | Average Value | Number | Average Value | Number | Average Value | Number | Average Value | Number | Average Value | |
| LOANS ORIGINATED | 3 | 146,333∣434∣146,333 | 434 | 146,333∣434∣206,147 | 529 | 195,849∣50∣195,849 | 50 | 195,849∣50∣130,086 | 3 | 3,576,153∣58∣3,576,153 | 58 | 3,576,153∣58∣145,544 | 1 | $128,000 |
| APPLICATIONS APPROVED, NOT ACCEPTED | 0 | 0∣80∣0 | 80 | 0∣80∣201,617 | 95 | 199,008∣8∣199,008 | 8 | 199,008∣8∣49,410 | 0 | 0∣14∣0 | 14 | 0∣14∣229,821 | 2 | $146,500 |
| APPLICATIONS DENIED | 2 | 142,500∣154∣142,500 | 154 | 142,500∣154∣196,830 | 233 | 209,594∣52∣209,594 | 52 | 209,594∣52∣105,159 | 0 | 0∣37∣0 | 37 | 0∣37∣153,705 | 0 | $0 |
| APPLICATIONS WITHDRAWN | 0 | 0∣112∣0 | 112 | 0∣112∣208,434 | 168 | 202,613∣18∣202,613 | 18 | 202,613∣18∣125,109 | 1 | 572,750∣32∣572,750 | 32 | 572,750∣32∣138,598 | 1 | $300,000 |
| FILES CLOSED FOR INCOMPLETENESS | 0 | 0∣21∣0 | 21 | 0∣21∣212,194 | 83 | 206,852∣2∣206,852 | 2 | 206,852∣2∣211,080 | 0 | 0∣1∣0 | 1 | 0∣1∣263,000 | 0 | $0 |
| Aggregated Statistics For Year 2004_(Based on 4 full tracts)_ | ||||||||||||||
|---|---|---|---|---|---|---|---|---|---|---|---|---|---|---|
| A) FHA, FSA/RHS & VAHome Purchase Loans | B) ConventionalHome Purchase Loans | C) Refinancings | D) Home Improvement Loans | E) Loans on Dwellings For 5+ Families | F) Non-occupant Loans on < 5 Family Dwellings (A B C & D) | G) Loans On ManufacturedHome Dwelling (A B C & D) | ||||||||
| Number | Average Value | Number | Average Value | Number | Average Value | Number | Average Value | Number | Average Value | Number | Average Value | Number | Average Value | |
| LOANS ORIGINATED | 5 | 185,418∣401∣185,418 | 401 | 185,418∣401∣186,544 | 557 | 165,409∣48∣165,409 | 48 | 165,409∣48∣91,057 | 1 | 24,650∣56∣24,650 | 56 | 24,650∣56∣123,324 | 0 | $0 |
| APPLICATIONS APPROVED, NOT ACCEPTED | 0 | 0∣58∣0 | 58 | 0∣58∣190,513 | 106 | 161,516∣15∣161,516 | 15 | 161,516∣15∣107,609 | 0 | 0∣10∣0 | 10 | 0∣10∣125,407 | 1 | $25,000 |
| APPLICATIONS DENIED | 0 | 0∣115∣0 | 115 | 0∣115∣193,426 | 249 | 172,984∣47∣172,984 | 47 | 172,984∣47∣90,081 | 0 | 0∣17∣0 | 17 | 0∣17∣131,093 | 2 | $113,365 |
| APPLICATIONS WITHDRAWN | 0 | 0∣70∣0 | 70 | 0∣70∣201,311 | 135 | 175,529∣13∣175,529 | 13 | 175,529∣13∣80,539 | 0 | 0∣9∣0 | 9 | 0∣9∣199,818 | 0 | $0 |
| FILES CLOSED FOR INCOMPLETENESS | 0 | 0∣22∣0 | 22 | 0∣22∣178,399 | 87 | 160,106∣6∣160,106 | 6 | 160,106∣6∣43,023 | 0 | 0∣1∣0 | 1 | 0∣1∣191,000 | 0 | $0 |
| Aggregated Statistics For Year 2003_(Based on 4 full tracts)_ | ||||||||||||
|---|---|---|---|---|---|---|---|---|---|---|---|---|
| A) FHA, FSA/RHS & VAHome Purchase Loans | B) ConventionalHome Purchase Loans | C) Refinancings | D) Home Improvement Loans | E) Loans on Dwellings For 5+ Families | F) Non-occupant Loans on < 5 Family Dwellings (A B C & D) | |||||||
| Number | Average Value | Number | Average Value | Number | Average Value | Number | Average Value | Number | Average Value | Number | Average Value | |
| LOANS ORIGINATED | 8 | 139,362∣337∣139,362 | 337 | 139,362∣337∣179,611 | 943 | 135,107∣29∣135,107 | 29 | 135,107∣29∣41,221 | 1 | 43,000∣58∣43,000 | 58 | 43,000∣58∣126,143 |
| APPLICATIONS APPROVED, NOT ACCEPTED | 0 | 0∣59∣0 | 59 | 0∣59∣186,206 | 170 | 126,700∣13∣126,700 | 13 | 126,700∣13∣47,381 | 0 | 0∣10∣0 | 10 | 0∣10∣153,316 |
| APPLICATIONS DENIED | 1 | 123,000∣66∣123,000 | 66 | 123,000∣66∣171,983 | 363 | 142,128∣41∣142,128 | 41 | 142,128∣41∣27,646 | 0 | 0∣14∣0 | 14 | 0∣14∣118,879 |
| APPLICATIONS WITHDRAWN | 1 | 147,000∣48∣147,000 | 48 | 147,000∣48∣197,315 | 200 | 150,764∣6∣150,764 | 6 | 150,764∣6∣57,865 | 0 | 0∣5∣0 | 5 | 0∣5∣131,962 |
| FILES CLOSED FOR INCOMPLETENESS | 1 | 108,000∣10∣108,000 | 10 | 108,000∣10∣198,183 | 43 | 158,780∣0∣158,780 | 0 | 158,780∣0∣0 | 0 | 0∣0∣0 | 0 | 0∣0∣0 |
| Aggregated Statistics For Year 2002_(Based on 2 full tracts)_ | ||||||||||
|---|---|---|---|---|---|---|---|---|---|---|
| A) FHA, FSA/RHS & VAHome Purchase Loans | B) ConventionalHome Purchase Loans | C) Refinancings | D) Home Improvement Loans | F) Non-occupant Loans on < 5 Family Dwellings (A B C & D) | ||||||
| Number | Average Value | Number | Average Value | Number | Average Value | Number | Average Value | Number | Average Value | |
| LOANS ORIGINATED | 8 | 92,375∣134∣92,375 | 134 | 92,375∣134∣128,388 | 235 | 114,054∣24∣114,054 | 24 | 114,054∣24∣39,542 | 30 | $86,221 |
| APPLICATIONS APPROVED, NOT ACCEPTED | 0 | 0∣16∣0 | 16 | 0∣16∣87,464 | 50 | 104,328∣8∣104,328 | 8 | 104,328∣8∣29,625 | 4 | $98,462 |
| APPLICATIONS DENIED | 0 | 0∣20∣0 | 20 | 0∣20∣117,049 | 71 | 109,345∣16∣109,345 | 16 | 109,345∣16∣23,384 | 5 | $52,800 |
| APPLICATIONS WITHDRAWN | 1 | 88,000∣10∣88,000 | 10 | 88,000∣10∣133,513 | 65 | 131,571∣2∣131,571 | 2 | 131,571∣2∣20,000 | 2 | $129,000 |
| FILES CLOSED FOR INCOMPLETENESS | 0 | 0∣5∣0 | 5 | 0∣5∣76,600 | 16 | 137,688∣0∣137,688 | 0 | 137,688∣0∣0 | 2 | $74,000 |
| Aggregated Statistics For Year 2001_(Based on 2 full tracts)_ | ||||||||||
|---|---|---|---|---|---|---|---|---|---|---|
| A) FHA, FSA/RHS & VAHome Purchase Loans | B) ConventionalHome Purchase Loans | C) Refinancings | D) Home Improvement Loans | F) Non-occupant Loans on < 5 Family Dwellings (A B C & D) | ||||||
| Number | Average Value | Number | Average Value | Number | Average Value | Number | Average Value | Number | Average Value | |
| LOANS ORIGINATED | 8 | 96,814∣113∣96,814 | 113 | 96,814∣113∣117,438 | 201 | 101,906∣16∣101,906 | 16 | 101,906∣16∣24,000 | 19 | $68,789 |
| APPLICATIONS APPROVED, NOT ACCEPTED | 2 | 80,000∣13∣80,000 | 13 | 80,000∣13∣130,625 | 28 | 79,772∣6∣79,772 | 6 | 79,772∣6∣26,000 | 2 | $166,000 |
| APPLICATIONS DENIED | 2 | 75,500∣29∣75,500 | 29 | 75,500∣29∣130,286 | 88 | 94,246∣18∣94,246 | 18 | 94,246∣18∣37,111 | 6 | $106,000 |
| APPLICATIONS WITHDRAWN | 4 | 94,000∣9∣94,000 | 9 | 94,000∣9∣144,222 | 65 | 94,637∣9∣94,637 | 9 | 94,637∣9∣14,111 | 3 | $56,883 |
| FILES CLOSED FOR INCOMPLETENESS | 0 | 0∣6∣0 | 6 | 0∣6∣153,133 | 14 | 104,229∣3∣104,229 | 3 | 104,229∣3∣22,333 | 0 | $0 |
| Aggregated Statistics For Year 2000_(Based on 2 full tracts)_ | ||||||||||
|---|---|---|---|---|---|---|---|---|---|---|
| A) FHA, FSA/RHS & VAHome Purchase Loans | B) ConventionalHome Purchase Loans | C) Refinancings | D) Home Improvement Loans | F) Non-occupant Loans on < 5 Family Dwellings (A B C & D) | ||||||
| Number | Average Value | Number | Average Value | Number | Average Value | Number | Average Value | Number | Average Value | |
| LOANS ORIGINATED | 27 | 88,169∣114∣88,169 | 114 | 88,169∣114∣97,211 | 49 | 77,898∣18∣77,898 | 18 | 77,898∣18∣31,722 | 11 | $77,704 |
| APPLICATIONS APPROVED, NOT ACCEPTED | 1 | 114,000∣16∣114,000 | 16 | 114,000∣16∣97,710 | 17 | 87,571∣5∣87,571 | 5 | 87,571∣5∣15,800 | 2 | $52,500 |
| APPLICATIONS DENIED | 4 | 91,692∣26∣91,692 | 26 | 91,692∣26∣110,231 | 41 | 67,438∣11∣67,438 | 11 | 67,438∣11∣16,455 | 4 | $82,250 |
| APPLICATIONS WITHDRAWN | 3 | 70,933∣16∣70,933 | 16 | 70,933∣16∣91,574 | 29 | 54,172∣2∣54,172 | 2 | 54,172∣2∣25,000 | 0 | $0 |
| FILES CLOSED FOR INCOMPLETENESS | 2 | 90,500∣2∣90,500 | 2 | 90,500∣2∣110,000 | 9 | 106,111∣1∣106,111 | 1 | 106,111∣1∣25,000 | 0 | $0 |
Detailed HMDA statistics for the following Tracts: 0088.03, 0088.04, 0089.04, 0089.05
| Private Mortgage Insurance Companies Aggregated Statistics For Year 2009_(Based on 3 full tracts)_ | ||||
|---|---|---|---|---|
| A) ConventionalHome Purchase Loans | B) Refinancings | |||
| Number | Average Value | Number | Average Value | |
| LOANS ORIGINATED | 4 | 276,500∣2∣276,500 | 2 | 276,500∣2∣241,615 |
| APPLICATIONS APPROVED, NOT ACCEPTED | 8 | 216,611∣0∣216,611 | 0 | 216,611∣0∣0 |
| APPLICATIONS DENIED | 1 | 204,000∣0∣204,000 | 0 | 204,000∣0∣0 |
| APPLICATIONS WITHDRAWN | 0 | 0∣0∣0 | 0 | 0∣0∣0 |
| FILES CLOSED FOR INCOMPLETENESS | 1 | 149,840∣0∣149,840 | 0 | 149,840∣0∣0 |
| Aggregated Statistics For Year 2008_(Based on 3 full tracts)_ | ||||||
|---|---|---|---|---|---|---|
| A) ConventionalHome Purchase Loans | B) Refinancings | C) Non-occupant Loans on < 5 Family Dwellings (A & B) | ||||
| Number | Average Value | Number | Average Value | Number | Average Value | |
| LOANS ORIGINATED | 31 | 306,071∣11∣306,071 | 11 | 306,071∣11∣257,295 | 0 | $0 |
| APPLICATIONS APPROVED, NOT ACCEPTED | 34 | 315,291∣15∣315,291 | 15 | 315,291∣15∣294,177 | 1 | $201,100 |
| APPLICATIONS DENIED | 10 | 359,205∣1∣359,205 | 1 | 359,205∣1∣144,910 | 3 | $387,000 |
| APPLICATIONS WITHDRAWN | 4 | 292,492∣0∣292,492 | 0 | 292,492∣0∣0 | 0 | $0 |
| FILES CLOSED FOR INCOMPLETENESS | 1 | 404,000∣0∣404,000 | 0 | 404,000∣0∣0 | 0 | $0 |
| Aggregated Statistics For Year 2007_(Based on 3 full tracts)_ | ||||||
|---|---|---|---|---|---|---|
| A) ConventionalHome Purchase Loans | B) Refinancings | C) Non-occupant Loans on < 5 Family Dwellings (A & B) | ||||
| Number | Average Value | Number | Average Value | Number | Average Value | |
| LOANS ORIGINATED | 47 | 287,715∣22∣287,715 | 22 | 287,715∣22∣343,674 | 2 | $293,770 |
| APPLICATIONS APPROVED, NOT ACCEPTED | 8 | 231,835∣1∣231,835 | 1 | 231,835∣1∣437,000 | 2 | $157,040 |
| APPLICATIONS DENIED | 2 | 244,000∣3∣244,000 | 3 | 244,000∣3∣445,377 | 0 | $0 |
| APPLICATIONS WITHDRAWN | 3 | 268,470∣1∣268,470 | 1 | 268,470∣1∣173,000 | 0 | $0 |
| FILES CLOSED FOR INCOMPLETENESS | 0 | 0∣0∣0 | 0 | 0∣0∣0 | 0 | $0 |
| Aggregated Statistics For Year 2006_(Based on 3 full tracts)_ | ||||||
|---|---|---|---|---|---|---|
| A) ConventionalHome Purchase Loans | B) Refinancings | C) Non-occupant Loans on < 5 Family Dwellings (A & B) | ||||
| Number | Average Value | Number | Average Value | Number | Average Value | |
| LOANS ORIGINATED | 62 | 194,222∣12∣194,222 | 12 | 194,222∣12∣278,302 | 16 | $138,730 |
| APPLICATIONS APPROVED, NOT ACCEPTED | 17 | 242,759∣6∣242,759 | 6 | 242,759∣6∣319,958 | 1 | $126,180 |
| APPLICATIONS DENIED | 6 | 133,577∣1∣133,577 | 1 | 133,577∣1∣252,000 | 5 | $124,606 |
| APPLICATIONS WITHDRAWN | 3 | 278,980∣1∣278,980 | 1 | 278,980∣1∣293,000 | 0 | $0 |
| FILES CLOSED FOR INCOMPLETENESS | 2 | 132,105∣0∣132,105 | 0 | 132,105∣0∣0 | 2 | $132,105 |
| Aggregated Statistics For Year 2005_(Based on 4 full tracts)_ | ||||||
|---|---|---|---|---|---|---|
| A) ConventionalHome Purchase Loans | B) Refinancings | C) Non-occupant Loans on < 5 Family Dwellings (A & B) | ||||
| Number | Average Value | Number | Average Value | Number | Average Value | |
| LOANS ORIGINATED | 49 | 218,837∣12∣218,837 | 12 | 218,837∣12∣218,353 | 3 | $243,260 |
| APPLICATIONS APPROVED, NOT ACCEPTED | 10 | 192,644∣4∣192,644 | 4 | 192,644∣4∣215,768 | 1 | $122,000 |
| APPLICATIONS DENIED | 0 | 0∣0∣0 | 0 | 0∣0∣0 | 0 | $0 |
| APPLICATIONS WITHDRAWN | 2 | 279,500∣2∣279,500 | 2 | 279,500∣2∣218,000 | 0 | $0 |
| FILES CLOSED FOR INCOMPLETENESS | 1 | 120,000∣0∣120,000 | 0 | 120,000∣0∣0 | 0 | $0 |
| Aggregated Statistics For Year 2004_(Based on 4 full tracts)_ | ||||||
|---|---|---|---|---|---|---|
| A) ConventionalHome Purchase Loans | B) Refinancings | C) Non-occupant Loans on < 5 Family Dwellings (A & B) | ||||
| Number | Average Value | Number | Average Value | Number | Average Value | |
| LOANS ORIGINATED | 84 | 205,657∣22∣205,657 | 22 | 205,657∣22∣176,000 | 4 | $213,362 |
| APPLICATIONS APPROVED, NOT ACCEPTED | 20 | 223,018∣10∣223,018 | 10 | 223,018∣10∣192,328 | 3 | $280,447 |
| APPLICATIONS DENIED | 2 | 247,000∣2∣247,000 | 2 | 247,000∣2∣279,000 | 2 | $196,500 |
| APPLICATIONS WITHDRAWN | 3 | 219,000∣3∣219,000 | 3 | 219,000∣3∣106,333 | 1 | $380,000 |
| FILES CLOSED FOR INCOMPLETENESS | 1 | 118,000∣0∣118,000 | 0 | 118,000∣0∣0 | 0 | $0 |
| Aggregated Statistics For Year 2003_(Based on 4 full tracts)_ | ||||||
|---|---|---|---|---|---|---|
| A) ConventionalHome Purchase Loans | B) Refinancings | C) Non-occupant Loans on < 5 Family Dwellings (A & B) | ||||
| Number | Average Value | Number | Average Value | Number | Average Value | |
| LOANS ORIGINATED | 113 | 191,246∣50∣191,246 | 50 | 191,246∣50∣173,959 | 6 | $151,000 |
| APPLICATIONS APPROVED, NOT ACCEPTED | 19 | 175,008∣17∣175,008 | 17 | 175,008∣17∣144,731 | 0 | $0 |
| APPLICATIONS DENIED | 3 | 145,213∣5∣145,213 | 5 | 145,213∣5∣146,600 | 2 | $153,500 |
| APPLICATIONS WITHDRAWN | 10 | 213,224∣4∣213,224 | 4 | 213,224∣4∣132,000 | 3 | $184,333 |
| FILES CLOSED FOR INCOMPLETENESS | 1 | 88,000∣0∣88,000 | 0 | 88,000∣0∣0 | 0 | $0 |
| Aggregated Statistics For Year 2002_(Based on 2 full tracts)_ | ||||||
|---|---|---|---|---|---|---|
| A) ConventionalHome Purchase Loans | B) Refinancings | C) Non-occupant Loans on < 5 Family Dwellings (A & B) | ||||
| Number | Average Value | Number | Average Value | Number | Average Value | |
| LOANS ORIGINATED | 56 | 139,579∣15∣139,579 | 15 | 139,579∣15∣147,067 | 1 | $96,000 |
| APPLICATIONS APPROVED, NOT ACCEPTED | 10 | 111,700∣10∣111,700 | 10 | 111,700∣10∣148,400 | 0 | $0 |
| APPLICATIONS DENIED | 0 | 0∣0∣0 | 0 | 0∣0∣0 | 0 | $0 |
| APPLICATIONS WITHDRAWN | 6 | 103,500∣0∣103,500 | 0 | 103,500∣0∣0 | 0 | $0 |
| FILES CLOSED FOR INCOMPLETENESS | 1 | 134,000∣0∣134,000 | 0 | 134,000∣0∣0 | 0 | $0 |
| Aggregated Statistics For Year 2001_(Based on 2 full tracts)_ | ||||||
|---|---|---|---|---|---|---|
| A) ConventionalHome Purchase Loans | B) Refinancings | C) Non-occupant Loans on < 5 Family Dwellings (A & B) | ||||
| Number | Average Value | Number | Average Value | Number | Average Value | |
| LOANS ORIGINATED | 44 | 131,338∣21∣131,338 | 21 | 131,338∣21∣132,286 | 1 | $105,000 |
| APPLICATIONS APPROVED, NOT ACCEPTED | 11 | 113,985∣4∣113,985 | 4 | 113,985∣4∣115,000 | 0 | $0 |
| APPLICATIONS DENIED | 2 | 121,500∣3∣121,500 | 3 | 121,500∣3∣132,333 | 0 | $0 |
| APPLICATIONS WITHDRAWN | 4 | 110,000∣3∣110,000 | 3 | 110,000∣3∣106,000 | 1 | $176,000 |
| FILES CLOSED FOR INCOMPLETENESS | 0 | 0∣0∣0 | 0 | 0∣0∣0 | 0 | $0 |
| Aggregated Statistics For Year 2000_(Based on 1 full tract)_ | ||||||
|---|---|---|---|---|---|---|
| A) ConventionalHome Purchase Loans | B) Refinancings | C) Non-occupant Loans on < 5 Family Dwellings (A & B) | ||||
| Number | Average Value | Number | Average Value | Number | Average Value | |
| LOANS ORIGINATED | 43 | 119,349∣5∣119,349 | 5 | 119,349∣5∣132,400 | 1 | $65,000 |
| APPLICATIONS APPROVED, NOT ACCEPTED | 7 | 104,714∣1∣104,714 | 1 | 104,714∣1∣179,000 | 0 | $0 |
| APPLICATIONS DENIED | 2 | 150,500∣3∣150,500 | 3 | 150,500∣3∣98,333 | 0 | $0 |
| APPLICATIONS WITHDRAWN | 2 | 107,500∣1∣107,500 | 1 | 107,500∣1∣79,000 | 0 | $0 |
| FILES CLOSED FOR INCOMPLETENESS | 0 | 0∣0∣0 | 0 | 0∣0∣0 | 0 | $0 |
Detailed PMIC statistics for the following Tracts: 0088.03, 0088.04, 0089.04, 0089.05
Fire-safe hotels and motels in University Park, Florida:
- Comfort Suites, 8305 Tourist Center Dr, University Park, Florida 34201 , Phone: (941) 360-2626, Fax: (941) 360-1876
- Hampton Inn & Suites Sarasota/University Park, 8565 Cooper Creek Blvd, University Park, Florida 34201 , Phone: (941) 355-8619, Fax: (941) 355-8637 All 2 fire-safe hotels and motels in University Park, Florida
University Park compared to Florida state average:
- Black race population percentage significantly below state average.
- Hispanic race population percentage significantly above state average.
- Foreign-born population percentage significantly above state average.
- Length of stay since moving in significantly above state average.
- House age significantly below state average.
- Number of college students above state average.
University Park on our top lists:
- #9 on the list of "Top 101 cities with the most residents born in Caribbean (population 500+)"
- #9 on the list of "Top 101 cities with the most residents born in Cuba (population 500+)"
- #22 on the list of "Top 101 cities with the most residents born in Nicaragua (population 500+)"
- #28 on the list of "Top 101 cities with the most residents born in Americas (population 500+)"
- #28 on the list of "Top 101 cities with the most residents born in Latin America (population 500+)"
- #33 on the list of "Top 100 cities with highest percentage of foreign-born residents"
- #58 on the list of "Top 101 cities with largest percentage of females in industries: wholesale trade (population 5,000+)"
- #65 on the list of "Top 101 cities with the lowest percentage of English-only speaking households, population 5,000+"
- #76 on the list of "Top 101 cities with largest percentage of males in industries: wholesale trade (population 5,000+)"
- #82 on the list of "Top 101 cities with the most residents born in Argentina (population 500+)"
- #66 (33165) on the list of "Top 101 zip codes with the largest percentage of taxpayers reporting profit/loss from business in 2012 (pop 5,000+)"
- #2 on the list of "Top 101 counties with the highest ground withdrawal of fresh water for public supply"
- #8 on the list of "Top 101 counties with the most Evangelical Protestant congregations"
- #9 on the list of "Top 101 counties with the most Black Protestant adherents"
- #11 on the list of "Top 101 counties with the highest total withdrawal of fresh water for public supply (pop. 50,000+)"
- #12 on the list of "Top 101 counties with the most Evangelical Protestant adherents (pop. 50,000+)"
There are 4 pilots and no other airmen in this city.

Top Patent Applicants
| Zbigniew R. Paul (3) Benjamin King (2) Zbigniew Robert Paul (2) Carl Cannova (1) Carl S. Cannova (1) | Daniel D. Kilker (1) John Hughes (1) Patrick C. O'Connor (1) Richard L. Mason (1) Steven Parkinson (1) |
|---|
Total of 13 patent applications in 2008-2024.