Phase Diagrams and Solidification (original) (raw)
Phase diagrams are a useful tool in metallurgy and other branches of materials science. They show the mixture of phases present in thermodynamic equilibrium. This teaching and learning package looks at the theory behind phase diagrams, and ways of constructing them, before running through an experimental procedure, and presenting the results which can be obtained.
- Aims
- Introduction
- Thermodynamics: Basic terms
- Free energy curves
- Phase diagrams 1
- Phase diagrams 2 - eutectic reactions
- Phase diagrams 3 - peritectic reactions
- The Gibbs phase rule
- Interpretation of cooling curves
- Experiment and results
- The lever rule
- Modern uses
- Further considerations
- Summary
- Questions
- Going further
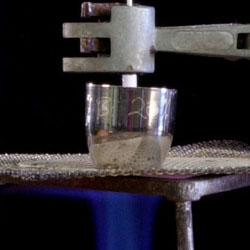
Photograph of Bunsen flame heating a crucible
First created: April 2004. Last updated: September 2023.
The interactive simulations and animations are best viewed on a desktop or notebook
with Firefox, Chrome or Safari browser. They may be slow on tablets and phones.