What Does Multiple Regression Look Like? (Part 2) (original) (raw)
What Does Multiple Linear Regression Look Like? (Part 2)
This note considers the case of multiple linear regression with two predictors, where one of the predictors is an indicator variable. It will be coded 0/1 here, but these results do not depend on the the two values used. Here, men and women are placed on a treadmill. When they can no longer continue, duration (DUR) and maximum oxygen usage (VO2max) are recorded. The purpose of this analysis is to predict VO2max from sex (M0F1 = 0 for males, 1 for females) and DUR. When the model
VO2max =  0+
0+  1 DUR +
  2 M0F1 +
is fitted to the data, the result is
VO2max = 1.3138 + 0.0606 DUR - 3.4623 M0F1
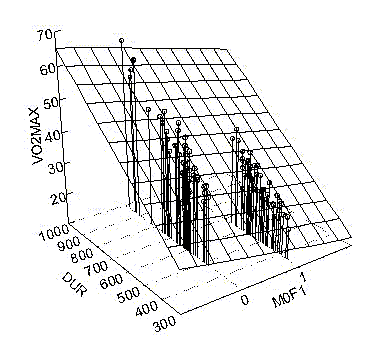
 When the data are plotted in three dimensions, it is seen that they lie along two slices--one slice for each of the two values of M0F1. The regression surface is once again a flat plane. This follows from our choice of a model.
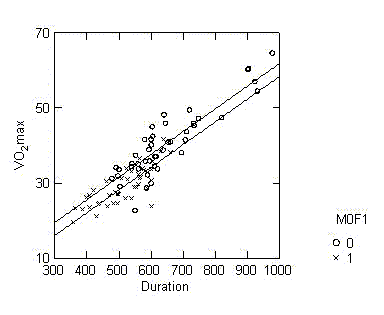
 The data in each slice can be plotted as VO2max against DUR and the two plots can be superimposed. The two lines are the pieces of the plane corresponding to M0F1=0 and M0F1=1. The lines are parallel because they are parallel strips from the same flat plane. This also follow directly from the model. The fitted equation can be rewritten conditional on the two values of M0F1. When M0F1=0, the model is
YO2MAX = 1.3138 + 0.0606 DUR - 3.4623 * 0, or
YO2MAX = 1.3138 + 0.0606 DUR
When M0F1=1, the model is
YO2MAX = 1.3138 + 0.0606 DUR - 3.4623 * 1, or
YO2MAX = -2.1485 + 0.0606 DUR.
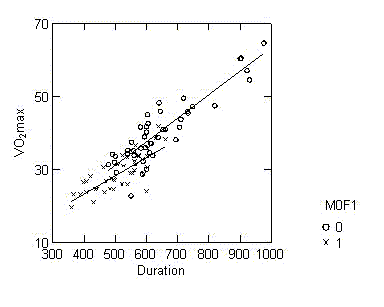
 A more complicated model can be fitted that does not force the lines to be parallel. This is discussed in the note on interactions. Those lines are fitted in the picture to the left. The test for whether the lines are parallel has an observed significance level of 0.102. Thus, the regression coefficients are within sampling variability of each other and the lines are within sampling variability of what one would expect of parallel lines. In general, we like simpler models (in keeping with Occam's Razor: Use the simplest model that is consistent with the data.) because they are more easily described. The parallel slopes model says that men are expected to have a VO2max 3.4623 units higher than women who last on the treadmill for the same DURation. When the lines are not parallel, the expected difference in VO2max between a male and female with the same DURation depends on the value of DURation. In the picture to the left, the expected difference in VO2max increases with DURation. However, as already noted, there is not enough evidence to claim that this change in difference is real.
Copyright © 2001 Gerard E. Dallal