Tissue-resident macrophages originate from yolk sac-derived erythro-myeloid progenitors (original) (raw)
. Author manuscript; available in PMC: 2018 Jun 12.
Published in final edited form as: Nature. 2014 Dec 3;518(7540):547–551. doi: 10.1038/nature13989
Introductory paragraph
Most haematopoietic cells renew from adult hematopoietic stem cells (HSC)1–3, however, macrophages in adult tissues can self-maintain independently of HSC4–7. Progenitors with macrophage potential in vitro have been described in the yolk sac before emergence of HSC8–13, and fetal macrophages13–15 can develop independently of Myb4, a transcription factor required for HSC16, and can persist in adult tissues4,17,18. Nevertheless, the origin of adult macrophages and the qualitative and quantitative contributions of HSC and putative non-HSC progenitors are still unclear19. Here we show that the vast majority of adult tissue-resident macrophages in liver (Kupffer cells), brain (microglia), epidermis (Langerhans cells), and lung (alveolar macrophages) originate from a Tie2+ cellular pathway generating Csf1r+ erythro-myeloid progenitors (EMP) distinct from HSC. EMP develop in the yolk sac at embryonic day (E) 8.5, migrate and colonise the nascent fetal liver before E10.5, and give rise to fetal erythrocytes, macrophages, granulocytes and monocytes until at least E16.5. Subsequently, HSC-derived cells replace erythrocytes, granulocytes and monocytes, whereas Kupffer cells, microglia, and Langerhans cells are not replaced in 1-year old animals, while alveolar macrophages may be progressively replaced in aging mice. Our fate mapping experiments identify, in the fetal liver, a sequence of yolk sac EMP-derived, followed by HSC-derived haematopoiesis, and identify yolk sac EMP as a common origin for tissue macrophages.
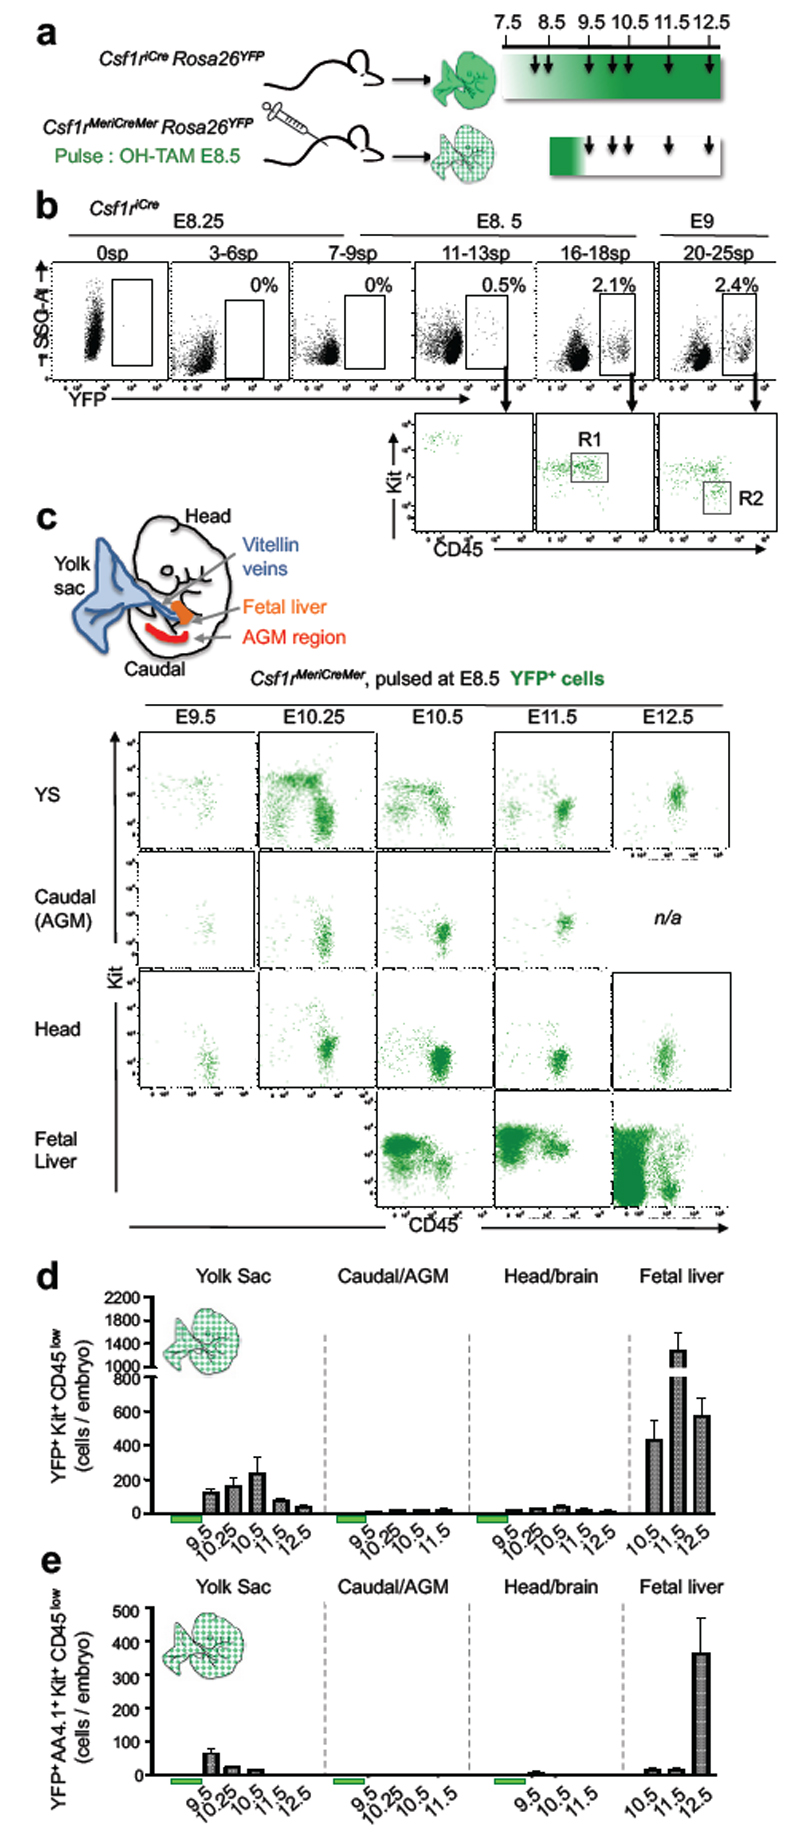
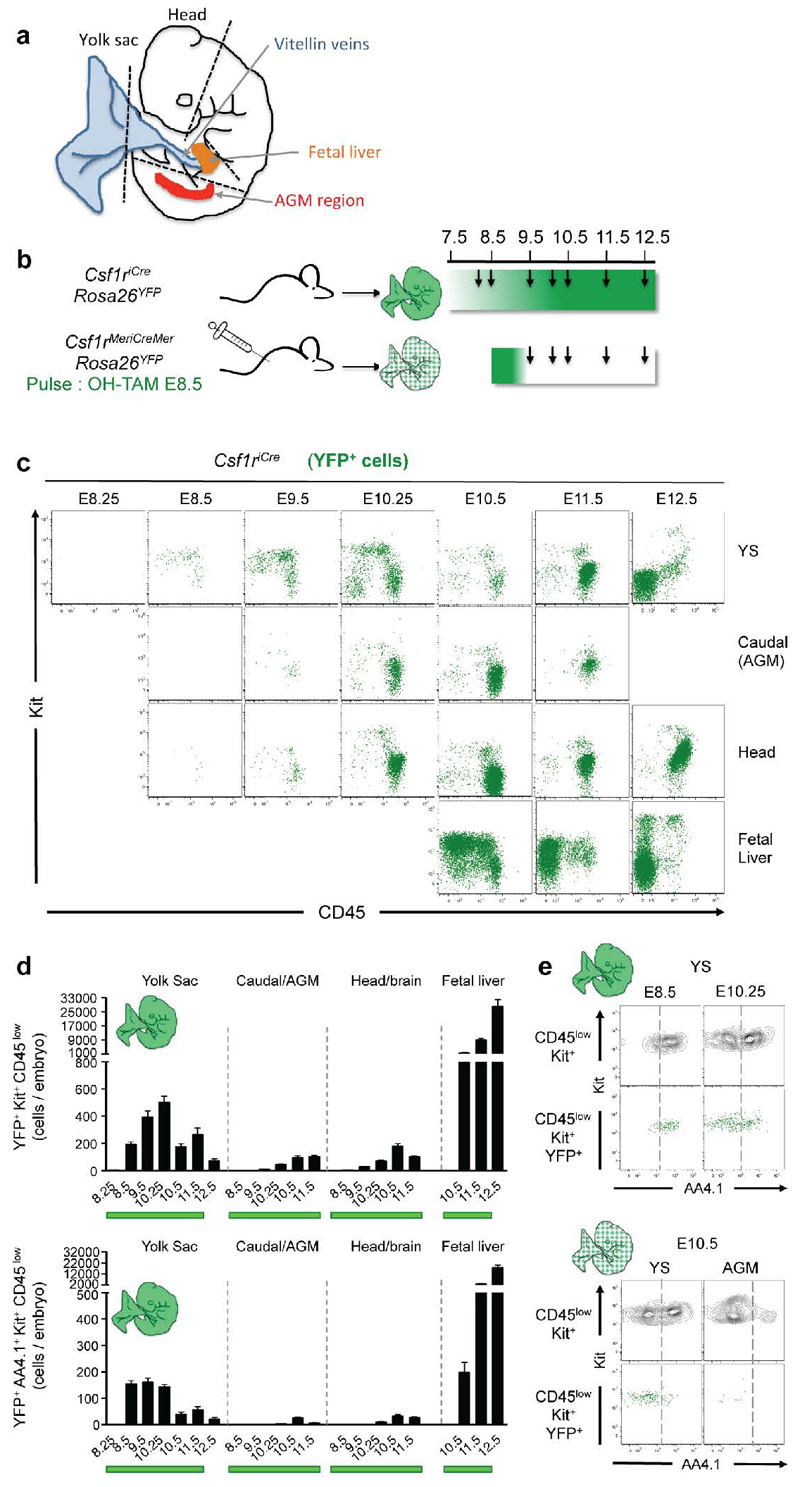
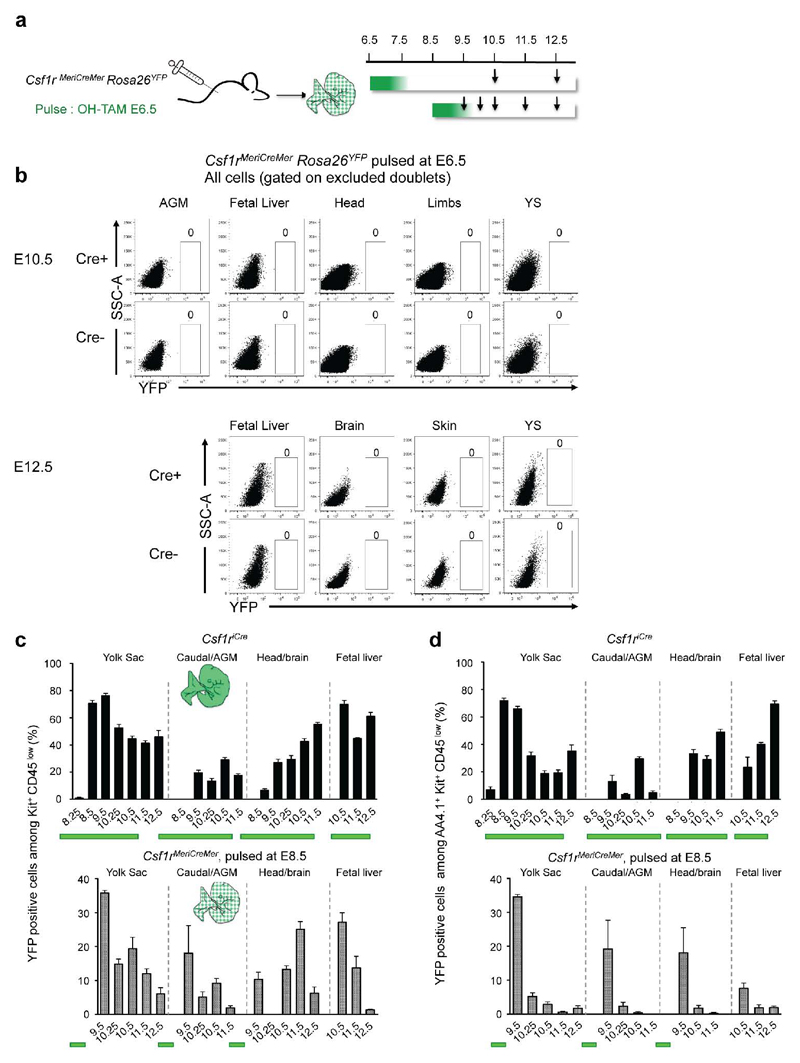
_Csf1r_-expressing cells in the mouse embryo give rise to tissue-resident macrophages in adult tissues4. To identify in the developing embryo the site of origin of _Csf1r_-expressing cells, we performed time course analyses by constitutive (Csf1riCre) and inducible (Csf1rMeriCreMer) fate mapping of cells in yolk sac (YS), head, limbs, caudal region and fetal liver (FL) (Fig. 1a). Progenitors, defined as Kit+ CD45low 12 (gate R1 in Fig. 1b), were first detected in Csf1riCre Rosa26YFP embryos in the YS from 16-18 somite pairs (sp) stage onwards (E8.5, Fig. 1b, and Extended Data Fig. 1a-c). Csf1riCre YFP+ Kit- CD45+ cells (gate R2 in Fig. 1b), characterised in Fig. 2 as myeloid cells, were detected in the YS at 20-25 sp (E9, Fig. 1b), and subsequently in the caudal and head regions of the embryo from E9.5, and the fetal liver from E10.5 onwards (Extended Data Fig. 1a-d). To discriminate migration of YFP+ cells from de novo labelling, we induced YFP expression in Csf1rMeriCreMer Rosa26YFP embryos at E6.5 or E8.5. In embryos pulsed at E6.5, YFP+ cells were not detected (Extended Data Fig. 2a, b). When pulsed at E8.5, Csf1rMeriCreMer YFP+ Kit+ CD45low progenitors were detected between E9.5-11.5 in the YS, and in the fetal liver from E10.5 (Fig. 1 c, d). In the fetal liver, numbers of YFP+ Kit+ CD45low progenitors increased 3-fold from E10.5 to E11.5, at which time they were 25-fold more numerous in the fetal liver than in the YS (Fig. 1d). At E8.5 all YS Csf1riCre YFP+ Kit+ CD45low progenitors expressed AA4.1, an antigen expressed on early hematopoietic progenitors12 (Extended Data Fig. 1e). Csf1rMeriCreMer YFP+ AA4.1+ Kit+ CD45low cells were also present in the YS from E9.5 to E10.5, and in the fetal liver from E10.5 (Fig. 1e). These progenitors were undetectable at E10.5 in the aorta-gonad-mesonephros (AGM) region (Fig. 1e), indicating they do not originate within the embryo proper.
Figure 1. E8.5 Csf1r+ progenitors originate in the yolk sac and expand in the fetal liver.
a, Fate-mapping analysis of _Csf1r_-expressing cells. Arrows indicate time points for analysis, and green shades the genetic labelling period. b, YFP expression on live cells from Csf1riCre Rosa26YFP yolk sac (YS), separated by somite pairs between E8.25 and E9 (0sp, n=3; 3/6sp, n=3; 7-9sp, n=5; 11-13sp, n=3; 16-18sp, n=4; 20-25sp, n=4) (upper panels), and Kit and CD45 expression on YFP+ cells (lower panels). R1 indicates Kit+ CD45low, and R2 indicates Kit- CD45+ cells. c, Schematic representation of sites analysed in mouse embryos: YS, AGM region, fetal liver and head. Kit and CD45 phenotype of YFP+ cells from Csf1rMeriCreMer Rosa26YFP embryos pulsed with OH-TAM at E8.5 (E9.5, n=3; E10.25, n=3; E10.5, n=4; E11.25, n=4; E12.5, n=9). d, Number of YFP+ Kit+ CD45low cells (R1 in panel b) per organ or region (mean ± s.e.m.) in Csf1rMeriCreMer Rosa26YFP embryos pulsed at E8.5. e, Number of YFP+ AA4.1+ Kit+ CD45low cells per embryonic region and time points (mean ± s.e.m.) in Csf1rMeriCreMer Rosa26YFP embryos pulsed at E8.5. See also Supplementary Table 1 and Extended Data Figs. 1 and 2.
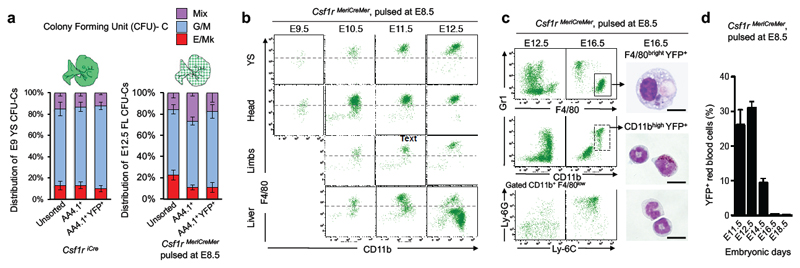
Figure 2. E8.5 Csf1r+ progenitors differentiate into myeloid cells and red blood cells in the fetal liver.
a, Distribution of mixed (Mix), G/M, and E/Mk CFU-C from unsorted, AA4.1+ Kit+ CD45low and YFP+ AA4.1+ Kit+ CD45low cells from E9 YS from Csf1riCre Rosa26YFP and E12.5 fetal liver from Csf1rMeriCreMer Rosa26YFP embryos pulsed with OH-TAM at E8.5 (three independent experiments each). CFU-erythroid and/or megakaryocyte (E/Mk); CFU-granulocyte and/or monocyte/macrophage (G/M); CFU-mix, at least three of the following: G, E, M and Mk. See also Extended Data Fig. 3. b, F4/80 and CD11b expression on YFP+ CD45+ from YS, head (brain for E11.5), limbs and liver of Csf1rMeriCreMer Rosa26YFP embryos pulsed with OH-TAM at E8.5 and analysed on E9.5 (n=3), E10.5 (n=4), E11.5 (n=4), and E12.5 (n=9); Dashed lines represent FMO (fluorescence minus one) control. See also Extended Data Fig. 4. c, F4/80, CD11b, Gr1, Ly-6G and Ly-6C expression in fetal liver CD45+ YFP+ cells from Csf1rMeriCreMer Rosa26YFP embryos pulse-labelled at E8.5, and analysed on E12.5 (n=9) and E16.5 (n=14). May-Grünwald-Giemsa stained cytospin preparations of fetal liver YFP+ F4/80bright and YFP+ CD11bhigh cells sorted from E16.5 Csf1rMeriCreMer Rosa26YFP embryos pulsed with OH-TAM at E8.5. See also Extended Data Fig. 6a for sorted cells from E14.5 Csf1rMeriCreMer embryos. Scale bar, 10μm. d, YFP labelling efficiency (%) among red blood cells in fetal liver from Csf1rMeriCreMer Rosa26YFP embryos pulsed with OH-TAM at E8.5, mean ± s.e.m. (E11.5, n=4; E12.5, n=9; E14.5, n=5; E16.5, n=11; E18.5, n=4).
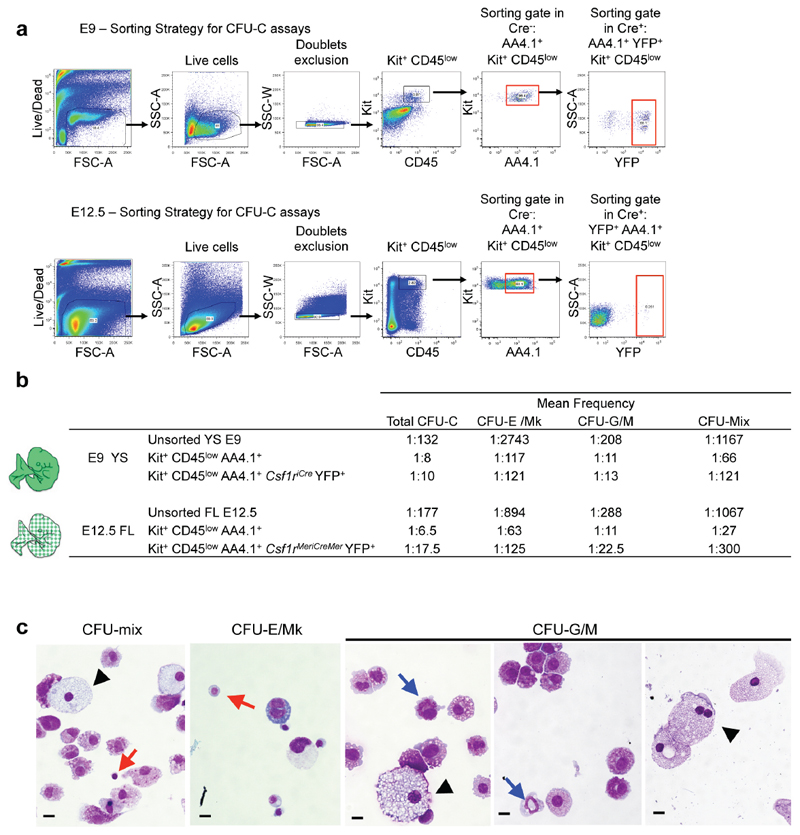
Together, these fate-mapping experiments demonstrate that YS-derived progenitors colonise the liver primordium, as proposed earlier8,20,21, and their expression of AA4.1 suggests that they represent erythro-myeloid progenitors (EMP)12. In in vitro colony forming assays, the AA4.1+ population contained most of the total E9 YS colony forming units-culture (CFU-C, 266±137 vs 296±75, mean ± standard deviation). Frequencies and distributions of different CFU-C, i.e. erythroid (E) / megakaryocyte (Mk) (E/Mk), granulocyte / macrophage (G/M), and G, M, E, and/or Mk (Mix) potential, were comparable between overall AA4.1+ and Csf1riCre YFP+ AA4.1+ progenitors (Fig. 2a, Extended Data Fig. 3). Moreover, in the E12.5 fetal liver, the CFU potential of overall AA4.1+ and Csf1rMeriCreMer YFP+ AA4.1+ cells was comparable to the yolk sac progenitors (Fig. 2a).
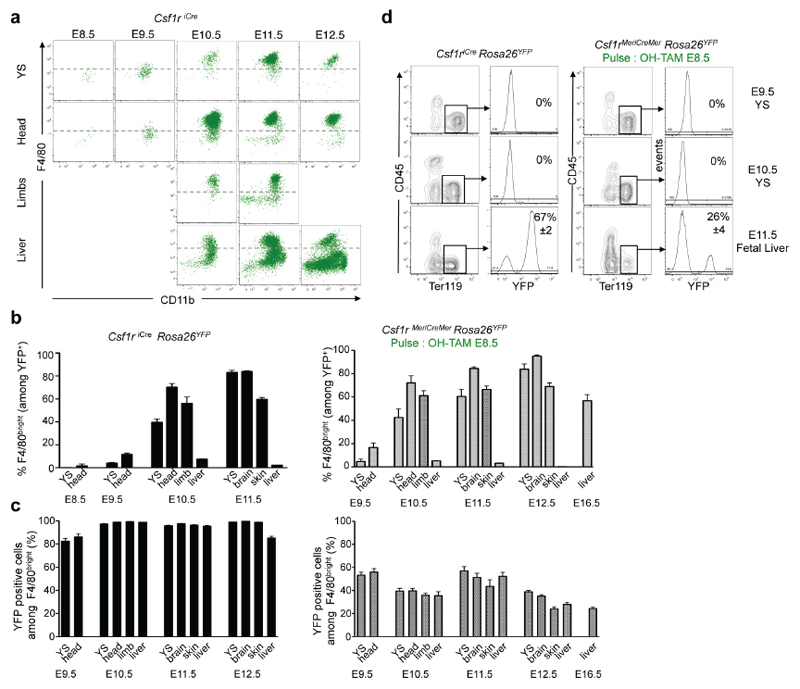
These results indicated that yolk-sac-derived, E8.5-labelled YFP+ AA4.1+ Kit+ CD45lo progenitors have erythroid and myeloid potential in yolk sac and fetal liver. Next, we investigated by fate-mapping their contribution to fetal liver haematopoiesis in vivo. Csf1riCre YFP+ and Csf1rMeriCreMer YFP+ F4/80bright fetal macrophages were first detected among Kit- CD45+ (R2 in Fig 1b) at E10.5 in the yolk sac, liver, head and forelimbs (Fig. 2b, Extended Data Fig. 4a-c). In addition, the fetal liver from E12.5 to E16.5 contained Csf1rMeriCreMer YFP+ monocytes and granulocytes (Fig. 2c). The fetal liver also contained Csf1rMeriCreMer YFP+ red blood cells from E11.5 until at least E14.5 (Fig. 2d, Extended Data Fig. 4d). Red blood cells were not labelled before E11.5, indicating that, in contrast to yolk-sac-derived erythrocytes in the fetal liver, primitive erythrocytes in the yolk sac did not arise from _Csf1r_-expressing cells. Collectively, yolk-sac -derived Csf1r+ progenitors contribute to fetal liver haematopoiesis by giving rise to F4/80bright macrophages, monocytes, granulocytes and red blood cells.
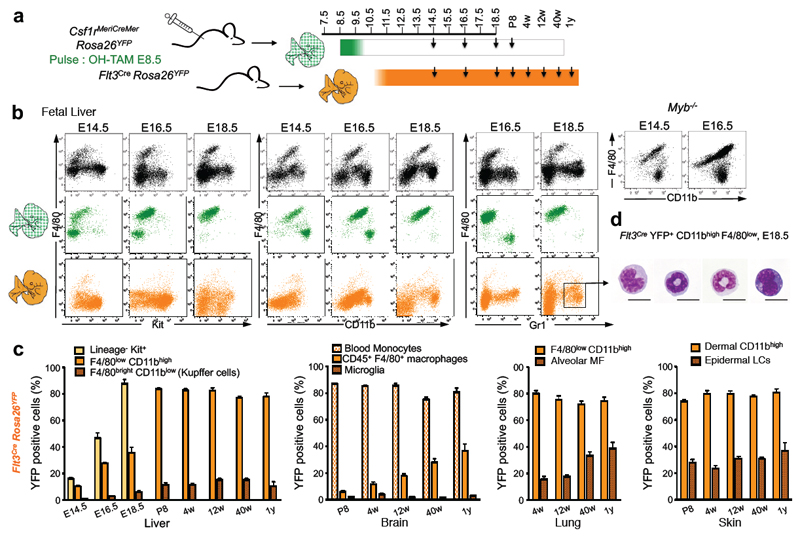
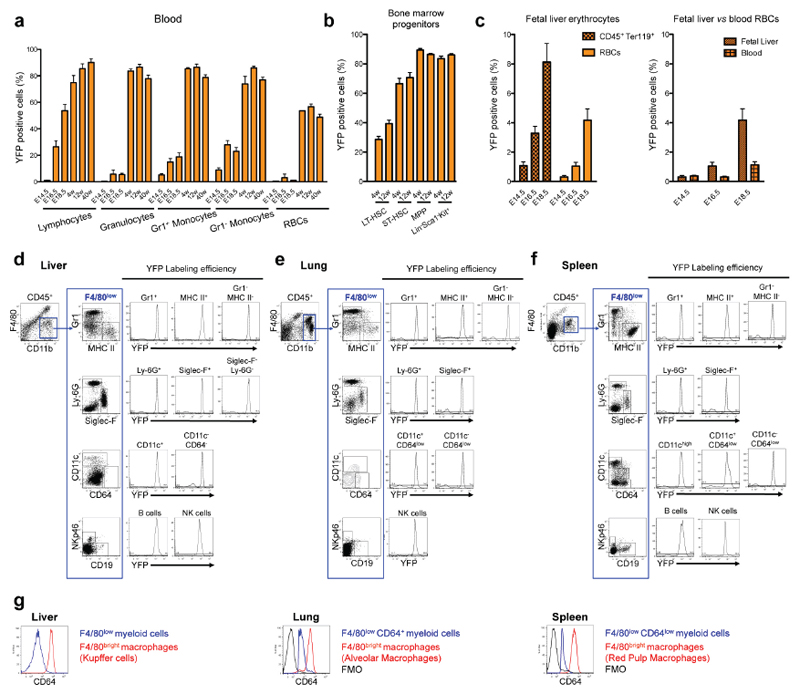
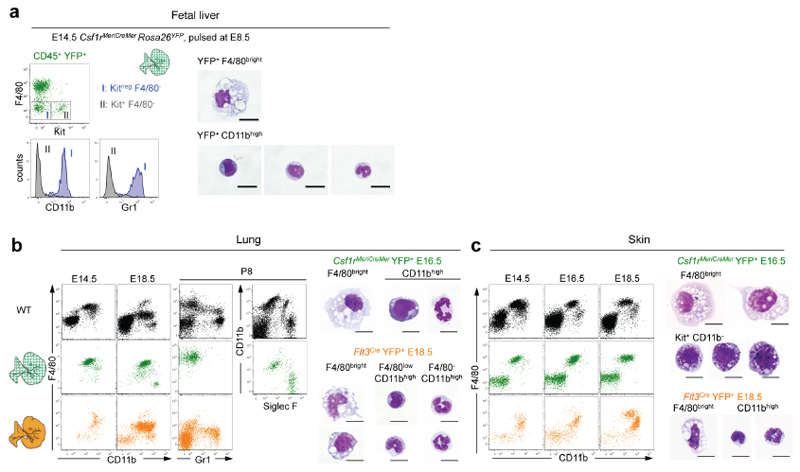
We next investigated the transition from yolk-sac-derived to HSC-derived haematopoiesis. To trace the latter, we used Flt3Cre which labels fetal and adult HSC-derived multipotent hematopoietic progenitors 22, and their progeny (Extended Data Fig. 5). We compared progeny of yolk-sac-derived progenitors in Csf1rMeriCreMer mice to progeny of HSC in Flt3Cre mice. In the fetal liver from E14.5 to E18.5, the progenies of Csf1r+ and Flt3+ precursors were distinct but complemented each other (Fig. 3a, b). At E14.5, YS-derived CD45+ populations included Kit+ progenitors, F4/80bright macrophages, and CD11bhigh Gr1+ monocytes/granulocytes (Fig. 3b, Extended Data Fig. 6a). Of note, monocytes/granulocytes were present in _Myb_-deficient fetal liver (Fig. 3a). Csf1rMeriCreMer YFP+ macrophages remained detectable throughout fetal development, and were not replaced by Flt3Cre YFP+ cells. However, yolk-sac-derived Kit+ cells and myeloid cells were no longer detectable by E16.5 and E18.5, respectively (Fig. 3a). In contrast, Flt3Cre YFP+ Kit+ cells, and CD11bhigh Gr1+ granulocytes/ monocytes increased in numbers between E14.5 and E18.5 (Fig. 3a-c). The progenies of Csf1r+ progenitors and Flt3+ progenitors also complemented each other during development in the lung and skin (Extended Data Fig. 6 b, c). Quantitative analyses in fetal and adult tissues indicated that Flt3Cre YFP labelling of Kit+ progenitors preceded that of monocytes/granulocytes, with 80% of progenitors labelled at E18.5, and 80% of monocytes at postnatal day 8 (P8) (Fig. 3b). In contrast, Flt3Cre YFP labelling plateaued at 14% for adult liver F4/80bright Kupffer cells, at 2% for CD45low brain microglia, and 30% for epidermal Langerhans cells up to 1 year of life (Fig. 3b). In contrast, Flt3Cre YFP labelling of CD45+ F4/80+ brain macrophages, and lung alveolar macrophages was 16 % in 12-week-old adults but increased progressively over time to reach 40% in 1 year-old mice (Fig. 3b).
Figure 3. Fetal liver HSC-derived Flt3+ progenitors give rise to monocytes and granulocytes in late embryos and adults but do not replace YS-derived macrophages.
a, F4/80, Kit, CD11b and Gr1 expression on total CD45+ cells (black) and YFP+ CD45+ cells from Csf1rMeriCreMer Rosa26YFP embryos pulsed at E8.5 (green) in the FL at the indicated days of embryonic development (E14.5, n=5; E16.5, n= 10; E18.5, n=9). F4/80, Kit, CD11b and Gr1 expression on YFP+ CD45+ cells from Flt3Cre Rosa26YFP embryos (orange) (E14.5, n=7; E16.5, n=6; E18.5, n=6). F4/80 and CD11b expression on CD45+ cells in Myb-/- embryos (E14.5, n=4; E16.5, n= 7). b, YFP labelling efficiency in Kit+ lin- cells, CD11bhigh F4/80low cells (characterised in Extended Data Fig. 5) and F4/80bright macrophages (Kupffer cells in adults) in fetal and adult Flt3Cre Rosa26YFP liver (first panel on the left). YFP labelling efficiency in blood monocytes, brain microglia (CD45low F4/80+) and CD45+ F4/80+ brain macrophages in Flt3Cre Rosa26YFP pups and mice (second panel). YFP labelling efficiency in alveolar macrophages (F4/80bright Siglec-F+ CD11b-) and F4/80low CD11bhigh myeloid cells in Flt3Cre Rosa26YFP lungs (third panel). YFP labelling efficiency in epidermal Langerhans cells (LCs) and dermal CD11bhigh (MHC II+ EpCAM-) myeloid cells in Flt3Cre Rosa26YFP skin (fourth panel). See Extended Data Fig. 6b and c. Mean ± s.e.m.; P8, n=3; 4-week-old, n=6; 12-week-old, n=11-14; 40-week-old, n=7; 1-year-old, n=3).w, week; y, year. c, Representative images of May-Grünwald-Giemsa stained cytospin preparations of YFP+ CD11bhigh F4/80low cells sorted from E18.5 Flt3Cre Rosa26YFP fetal liver. Scale bar, 10μm.
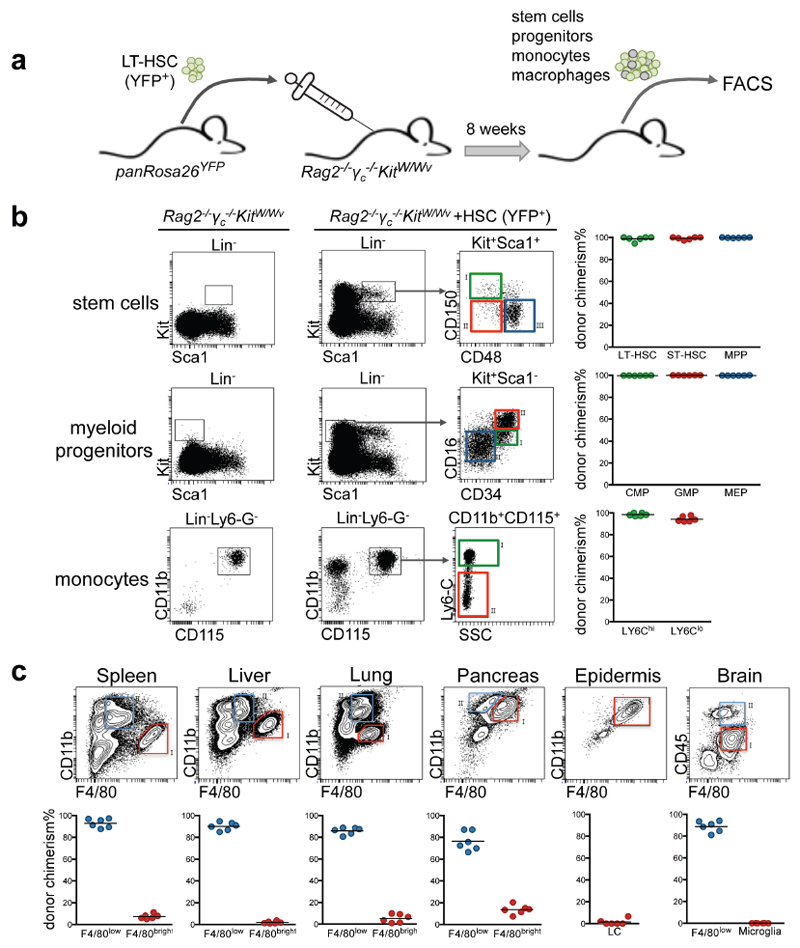
Altogether, these data indicate that Flt3Cre YFP+ Kit+ progenitors and monocytes account for only a minor fraction of microglia, Kupffer cells, alveolar macrophages and Langerhans cells in young adults. To investigate whether the presence of these adult Flt3Cre YFP+ F4/80bright macrophages corresponds to their HSC origin, we performed non-myeloablative transplantations of YFP+ long term-HSC (LT-HSC) from adult bone marrow into Rag2-/-γc-/-KitW/Wv recipients23 (Extended Data Fig. 7). Eight weeks after transplantation, the vast majority of HSC, myeloid progenitors, monocytes, and F4/80low tissue myeloid cells in the recipients were of donor HSC origin. In contrast, only 7% of F4/80bright macrophages in spleen, 2% in liver, 5% in lung, 13% in pancreas, 2% in epidermis, and 0% in the brain were donor-derived. Thus, recruitment of HSC-derived precursors is not a major mechanism for the maintenance of F4/80bright macrophages in these tissues.
Collectively, these findings reveal that the transition from yolk-sac- to HSC-derived haematopoiesis occurs late in fetal development for monocytes (E14.5) and granulocytes (E16.5), and suggest that HSC-derived progenitors only marginally replace yolk-sac-derived microglia in the brain, Kupffer cells in the liver, Langerhans cells in the epidermis, although alveolar macrophages and brain CD45+ F4/80+ macrophages may undergo progressive replacement with age.
Labelling efficiency of most tissue-resident macrophage populations in adult Csf1rMeriCreMer Rosa26YFP mice pulse-labelled with 4-hydroxytamoxifen (OH-TAM) at E8.5 was low4,24. The strength of most genetic pulse-labelling systems is that they allow fate-mapping of cells during a specific time window, however, a weakness is the commonly incomplete labelling which could explain why a large fraction of tissue-resident macrophages remained unlabelled. Hence, based on these data we cannot formally exclude a fetal HSC origin of the unlabelled cells as suggested by others based on transfer of fetal precursors 24–26.
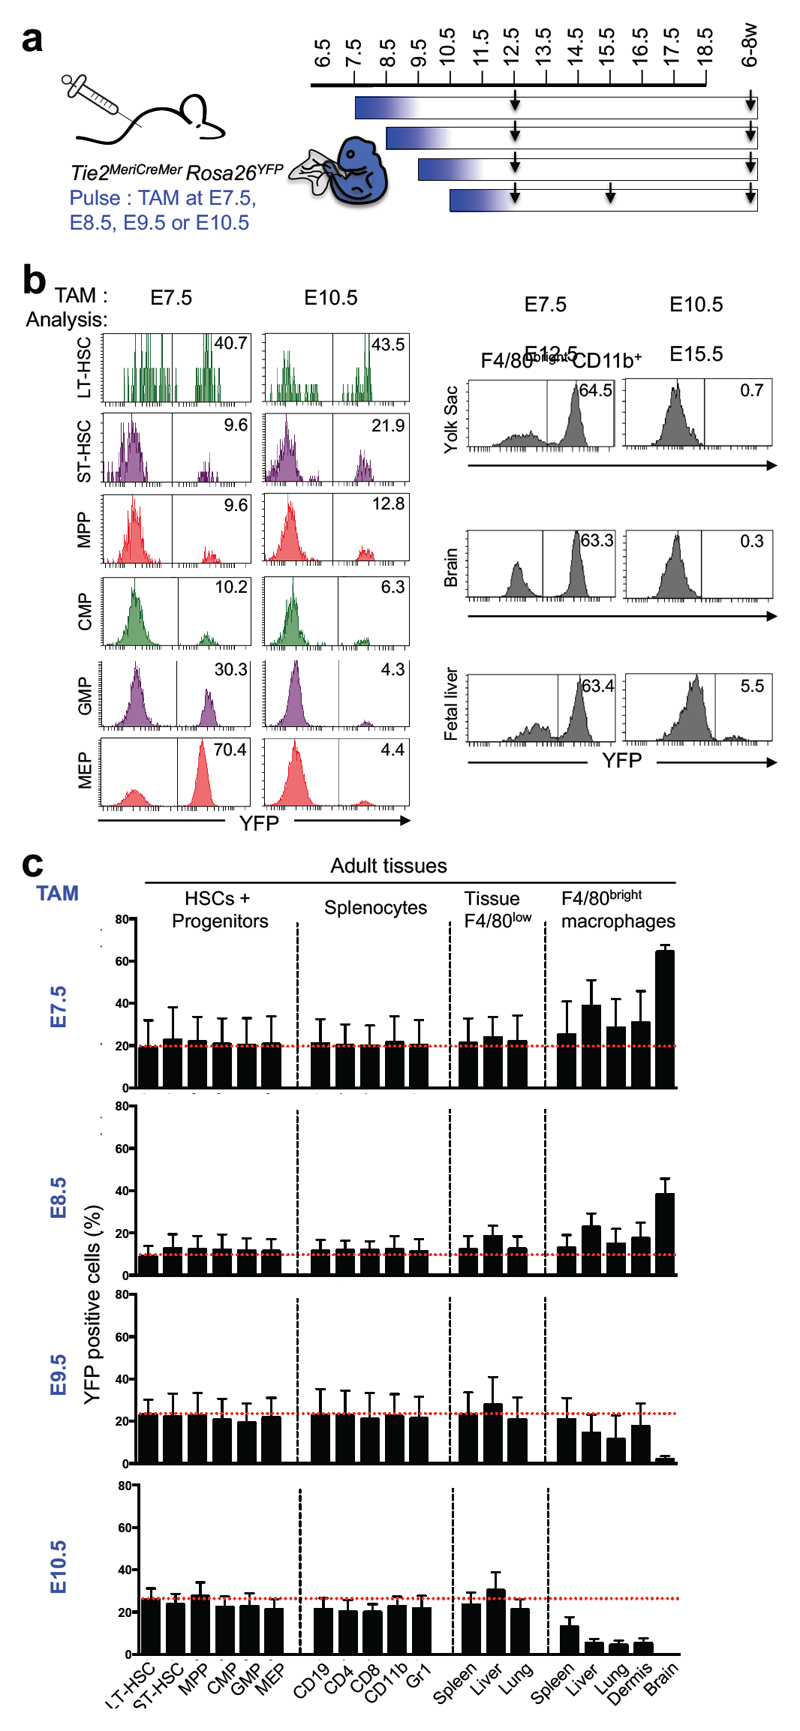
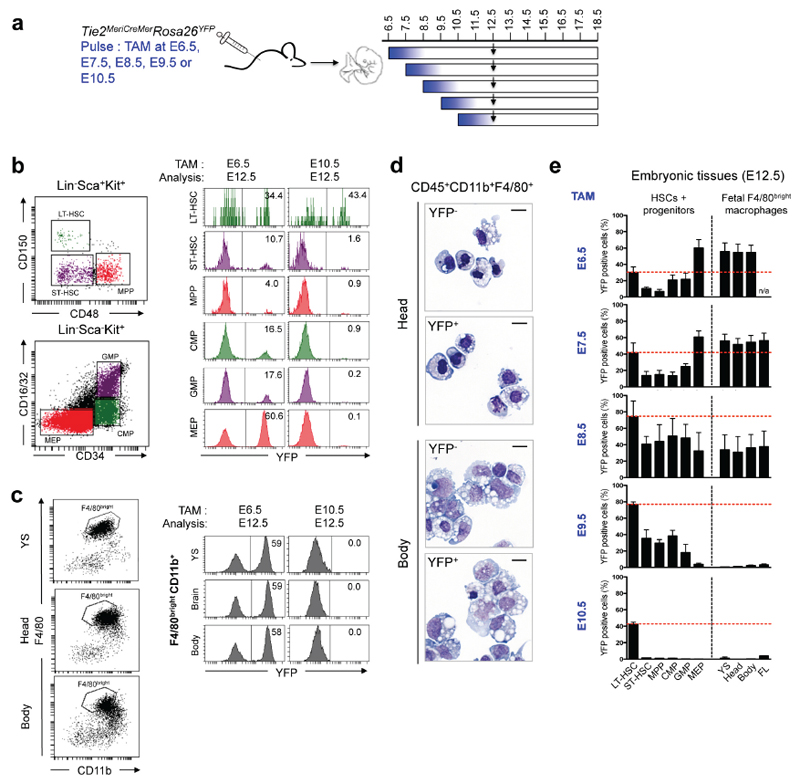
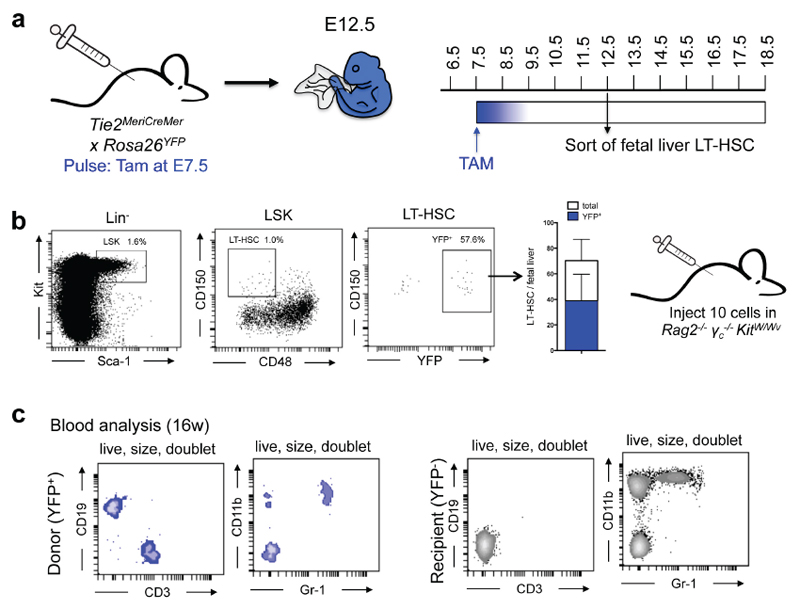
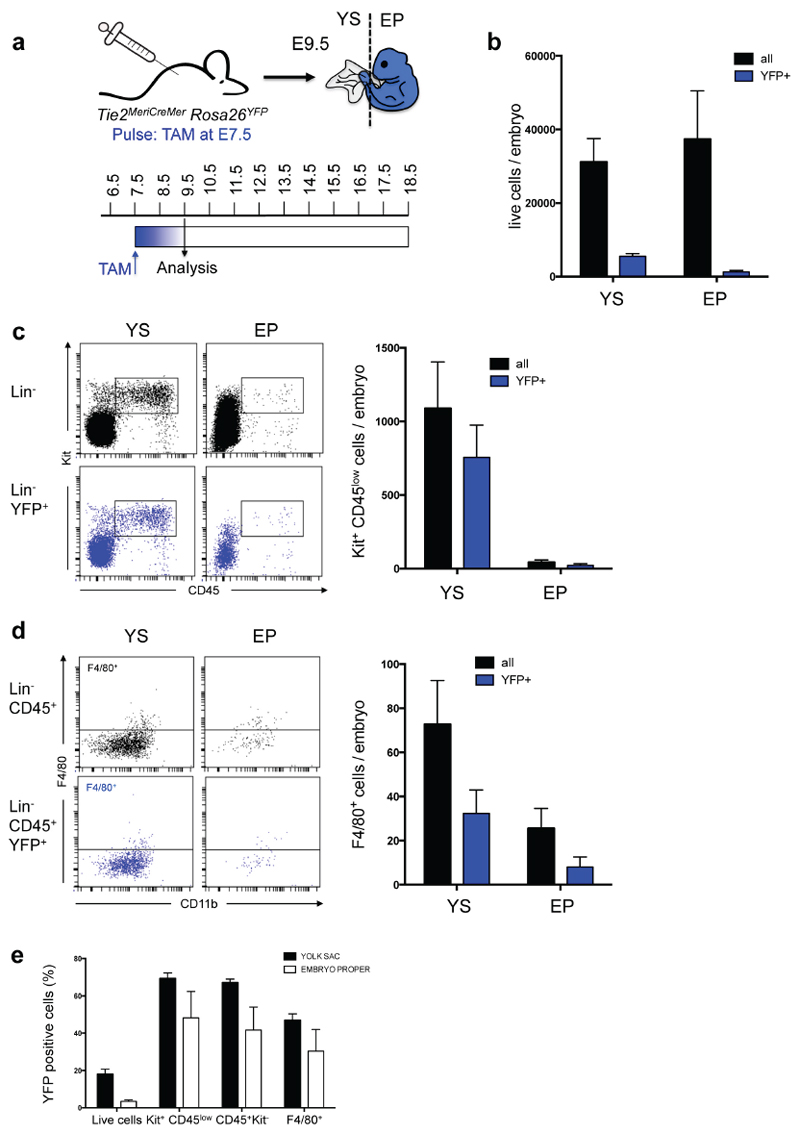
We thus made use of a newly generated inducible Cre knock-in mouse (Tie2MeriCreMer) to track hematopoietic output from hematopoietic progenitors and HSC in situ (Busch K. et al., submitted). Tie2/Tek is expressed in endothelial cells, yolk-sac progenitors, AGM, fetal liver and adult HSCs3. We assessed the time window at which Tie2+ cells contributed to emerging HSCs and macrophages by injecting tamoxifen at different time points (Fig. 4a, Extended Data Figs. 8-10). Fetal liver E12.5 and E15.5 LT-HSC were labelled efficiently in Tie2MeriCreMer embryos pulsed at E6.5, E7.5 or E10.5 (Fig. 4b, Extended Data Fig. 8, 9). Yolk sac E9.5 Kit+ CD45low progenitors were also labelled in Tie2MeriCreMer Rosa26YFP embryos pulsed at E7.5 (Extended Data Fig. 10). Interestingly, fetal liver cells with a megakaryocyte-erythrocyte progenitor (MEP) phenotype, and F4/80bright macrophages in yolk sac, brain, and fetal liver were labelled with high efficiency (60%) in embryos pulsed at E6.5 and E7.5, but not in embryos pulsed at E10.5 (Fig. 4b, Extended Data Fig. 8). These fate mapping experiments directly demonstrate that E12.5 and E15.5 fetal macrophages originate from cells that express Tie2+ as early as E6.5 and, importantly, before E9.5, and strongly support the notion that fetal liver erythro-myeloid progenitors, and all fetal tissue macrophages up to E15.5 are of yolk sac origin.
Figure 4. Fetal macrophages and adult tissue-resident macrophages originate from _Tie2_-expressing progenitors prior to E10.5.
a, Fate mapping analysis of _Tie2_-expressing cells after tamoxifen (TAM) administration at E7.5, or E8.5, or E9.5 or E10.5. Arrows indicate time points for analysis. b, Flow cytometric analysis of fetal liver long-term or short-term hematopoietic stem cells (LT-HSCs, ST-HSCs), multipotent progenitors (MPPs), common myeloid progenitors (CMPs), granulocyte-monocyte progenitors (GMPs), megakaryocyte-erythrocyte progenitors (MEPs) (left panel) and of fetal macrophages (right panel) in the yolk sac, brain, and fetal liver. Time points of labelling (E7.5 (n=7); E10.5 (n=7)) and analysis are indicated, and for each experiment one representative analysis is shown. See Extended Data Fig. 8 for quantitative analysis. c, Frequencies of labelled HSCs and progenitor cells, splenocytes, and F4/80low CD11bhigh myeloid cells and F4/80bright resident macrophages in spleen, liver lung, epidermis and brain were analysed (mean ± s.d.) from 6-8-week-old Tie2MeriCreMer animals pulse-labelled at E7.5 (n=4), E8.5 (n=4), E9.5 (n=4) or E10.5 (n=6).
In adult mice pulsed at embryonic stages (E7.5, or E8.5, or E9.5 or E10.5), bone marrow HSC-derived progenitors, peripheral cells (T and B cells, and granulocytes) in the spleen, and CD11bhigh F4/80low myeloid cells in peripheral tissues (spleen, liver and lung) were homogenously labelled at frequencies comparable to HSC labelling, consistent with their adult HSC origin (Fig. 4c). In contrast, YFP labelling frequencies of adult tissue-resident macrophages were maximal in animals pulse-labelled at E7.5, declined at later time points and were minimal when labelled at E10.5 (Fig. 4c). The fact that adult HSC are disconnected from resident macrophages is further underscored by the finding that resident macrophages in mice pulsed at E7.5 were labelled at higher frequencies than adult HSC, i.e. labelling efficiency did not equilibrate with mouse development. In summary, these inducible temporal analyses demonstrate that while both macrophages and HSC originate from progenitors expressing Tie2 as early as E6.5, adult tissue-resident macrophages in the brain (microglia), liver (Kupffer cells), lung (alveolar macrophages), skin (Langerhans cells), and (to some extent) spleen (F4/80bright macrophages) develop almost exclusively from an _Tie2_-expressing progenitor pathway distinct from HSCs. These data are consistent with results from Csf1rMeriCreMer pulse-labelling experiments (see Figs. 1 and 2), with our earlier observation that resident macrophages are independent of the transcription factor _Myb_4, and, finally, complement our data obtained in Flt3Cre Rosa26YFP mice (see Fig. 3).
This study demonstrates that _Myb_-independent tissue resident macrophages4 originate from yolk-sac-derived EMP, characterised by expression of Csf1r from E8.5 (16-18 somites). The data do not distinguish whether resident macrophages originate from erythro-myeloid, granulocyte-macrophage, or macrophage only-progenitors because these potentials coexist within the yolk-sac-derived EMP population.
We also provide strong in vivo evidence for engraftment of yolk-sac-derived EMP in the early fetal liver. These cells substantially contribute to the first wave of fetal liver hematopoiesis, followed later by bona fide fetal liver HSC-derived hematopoiesis8,19,21. Conclusions from recent studies that Langerhans cells and alveolar macrophages are not of yolk sac origin based on transfer of fetal precursors25,26 should be interpreted in light of our findings that yolk sac EMPs expand in the fetal liver, and are the main source for tissue-resident macrophages.
Under steady-state conditions, yolk-sac-derived macrophages are only marginally replaced by HSC-derived cells in the brain, liver and epidermis. It is remarkable that macrophages of yolk sac origin persist in functionally very distinct tissues, suggesting that the origin is more deterministic of the life span than the tissue location. However, some yolk-sac-derived macrophages can undergo replacement in older mice, as for lung alveolar macrophages. In a third group, exemplified by gut-associated macrophages27, yolk-sac-derived macrophages are replaced by HSC-derived macrophages in the first weeks of post-natal life. The mechanisms responsible for the maintenance of yolk-sac-derived macrophages in certain adult tissues require further investigations. Although yolk-sac- and HSC-derived macrophages can co-exist in the same environment, and their balance be perturbed by pathology, the contributions of these developmentally distinct macrophage populations to homeostasis and inflammation remain to be characterised.
Methods
Animals
_Myb_−/− 28, Csf1rMeriCreMer 29, Csf1riCre 30, Flt3Cre 31, _Rag2_−/− _γ_c−/−_Kit_W/Wv 23 and Rosa26YFP reporter 32 mice have been previously described. _Rag2_−/−_γ_c−/−_Kit_W/Wv were on a mixed genetic background23, Csf1rMeriCreMer and Csf1riCre mice were on FVB background, other mice were on C57BL/6 (CD45.2/.2; Ly5.2) background.
Csf1rMeriCreMer and Csf1riCre mice were generated and provided by Jeffrey W. Pollard. _Myb_−/− mice were generated and provided by Jon Frampton. Flt3Cre mice were generated by Conrad Bleul and provided by Thomas Boehm and Sten Eirik Jacobsen. Rosa26YFP (B6.129X1-Gt(ROSA)26Sortm1(EYFP)Cos/J) reporter mice were purchased from The Jackson Laboratory. We generated a new inducible Cre knock-in mouse (Tie2MeriCreMer) crossed to Rosa26YFP mice to track the hematopoietic output from HSC in situ (Busch K. et al., submitted). No randomization method was used and the investigators were blinded to the genotype of the embryos and animals during the experimental procedure. Results are displayed as mean ± s.e.m (Fig.1, 2, 3) or s.d. (Fig. 4, Supplementary Table 1). All experiments included littermate controls and the minimum sample size used was 3. Embryonic development was estimated considering the day of vaginal plug formation as 0.5 days post-coitum (dpc), and staged by developmental criteria8. In Figs. 1 and 2 and Extended Data Figs. 1-4, embryos were included based on their somite number for embryonic days <E11.5, as described in8. No statistical method was used to predetermine sample size.
All animal procedures were performed in adherence to our project licence issued by the United Kingdom Home Office under the Animals (Scientific Procedures) Act 1986, or by the German regional council at the Regierungspräsidium Karlsruhe, Germany, respectively.
Genotyping
PCR genotyping of Myb28, Csf1riCre 30, _Rag2_−/− γ_c−/−_KitW/Wv 23, Csf1rMeriCreMer and Flt3Cre mice4 was performed according to protocols described previously. PCR genotyping of Tie2MeriCreMer will be described elsewhere (Busch K. et al., submitted).
Processing of tissues for flow cytometry
Pregnant females were killed by cervical dislocation or by exposure to CO2. Embryos ranging from embryonic day (E) 8.25 to E18.5 were removed from the uterus and washed in 4°C phosphate-buffered saline (PBS, Invitrogen). The yolk sac (YS) was harvested from embryos between E8.25 and E12.5. Embryos were exsanguinated through decapitation in 10mM EDTA. To obtain single cell suspensions, organs were incubated in PBS containing 1mg/ml Collagenase D (Roche), 100U/ml DNAse I (Sigma) and 3% fetal calf serum (FCS, Invitrogen) at 37°C for 30min.
Adult tissues (P8 to 1 year) were prepared as follows. Blood was collected by cardiac puncture from anesthetized (isoflurane inhalation) mice. Under terminal anesthesia, mice were perfused by gentle intracardiac injection of 10ml prewarmed (37°C) PBS 1x. The spleen, right liver lobe and right lung lobes were harvested and processed for flow cytometry. To obtain single cell suspensions, organs were incubated 30min in PBS containing 1mg/ml Collagenase D (Roche), 100U/ml DNAse I (Sigma), 2.4mg/ml of Dispase (Invitrogen) and 3% FCS (Invitrogen) at 37°C. Brains from Tie2MeriCreMer were dissociated and incubated for 60min at 37°C in HBSS with 0.2mg/ml Collagenase D, 20μg/ml Dispase I (Roche), and 50U/ml DNAse I (Sigma). Brain cells were resuspended in isotonic Percoll (Pharmacia) at a final density of 1.072g/ml in HBBS containing 3% FCS. The suspension was underlayered with Percoll solution at 1.088g/ml and overlayered with additional layers of Percoll (1.06, 1.05 and 1.03g/ml). After centrifugation cells were collected from 1.06 and 1.072g/ml layers. Brains from the other strains were processed like described for the spleen. For collection of Langerhans cells from Tie2MeriCreMer, epidermal sheets were prepared using an epidermis dissociation kit (Miltenyi Biotec). In the other strains, epidermal sheets were separated from the dermis after incubation for 45min at 37°C in 2.4 mg/ml of Dispase (Invitrogen) and 3% FCS (Invitrogen) and the epidermis was further digested for 30min in PBS containing 1mg/ml Collagenase D (Roche), 100U/ml DNAse I (Sigma), 2.4mg/ml of Dispase (Invitrogen) and 3% FCS (Invitrogen) at 37°C.
Flow cytometric analysis of embryonic and adult tissues and cell sorting
Tissues were mechanically dissociated and passed through a 100μm cell strainer (BD). Red blood cell lysis of fetal liver and adult lung and spleen was performed as described33. Cells were centrifuged at 320 g for 7min, resuspended in 4°C PBS, plated in multi-well round-bottom plates and immunolabelled for FACS analysis. After 15min incubation with purified anti-CD16/32 (FcγRIII/II) diluted 1/50, or ChromPure mouse IgG whole molecule (Dianova) diluted 1/20 in staining buffer (PBS 1X; 0.5% BSA; 2mM ETDA), antibody mixes were added and incubated for 30min. Where appropriate, cells were further incubated with streptavidin conjugates for 20min. The full list of antibodies used can be found in Supplementary Table 2.
Flow cytometry was performed using a BD Biosciences FACSCanto II flow cytometer or a BD Biosciences LSR Fortessa cell analyzer. All data were analysed using FlowJo 9.5 (Tree Star Inc.) or FACS Diva software (BD Bioscience).
Fetal liver, skin and lung YFP+ F4/80bright and YFP+ CD11bhigh cells from E18.5 Flt3Cre Rosa26YFP embryos and from E14.5 and E16.5 Csf1rMeriCreMer Rosa26YFP pulsed at E8.5 were sorted into FCS-coated tubes using FACSAria II for cytospin preparations.
Pulse labelling of Csf1r+ and Tie2+ progenitors
For genetic cell labelling we crossed tamoxifen-inducible Csf1rMeriCreMer and Tie2MeriCreMer transgenic mouse strains with Rosa26YFP reporter mice. In Csf1rMeriCreMer Rosa26YFP embryos recombination was induced by single injection at E8.5 of 75μg per g (body weight) of 4-hydroxytamoxifen (Sigma) into pregnant females. OH-TAM was supplemented with 37.5μg per g Progesterone (Sigma). In Tie2MeriCreMer Rosa26YFP embryos recombination was induced by treatment of pregnant females by gavage at different time points (between E7.5 and E10.5) with a single dose of 2.5mg tamoxifen (Sigma) and 1.75mg progesterone (Sigma) to counteract the mixed estrogen agonist effects of tamoxifen, which can result in fetal abortions.
Continuous labelling of Csf1r+ progenitors
For fate mapping analysis of Csf1r+ precursors, Csf1riCre females were crossed with homozygous Rosa26YFP reporter males. Indicated tissues from embryos and adult F1 mice were analysed by flow cytometry.
Fate mapping of Flt3+ haematopoietic progenitors
For fate mapping analysis of Flt3+ precursors, Flt3Cre males (the transgene is located on the Y chromosome) were crossed to homozygous Rosa26YFP reporter females. For adult experiments, Flt3Cre males were blood phenotyped. Animals with YFP labelling efficiency above 60% in the lymphocytes, monocytes and granulocytes were used for experiments and female littermates were used a Cre negative controls.
Colony Forming assays
Colony-forming unit-culture (CFU-C) assays were performed using Methocult M3434 (Stem Cell Technologies) as described in34. Embryos were collected and dissected in PBS (Gibco, Invitrogen) supplemented with 10% FCS (batch tested and obtained from Gibco), 50 U/ml penicillin, and 50μg/ml streptomycin (Cambrex Corporation). E9 embryos were staged by somite counting. E9 yolk sac and E12 fetal livers were each pooled and incubated for 30 min at 37 °C in PBS supplemented with 10% FCS, 50U/ml penicillin, 50μg/ml streptomycin, 1mg/ml Collagenase D (Roche) and 100U/ml DNase I (Sigma), and dissociated by pipetting. Suspensions were washed, and viable cells were counted on the basis of trypan blue (Sigma) exclusion using a Kova hemocytometer slide.
AA4.1+ progenitors were isolated by flow cytometry using using FACSAria II or FACSAria III. Labelling of cells was performed as described above using the following antibodies: CD45-APC-Cy7, Kit-PE and AA4.1-APC, and live cells were gated on the basis of Hoechst 33258 exclusion. Cells were collected into FCS-coated tubes and recounted prior to plating where possible. Gates were defined using unstained, single stained and fluorescence minus one (FMO) stained cells.
Cells were plated in duplicate in 35mm culture dishes according to manufacturer’s instructions. Cultures were grown at 37 °C with 5% CO2 with colonies scored after 10 days.
Colonies were picked and washed once with phosphate-buffered saline (PBS; Gibco, Invitrogen) supplemented with 10% fetal calf serum (FCS; batch tested and obtained from Gibco). Cytospin preparations were stained with May-Grünwald-Giemsa method for morphological inspection of colonies (see below).
Morphological Analysis of sorted cells and colonies
Cytospin preparations were performed using a Cytospin 3 (Thermo Shandon) by centrifuging (i) cells from colonies at 400 rpm for 4min (medium acceleration) or (ii) sorted cells at 500 rpm for 10min (low acceleration). Slides were air-dried for at least 30min, and fixed for 5min in methanol. Methanol-fixed cytospin preparations were manually stained in 50% May-Grünwald solution for 5min, 14% Giemsa for 15min, washed with Sorensons buffered distilled water (pH 6.8) for 5 min and rinsed with Sorensons buffered distilled water (pH 6.8). After air-drying, slides were mounted with Entellan New (Merck) and representative pictures were taken using a Nikon eclipse E6000 microscope with a Nikon Plan Fluor 60X/1.40 NA oil DIC H objective and NIS-elements BR2.30 software (Nikon).
Transplantation of HSC without irradiation
HSC transplantation in non-irradiated Rag2−/−γc−/−KitW/Wv mice was performed as described previously23. In brief, approximately 1000 LT-HSC (lin-Sca-1+Kit+ CD150+CD48-) isolated from the bone marrow of panRosaYFP mice, which carry a constitutively active YFP reporter allele, were injected into Rag2−/−γc−/−KitW/Wv mice. Recipients were analysed 2 months after transplantation for donor/host chimerism in Blood, spleen, lung, liver, pancreas, brain and epidermis. To test the functionality of E12.5 phenotypic LT-HSC, 10 YFP+ LSK CD150+CD48- (phenotypic LT-HSC) from Tie2MeriCreMerRosa26YFP pulsed at E7.5 were transplanted into Rag2-/-γc-/-KitW/Wv mice and blood lineages were analysed 16 weeks after.
Extended Data
Extended Data Figure 1. Analysis of Csf1r reporter expression in fetal progenitor cells in Csf1riCre Rosa26YFP.
a, Schematic representation of the different hematopoietic and non-hematopoietic sites dissected in the mouse embryos: yolk sac (YS), aorta-gonado-mesonephros (AGM) region, fetal liver and head. b, Experimental design for fate mapping analysis of _Csf1r_-expressing cells. Arrows indicate analysed time points c, Kit and CD45 expression on YFP+ cells from Csf1riCre Rosa26YFP embryos (E8.25, n=7; E8.5, n=4; E9.25-E9.5, n=16; E10.25, n=9; E10.5, n=5; E11.5, n=8; E12.5, n=5) d Number of YFP+ Kit+ CD45low cells per organ/region and developmental time points (mean±s.e.m.) in Csf1riCre Rosa26YFP embryos (upper panel). Number of YFP+ AA4.1+ Kit+ CD45low cells per embryonic region and developmental time points (mean±s.e.m.) in Csf1riCre Rosa26YFP embryos (lower panel). e, AA4.1 and Kit expression on YFP+ cells from Csf1riCre Rosa26YFP embryos (upper panel) and from Csf1rMeriCreMer Rosa26YFP embryos pulsed with OH-TAM at E8.5 (lower panel).
Extended Data Figure 2. Fate mapping analysis of _Csf1r_-expressing cells.
a, Experimental design for fate mapping analysis of _Csf1r_-expressing cells. Arrows indicate analysed time points b, YFP expression on live cells from Csf1rMeriCreMer Rosa26YFP embryos pulsed at E6.5 with OH-TAM and analysed at E10.5 (n=2) and E12.5 (n=4). c, Percentage of YFP+ cells among Kit+ CD45low cells (YFP labelling efficiency) per organ/region (mean±s.e.m.). Upper panel, Csf1riCre Rosa26YFP embryos (E8.25, n=7; E8.5, n=4; E9.5, n=16; E10.25, n=9; E10.5, n=5; E11.5, n=8; E12.5, n=5); lower panel Csf1rMeriCreMer Rosa26YFP embryos pulsed at E8.5 (E9.5, n=3; E10.25, n=3; E10.5, n=4; E11.5, n=4; E12.5, n=9). e, Percentage of YFP+ cells among AA4.1+ Kit+ CD45low cells (YFP labelling efficiency) per embryonic organ/region and developmental time points (mean±s.e.m.). Upper panel, Csf1riCre Rosa26YFP embryos; lower panel: Csf1rMeriCreMer Rosa26YFP embryos pulsed at E8.5.
Extended Data Figure 3. Csf1r+ progenitors have erythro-myeloid potential ex vivo.
a, Sorting strategy for CFU-C (colony forming unit-culture) assays for E9 Csf1riCre Rosa26YFP YS (upper panel) and E12.5 fetal liver from Csf1rMeriCreMer Rosa26YFP embryos pulsed with OH-TAM at E8.5 (lower panel). Dead cells were excluded based on Hoechst 33258 incorporation and, after doublet exclusion, cells were gated based on CD45 and Kit expression. AA4.1+ Kit+ CD45low and YFP+ AA4.1+ Kit+ CD45low cells were isolated from Cre- and Cre+ embryos respectively. b, Mean CFU-C (colony forming unit-culture) frequency from three independent experiments each of E9 Csf1riCre Rosa26YFP YS and E12.5 fetal liver from Csf1rMeriCreMer Rosa26YFP embryos pulsed with OH-TAM at E8.5. CFU-erythroid and/or megakaryocyte (E/Mk); CFU-granulocyte and/or monocyte/macrophage (G/M); CFU-mix, at least three of the following: G, E, M and Mk. c, Morphological validation of colony types obtained from E9 YS Csf1riCre YFP+ AA4.1+ Kit+ CD45low CFU-C assays. Representative images from May-Grünwald-Giemsa stained cytospin preparations of Mixed, E/Mk and G/M colonies. Black arrowhead: macrophages; Granulocyte pathway: blue arrows: Erythroid and Megakaryocyte pathway: red arrows. Scale bar, 10μm.
Extended Data Figure 4. Analysis of Csf1r reporter expression in fetal macrophages and red blood cells in Csf1riCre Rosa26YFP.
a, F4/80 and CD11b expression on YFP+ CD45+ from YS, head (brain for E11.5), limbs and liver of Csf1riCre Rosa26YFP embryos (E8.5, n=4; E9.5, n=16; E10.5, n=5; E11.5, n=9; E12.5, n=5). Dashed line represent FMO (fluorescence minus one) control. b, Percentage of macrophages (F4/80bright) among YFP+ cells, mean±s.e.m., in Csf1riCre Rosa26YFP embryos (left) and Csf1rMeriCreMer Rosa26YFP embryos pulsed with OH-TAM at E8.5 (right). See also Extended Data Table 1. c, Percentage of YFP+ cells among F4/80bright cells (YFP labelling efficiency) per embryonic organ/region and developmental time points (mean±s.e.m.). Left panel, Csf1riCre Rosa26YFP embryos (E8.25, n=7; E8.5, n=5; E9.5, n=15; E10.25, n=9; E10.5, n=5; E11.5, n=9; E12.5, n=5); right panel: Csf1rMeriCreMer Rosa26YFP embryos pulsed at E8.5 (E9.5, n=3; E10.25, n=3; E10.5, n=4; E11.25, n=4; E12.5, n=9). d, YFP expression in erythrocytes (CD45- Ter119+) from YS and fetal liver of Csf1riCre Rosa26YFP embryos (left) and Csf1rMeriCreMer Rosa26YFP embryos pulsed with OH-TAM at E8.5 (right).
Extended Data Figure 5. Analysis of Flt3 reporter expression in blood leucocytes, stem/progenitor cells, fetal red blood cells, and adult liver, lung and spleen in Flt3Cre Rosa26YFP mice.
a. YFP labelling efficiency in blood lineages at different embryonic and adult time points (E14.5, n=9; E16.5, n=9; E18.5, n=7; P8, n=7; 4-week-old, n=6; 12 week-old, n=9; 40 week-old, n=7) in Flt3Cre Rosa26YFP mice are shown. Lymphocytes were gated as CD3+/CD19+, Granulocytes (CD11b+ Gr1+ CD115-), Gr1+ monocytes (CD11b+ Gr1+ CD115+), Gr1- monocytes (CD11b+ Gr1- CD115+) and Red Blood Cells (RBCs, CD45- Ter119+). b, YFP labelling efficiency in bone marrow LT-HSC, ST-HSC, MPP and Lin- Sca1- Kit+ progenitors in 4 (n=3) and 12 week-old (n=6) Flt3Cre Rosa26YFP mice. c, YFP labelling efficiency in fetal liver RBC progenitors (CD45+ Ter119+) and RBCs (CD45- Ter119+) in Flt3Cre Rosa26YFP mice (E14.5, n=5; E16.5, n=5; E18.5, n=7) and comparison of YFP labelling efficiency in fetal liver and blood RBCs in Flt3Cre Rosa26YFP mice at E14.5 (n=5), E16.5 (n=5) and E18.5 (n=7). d, Expression of Gr1 and MHC II, Ly-6G and Siglec-F, CD11c and CD64, and Nkp46 and CD19 among F4/80low CD11bhigh myeloid cells in the liver. Histograms represent Flt3Cre YFP labelling efficiency in the following defined populations: Granulocytes (Gr1+ MHC II- or Ly-6G+), Eosinophils (Siglec-F+), Dendritic cells (CD11c+), B cells (CD19+) and NK cells (Nkp46+) (n=3). e, Analysis of F4/80low CD11bhigh myeloid cells in the lung as in (b). f, Analysis of F4/80low CD11bhigh myeloid cells in the spleen as in (b). g, Expression of CD64 in F4/80bright macrophages and F4/80low myeloid cells in the liver, lung and spleen (FMO, Fluorescence minus one).
Extended Data Figure 6. Characterisation of fetal F4/80low CD11bhigh myeloid cells in liver, lung and skin.
a. F4/80, Kit, CD11b and Gr1 expression on YFP+ CD45+ cells in the fetal liver at E14.5 in Csf1rMeriCreMer Rosa26YFP embryos pulsed at E8.5 (left panel). Representative images of May-Grünwald-Giemsa stained cytospin preparations of fetal liver YFP+ F4/80bright and YFP+ CD11bhigh cells sorted from E14.5 Csf1rMeriCreMer Rosa26YFP embryos pulsed with OH-TAM at E8.5 (right panel). Scale bar,10μm. b, c, F4/80, CD11b, Gr1 and Siglec F expression on CD45+ cells in the embryonic and post natal lung (b) and skin (c) in Csf1rMeriCreMer Rosa26YFP embryos pulsed with OH-TAM at E8.5 (green) and Flt3Cre Rosa26YFP embryos (orange). Representative images of May-Grünwald-Giemsa stained cytospin preparations of lung YFP+ F4/80bright and YFP+ CD11bhigh F4/80low (b) and skin YFP+ F4/80bright and YFP+ Kit+ F4/80- CD11b- mast cells (c) sorted from E18.5 Flt3Cre Rosa26YFP embryos and E16.5 Csf1rMeriCreMer Rosa26YFP embryos pulsed with OH-TAM at E8.5. Scale bar 10μm.
Extended Data Figure 7. Adult BM transplantation reconstitutes the hematopoietic system but does not replace tissue resident F4/80bright macrophages.
a, Schematic representation of transplantation experiments. LT-HSC isolated from bone marrow of panRosa26YFP donor mice were injected into Rag2-/-γc-/- KitW/Wv recipients (approx. 1000 cells/recipient). Eight weeks after transplantation stem cells, myeloid progenitors, monocytes and macrophages of recipient mice were analysed for donor chimerism. b, Long-term or short-term hematopoietic stem cells (LT-HSC, ST-HSC), multipotent progenitors (MPP), common myeloid progenitors (CMP), granulocyte-monocyte progenitors (GMP), megakaryocyte-erythrocyte progenitors (MEP), and circulating Ly6Chi and Ly6Clo monocytes were isolated from transplanted Rag2-/-γc-/-KitW/Wv mice and analysed for YFP expression. c, F4/80bright macrophages and F4/80low myeloid cells in spleen, liver, lung, pancreas, epidermis and brain were analysed for YFP expression.
Extended Data Figure 8. Analysis of fetal stem/progenitor cells and fetal macrophages in Tie2MeriCreMer Rosa26YFP embryos pulse-labelled from E6.5 to E10.5.
a, Experimental design for fate mapping analysis of Tie2MeriCreMerRosa26YFP embryos pulse-labelled at E6.5, or E7.5, or E8.5, or E9.5 or E10.5. b, c, Representative flow cytometry of fetal liver stem/progenitor cells (b) and of fetal macrophages (c) in the yolk sac, head region, and embryo body at E12.5, injected at E6.5 or at E10.5. d, Representative images of May-Grünwald-Giemsa stained cytospin preparations of sorted YFP+ and YFP- CD45+ F4/80bright macrophages of the embryo proper or the head region of E13.5 Tie2MeriCreMerRosa26YFP embryos pulsed at E7.5. Scale bar, 10μm e, Quantification of the percentage of YFP+ stem/progenitor cells in the fetal liver and macrophages in yolk sac, brain (head) and embryo body at E12.5. Embryos were labelled at E6.5 (n=5), or E7.5 (n=7), or E8.5 (n=4), E9.5 (n=5) or E10.5 (n=7) and analysed at E12.5 (mean±s.d.).
Extended Data Figure 9. Transplantation of YFP+ fetal liver LT-HSC from Tie2MeriCreMerRosa26YFP into Rag2-/- γc-/-KitW/Wv mice.
a, Experimental design for pulse-labelling and LT-HSC sort from Tie2MeriCreMerRosa26YFP embryos pulsed at E7.5. b, Fetal livers of E12.5 embryos pulsed at E7.5 were harvested, YFP+ LSK CD150+CD48- LT-HSC were sorted by flow cytometry and 10 LT-HSC were injected into Rag2-/-γc-/-KitW/Wv recipients. c, Blood analysis of recipients 16 week after LT-HSC transplantation. Donor-derived (YFP+) and recipient-derived (YFP-) blood cells were analysed for expression of CD19, CD3, CD11b, and Gr-1. One representative example is shown.
Extended Data Figure 10. Analysis of E9.5 YS progenitor cells in Tie2MeriCreMer Rosa26YFP embryos pulse-labelled at E7.5.
a, Experimental design for fate mapping analysis of _Tie2_-expressing cells in Tie2MeriCreMerRosa26YFP embryos. Embryonic cells were pulse-labelled by Tamoxifen (TAM) administration into pregnant Tie2MeriCreMer mice at E7.5. Yolk sac (YS) and embryo proper (EP) of E9.5 Tie2MeriCreMerRosa26YFP embryos were analysed by flow cytometry. b, Quantification of total living cells and YFP+ living cells in YS and EP of analysed embryos (mean±s.d., n=5). c, Flow cytometry analysis of Kit+ CD45low cells among total living cells (black) or living YFP+ cells (blue) in YS and EP of a representative E9.5 Tie2MeriCreMerRosa26YFP embryo (left) and quantification of all analysed embryos (right; mean±s.d., n=5). d, Analysis of F4/80+ fetal macrophages among CD45+ cells (black) or YFP+ CD45+ cells (blue) in YS and EP (mean±s.d., n=5) and quantification of all analysed embryos (right; mean±s.d., n=5). e, Percentage of YFP+ cells (YFP labelling efficiency) among live cells, Kit+ CD45low, CD45+ Kit- cells and F4/80+ cells from the YS and EP of E9.5 Tie2MeriCreMerRosa26YFP embryos pulsed at E7.5.
Supplementary Material
Extended Data
Supplementary tables
Acknowledgements
The authors are indebted to Prof Jeffrey Pollard, University of Edinburgh, UK for the Csf1r reporter strains, Prof Jon Frampton, University of Birmingham, UK for the _Myb_-deficient animals, and Dr Thomas Boehm, Max Planck Institute, Freiburg, Germany for the Flt3Cre strain. The authors also thank Dr Amanda McGuigan and the staff of the Biological Service Unit at King’s College London, Dr Susanne Heck and the Biomedical Research Centre at King’s Health Partners, Sue Woodcock and the staff of the Viapath hematology lab in Guy’s hospital and S. Schäfer and T. Arnsperger for technical assistance at the German Cancer Research Center. This work was supported by a Wellcome Trust Senior Investigator award (WT101853MA) and ERC Investigator award (2010-StG-261299) from the European Research Council to F.G. and an ERC Investigator award (Advanced Grant 233074), SFB 938 project L, and SFB 873 project B11 to H.-R.R.
Footnotes
Author Contributions
E.G.P. and F.G. designed the study and wrote the manuscript. E.G.P., C.S., L.C. and C.T. performed fate mapping experiments and E.G.P. and F.G. designed experiments and analysed the data. K.B. and H.R.R. generated the Tie2MeriCreMer strain and K.K., K.B. and H.R.R. designed, performed and analysed fate mapping experiments. E.A. and E.G.P. performed the CFU assays and E.A., E.G.P., F.G. and M.F.d.B. analysed and interpreted the experimental data. All authors contributed to the manuscript. E.G.P. and K.K. are co-first authors, F.G. and H.R.R. are co-senior authors.
The authors declare no competing financial interests.
References
- 1.Orkin SH, Zon LI. Hematopoiesis: an evolving paradigm for stem cell biology. Cell. 2008;132:631–644. doi: 10.1016/j.cell.2008.01.025. [DOI] [PMC free article] [PubMed] [Google Scholar]
- 2.Smith LG, Weissman IL, Heimfeld S. Clonal analysis of hematopoietic stem-cell differentiation in vivo. Proceedings of the National Academy of Sciences of the United States of America. 1991;88:2788–2792. doi: 10.1073/pnas.88.7.2788. [DOI] [PMC free article] [PubMed] [Google Scholar]
- 3.Cumano A, Godin I. Ontogeny of the hematopoietic system. Annual review of immunology. 2007;25:745–785. doi: 10.1146/annurev.immunol.25.022106.141538. [DOI] [PubMed] [Google Scholar]
- 4.Schulz C, et al. A lineage of myeloid cells independent of Myb and hematopoietic stem cells. Science. 2012;336:86–90. doi: 10.1126/science.1219179. [DOI] [PubMed] [Google Scholar]
- 5.Yona S, et al. Fate mapping reveals origins and dynamics of monocytes and tissue macrophages under homeostasis. Immunity. 2013;38:79–91. doi: 10.1016/j.immuni.2012.12.001. [DOI] [PMC free article] [PubMed] [Google Scholar]
- 6.Hashimoto D, et al. Tissue-resident macrophages self-maintain locally throughout adult life with minimal contribution from circulating monocytes. Immunity. 2013;38:792–804. doi: 10.1016/j.immuni.2013.04.004. [DOI] [PMC free article] [PubMed] [Google Scholar]
- 7.Ajami B, Bennett JL, Krieger C, Tetzlaff W, Rossi FM. Local self-renewal can sustain CNS microglia maintenance and function throughout adult life. Nature neuroscience. 2007;10:1538–1543. doi: 10.1038/nn2014. [DOI] [PubMed] [Google Scholar]
- 8.Palis J, Robertson S, Kennedy M, Wall C, Keller G. Development of erythroid and myeloid progenitors in the yolk sac and embryo proper of the mouse. Development. 1999;126:5073–5084. doi: 10.1242/dev.126.22.5073. [DOI] [PubMed] [Google Scholar]
- 9.Bertrand JY, et al. Three pathways to mature macrophages in the early mouse yolk sac. Blood. 2005;106:3004–3011. doi: 10.1182/blood-2005-02-0461. [DOI] [PubMed] [Google Scholar]
- 10.Lux CT, et al. All primitive and definitive hematopoietic progenitor cells emerging before E10 in the mouse embryo are products of the yolk sac. Blood. 2008;111:3435–3438. doi: 10.1182/blood-2007-08-107086. [DOI] [PMC free article] [PubMed] [Google Scholar]
- 11.Kierdorf K, et al. Microglia emerge from erythromyeloid precursors via Pu.1- and Irf8-dependent pathways. Nature neuroscience. 2013;16:273–280. doi: 10.1038/nn.3318. [DOI] [PubMed] [Google Scholar]
- 12.Bertrand JY, et al. Characterization of purified intraembryonic hematopoietic stem cells as a tool to define their site of origin. Proceedings of the National Academy of Sciences of the United States of America. 2005;102:134–139. doi: 10.1073/pnas.0402270102. [DOI] [PMC free article] [PubMed] [Google Scholar]
- 13.Moore MA, Metcalf D. Ontogeny of the haemopoietic system: yolk sac origin of in vivo and in vitro colony forming cells in the developing mouse embryo. British journal of haematology. 1970;18:279–296. doi: 10.1111/j.1365-2141.1970.tb01443.x. [DOI] [PubMed] [Google Scholar]
- 14.Herbomel P, Thisse B, Thisse C. Ontogeny and behaviour of early macrophages in the zebrafish embryo. Development. 1999;126:3735–3745. doi: 10.1242/dev.126.17.3735. [DOI] [PubMed] [Google Scholar]
- 15.Takahashi K, Yamamura F, Naito M. Differentiation, maturation, and proliferation of macrophages in the mouse yolk sac: a light-microscopic, enzyme-cytochemical, immunohistochemical, and ultrastructural study. Journal of leukocyte biology. 1989;45:87–96. doi: 10.1002/jlb.45.2.87. [DOI] [PubMed] [Google Scholar]
- 16.Sumner R, Crawford A, Mucenski M, Frampton J. Initiation of adult myelopoiesis can occur in the absence of c-Myb whereas subsequent development is strictly dependent on the transcription factor. Oncogene. 2000;19:3335–3342. doi: 10.1038/sj.onc.1203660. [DOI] [PubMed] [Google Scholar]
- 17.Alliot F, Godin I, Pessac B. Microglia derive from progenitors, originating from the yolk sac, and which proliferate in the brain. Brain research. Developmental brain research. 1999;117:145–152. doi: 10.1016/s0165-3806(99)00113-3. [DOI] [PubMed] [Google Scholar]
- 18.Ginhoux F, et al. Fate mapping analysis reveals that adult microglia derive from primitive macrophages. Science. 2010;330:841–845. doi: 10.1126/science.1194637. [DOI] [PMC free article] [PubMed] [Google Scholar]
- 19.Frame JM, McGrath KE, Palis J. Erythro-myeloid progenitors: "definitive" hematopoiesis in the conceptus prior to the emergence of hematopoietic stem cells. Blood cells, molecules & diseases. 2013;51:220–225. doi: 10.1016/j.bcmd.2013.09.006. [DOI] [PMC free article] [PubMed] [Google Scholar]
- 20.Dzierzak E, Medvinsky A. Mouse embryonic hematopoiesis. Trends in genetics : TIG. 1995;11:359–366. doi: 10.1016/s0168-9525(00)89107-6. [DOI] [PubMed] [Google Scholar]
- 21.Kieusseian A, Brunet de la Grange P, Burlen-Defranoux O, Godin I, Cumano A. Immature hematopoietic stem cells undergo maturation in the fetal liver. Development. 2012;139:3521–3530. doi: 10.1242/dev.079210. [DOI] [PubMed] [Google Scholar]
- 22.Christensen JL, Weissman IL. Flk-2 is a marker in hematopoietic stem cell differentiation: a simple method to isolate long-term stem cells. Proceedings of the National Academy of Sciences of the United States of America. 2001;98:14541–14546. doi: 10.1073/pnas.261562798. [DOI] [PMC free article] [PubMed] [Google Scholar]
- 23.Waskow C, et al. Hematopoietic stem cell transplantation without irradiation. Nature methods. 2009;6:267–269. doi: 10.1038/nmeth.1309. [DOI] [PubMed] [Google Scholar]
- 24.Epelman S, et al. Embryonic and adult-derived resident cardiac macrophages are maintained through distinct mechanisms at steady state and during inflammation. Immunity. 2014;40:91–104. doi: 10.1016/j.immuni.2013.11.019. [DOI] [PMC free article] [PubMed] [Google Scholar]
- 25.Hoeffel G, et al. Adult Langerhans cells derive predominantly from embryonic fetal liver monocytes with a minor contribution of yolk sac–derived macrophages. The Journal of experimental medicine. 2012 doi: 10.1084/jem.20120340. [DOI] [PMC free article] [PubMed] [Google Scholar]
- 26.Guilliams M, et al. Alveolar macrophages develop from fetal monocytes that differentiate into long-lived cells in the first week of life via GM-CSF. The Journal of experimental medicine. 2013;210:1977–1992. doi: 10.1084/jem.20131199. [DOI] [PMC free article] [PubMed] [Google Scholar]
- 27.Bain CC, et al. Constant replenishment from circulating monocytes maintains the macrophage pool in the intestine of adult mice. Nature immunology. 2014;15:929–937. doi: 10.1038/ni.2967. [DOI] [PMC free article] [PubMed] [Google Scholar]
- 28.Mucenski ML, et al. A functional c-myb gene is required for normal murine fetal hepatic hematopoiesis. Cell. 1991;65:677–689. doi: 10.1016/0092-8674(91)90099-k. [DOI] [PubMed] [Google Scholar]
- 29.Qian BZ, et al. CCL2 recruits inflammatory monocytes to facilitate breast-tumour metastasis. Nature. 2011;475:222–225. doi: 10.1038/nature10138. [DOI] [PMC free article] [PubMed] [Google Scholar]
- 30.Deng L, et al. A novel mouse model of inflammatory bowel disease links mammalian target of rapamycin-dependent hyperproliferation of colonic epithelium to inflammation-associated tumorigenesis. The American journal of pathology. 2010;176:952–967. doi: 10.2353/ajpath.2010.090622. [DOI] [PMC free article] [PubMed] [Google Scholar]
- 31.Benz C, Martins VC, Radtke F, Bleul CC. The stream of precursors that colonizes the thymus proceeds selectively through the early T lineage precursor stage of T cell development. The Journal of experimental medicine. 2008;205:1187–1199. doi: 10.1084/jem.20072168. [DOI] [PMC free article] [PubMed] [Google Scholar]
- 32.Srinivas S, et al. Cre reporter strains produced by targeted insertion of EYFP and ECFP into the ROSA26 locus. BMC developmental biology. 2001;1:4. doi: 10.1186/1471-213X-1-4. [DOI] [PMC free article] [PubMed] [Google Scholar]
- 33.Auffray C, et al. CX3CR1+ CD115+ CD135+ common macrophage/DC precursors and the role of CX3CR1 in their response to inflammation. The Journal of experimental medicine. 2009;206:595–606. doi: 10.1084/jem.20081385. [DOI] [PMC free article] [PubMed] [Google Scholar]
- 34.Swiers G, et al. Early dynamic fate changes in haemogenic endothelium characterized at the single-cell level. Nature communications. 2013;4:2924. doi: 10.1038/ncomms3924. [DOI] [PMC free article] [PubMed] [Google Scholar]
Associated Data
This section collects any data citations, data availability statements, or supplementary materials included in this article.
Supplementary Materials
Extended Data
Supplementary tables
