Analysis of similarity within 142 pairs of orthologous intergenic regions of Caenorhabditis elegans and Caenorhabditis briggsae (original) (raw)
Abstract
Patterns of similarity between genomes of related species reflect the distribution of selective constraint within DNA. We analyzed alignments of 142 orthologous intergenic regions of Caenorhabditis elegans and Caenorhabditis briggsae and found a mosaic pattern with regions of high similarity (phylogenetic footprints) interspersed with non-alignable sequences. Footprints cover ∼20% of intergenic regions, often occur in clumps and are rare within 5′ UTRs but common within 3′ UTRs. The footprints have a higher ratio of transitions to transversions than expected at random and a higher GC content than the rest of the intergenic region. The number of footprints and the GC content of footprints within an intergenic region are higher when genes are oriented so that their 5′ ends form the boundaries of the intergenic region. Overall, the patterns and characteristics identified here, along with other comparative and experimental studies, suggest that many footprints have a regulatory function, although other types of function are also possible. These conclusions may be quite general across eukaryotes, and the characteristics of conserved regulatory elements determined from genomic comparisons can be useful in prediction of regulation sites within individual DNA sequences.
INTRODUCTION
Many of the differences between species may be attributed to changes in the regulation of transcription and translation (1). Transcription and translation are often regulated via elements that lie in intergenic regions, which we define as the sequence between the translational start or stop of two successive genes. Thus, by identifying and understanding patterns of similarity and constraint within intergenic regions, we hope to elucidate the function of conserved sequences within intergenic regions, regulatory or otherwise, and to learn how changes in these functions contribute to species’ differences.
The approach of genome comparison has been used in a number of previous studies to identify potential functional elements (2–6). As has been found for other eukaryotes, the intergenic alignments of Caenorhabditis elegans and Caenorhabditis briggsae have a mosaic structure consisting of alignable regions of high similarity interspersed with non-alignable sequence. We refer to these regions of significantly high similarity as phylogenetic footprints (7), and they are often thought to be regulatory in function. The existence of highly similar regions suggests that these regions are performing some function leading to negative selection acting on them. If the compared species are distant enough so that the number of generations since their last common ancestor greatly exceeds the inverse of the per nucleotide mutation rate, then selectively neutral mutations have sufficient time to saturate their genomes (2) and their similarity outside of the footprints is not higher than that expected for random sequences. In particular, this appears to be the case for C.elegans and C.briggsae (3,4).
Genomic comparison cannot find all presumptive regulatory elements, only those that are conserved. However, it is a valuable complement to intraspecific searches for regulatory elements or motifs (8,9). For this purpose, description of the characteristics of conserved regulatory elements determined by alignment between sufficiently diverged organisms is useful in prediction of regulatory elements when only an individual sequence is available.
A previous study in C.elegans and C.briggsae looked at a much smaller sample of intergenic regions (3). Recently, comparisons of a larger number of regions have been made between human and mouse (6), and between Drosophila melanogaster and Drosophila virilis (5). In this study, we analyzed 142 orthologous intergenic regions of C.elegans and C.briggsae from WABA alignments (4,10). Coupled with EST data and information on the orientation of bordering genes, we performed a broader analysis of intergenic sequences than has previously been done for the same pair of organisms. Comparison of our results to these other large studies, including levels of constraint, distribution of footprints, GC content, the ratio of transitions to transversions and the relationship of footprints to 3′ and 5′ UTRs, will help to describe the general patterns of similarity and constraint in intergenic regions and the differences among regulatory elements that may contribute to differences among organisms.
MATERIALS AND METHODS
We used global alignments of C.elegans and C.briggsae constructed using the WABA algorithm (4,10) available from their web site (http://www.cse.ucsc.edu/\~kent/intronerator). In order to find orthologous intergenic regions, we searched for pairs of orthologous genes and assumed that the sequence between such pairs was also orthologous. We found 1130 potential orthologous intergenic regions and filtered these alignments using three criteria to ensure that the aligned sequences are truly orthologous.
Annotation of C.elegans genes from experimental data was not available for most genes. In order to improve confidence that the predicted genes we considered were real genes, we required the agreement of two different gene prediction programs and a database on the translational boundary (start or stop codon) of the intergenic region. The prediction of these programs and database, WABA, Genie and AceDB, are available from the Kent and Zahler web site (http://www.cse.ucsc.edu/\~kent/intronerator). This criterion greatly reduced the size of the data set to 493 potential orthologous intergenic regions.
In order to find good orthologs, we required high similarity between C.elegans and C.briggsae in the exons bordering the intergenic region. If there was not high similarity, we ran a separate gene prediction program, GENSCAN (http://genes.mit.edu/GENSCAN.html) (11) on the C.briggsae sequence and included only those alignments where the predicted translational start or stop matched the prediction from C.elegans. An exact match was not required, but only regions with differences from one stop or start to the other that were modulus three, and 15 nt or less, were included.
Potential paralogs were removed in a two-step process. First, all cases where multiple C.briggsae sequences aligned to single C.elegans sequences in the WABA database were removed. Second, the C.elegans sequences were BLASTed (12) against the whole C.elegans genome, and any sequences that did not have unique hits were also removed. This procedure eliminated all potentially paralogous genes except for genes that would be paralogous in C.briggsae but not in C.elegans, and where only one of the paralogs had been sequenced in C.briggsae. After meeting this last criterion, our data set consists of 142 orthologous intergenic regions containing a total of 97.7 kb of C.elegans sequence and 92.5 kb of C.briggsae sequence. The alignments we used are available at ftp://ftp.ncbi.nih.gov/pub/kondrashov/CaenorhabditisIntergenic. The criteria we used were objective, but the data set is biased towards intergenic regions that are bordered by the 3′ ends of genes (68 regions with two 3′ ends, 45 regions with a 3′ and 5′ end, and 29 regions with two 5′ ends). This is because gene prediction algorithms are more accurate, and therefore more consistent, for 3′ ends of genes than for 5′ ends of genes.
We found footprints within WABA alignments using high similarity, length and significance level following Karlin and Altschul (13). We first found a kernel defined as a 15 nt frame with at least nine matches giving ≤60% similarity. Each kernel was extended in both directions with 7 nt frames. The ends were trimmed such that the final similarity of the extended regions was ≤50% and the boundaries were a match. We chose 50% as the lower cutoff because random sequence of the same base composition aligns with similarity 42% with 95% confidence interval 36–48%, and we wanted our footprints to be above the 95% confidence limit for random sequence alignment similarity. We took, as our final footprints, those with a high significance level based on Karlin and Altschul (13) assuming ungapped sequence, because footprints generally had few, small gaps, if any. We used a score function similar to WABA aligning parameters with match score = 1, mismatch penalty = 1, gap initiation penalty = 11.7 and gap elongation penalty = 0.2. We then calculated a _P_-value based on the length of the whole intergenic region and define significant footprints as those with _P_-values < 0.01. The short lengths of some of our intergenic regions create edge effects that affect the Karlin–Altschul statistics, however the effect is such that our choices of footprints are conservative (14). We tried different methods [assuming gaps based on Mott (15,16) and extracting sequence coded as high similarity by WABA], score functions (match score = 1, mismatch penalty = 1, gap initiation penalty = 3, gap elongation penalty = 2) and significance levels (_P_-value = 0.1) but the resulting sets of footprints differed little from one another. The final set contains 329 footprints that cover 21% of the C.elegans sequence and 22% of the C.briggsae sequence.
Once the data set of footprints was compiled, programs were implemented in the C programming language to take basic data from footprint and whole intergenic sequences. Statistics were either calculated within the C program or using Microsoft Excel 97.
RESULTS
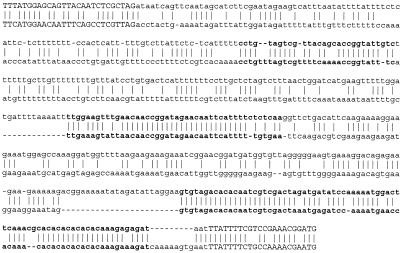
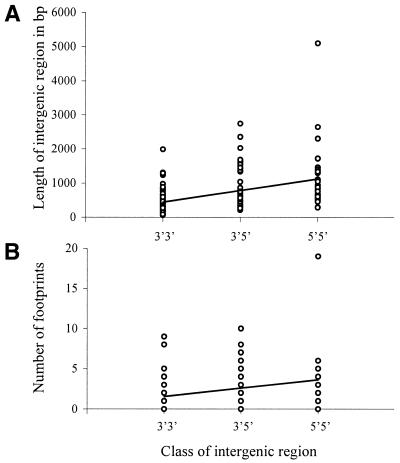
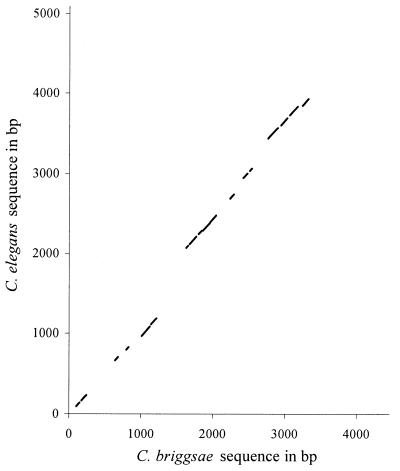
Our analysis identified 142 intergenic regions that comprised our data set. A sample alignment is presented in Figure 1. The average length of the intergenic region is 688 nt but ranges widely from 57 to 5092 nt in C.elegans, and averages 651 nt, but ranges from 57 to 4563 nt in C.briggsae. The lengths of corresponding intergenic regions between species are highly correlated, with a correlation coefficient of 0.92 (P < 0.0001). In general, C.elegans and C.briggsae are very similar in all statistics that we calculated. The lengths of intergenic regions vary depending on the orientation of the genes bordering the intergenic regions. Genes can be oriented so that their 3′ or 5′ ends border the intergenic region, so intergenic regions can be classified into three types: 3′3′, which are bordered by the 3′ ends of both genes; 3′5′, which are bordered by the 3′ end of one gene and the 5′ end of the second gene; and 5′5′, which are bordered by the 5′ ends of both genes. The length of the intergenic region increases with the number of 5′ ends on the borders, i.e., on average, 3′3′ intergenic regions are shorter than 5′5′ regions, and 3′5′ regions are intermediate (_r_2 = 0.16, F = 26.6, P < 0.0001; Fig. 2A).
Figure 1.
Sample alignment of one intergenic region of C.elegans and C.briggsae. Bordering exons are indicated in capital letters, and footprints are indicated in bold. Caenorhabditis elegans sequence from accession number AF036702 (cosmid F33D4): 21750–22253, and C.briggsae sequence from accession number AC084481 (cosmid G02P14): 11868–12399.
Figure 2.
(A) Regression of the length of the intergenic region against the class of intergenic region in C.elegans (y = 337.4_x_ + 433.1). (B) Regression of the number of footprints within an intergenic region against the class of intergenic region in C.elegans (y = 1.0_x_ + 1.6). The regressions for C.briggsae are similar (not reported).
Within the 142 intergenic regions, we found a total of 329 footprints. On average, we identified 2.3 footprints per intergenic region, but the range is from 0 to 19. The number of footprints and the length of the intergenic region are highly correlated (r = 0.70, P < 0.0001). Consistent with the relationship between the length of intergenic region and gene orientation, the number of footprints also increases with the number of 5′ ends of genes bordering the intergenic region (_r_2 =0.10, F =15.6, P = 0.0001; Fig. 2B). The average length of a footprint is 61.8 nt in both C.elegans and C.briggsae with a range from 22 to 292 nt.
Using EST information from C.elegans, we estimated the amount of transcription within our intergenic regions. By BLASTing (12) the C.elegans sequences against the EST database for C.elegans, we calculated the amount of sequence covered by ESTs and assumed that this represents transcribed parts of the sequence. The average length of the 3′ UTR is 199 nt in C.elegans (n = 66). The average length of the 5′ UTR is 87 nt (n = 33). We estimate that 56% of footprints in C.elegans are contained within UTRs based on intergenic regions with both ends covered by ESTs (n = 21).
We also estimated the percent of total C.elegans DNA that is transcribed. Of the C.elegans genome, 27% is predicted to be in coding exons, 26% in introns and 47% in intergenic regions (17). Using only intergenic regions in our data set with both ends covered by ESTs (n = 21), we estimate that 44% of our average intergenic region is transcribed. Based on our data, we estimate that 74% of total C.elegans DNA is transcribed. This is likely to be an upper boundary on the amount transcribed because our intergenic regions on average come from more gene dense regions of the genome and are of shorter length than average. The true amount of the genome transcribed must lie somewhere between 53 and 74%, between the total of the genome estimated to be in introns and coding exons and our estimate.
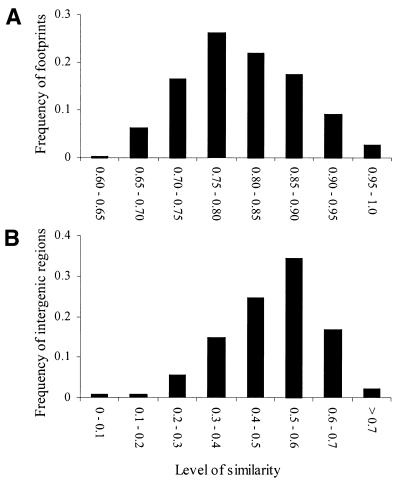
The amount of sequence similarity is calculated as the number of matches over the length of the sequence. Footprints, on average, are 80% similar in both C.elegans and C.briggsae. Similarity ranges from 64 to 100% in C.elegans and 64 to 97% in C.briggsae, and the distribution for C.elegans is presented in Figure 3A. UTRs are 58% similar on average in C.elegans, and the whole intergenic region is 47% similar in C.elegans and 50% similar in C.briggsae on average. The distribution for C.elegans is presented in Figure 3B.
Figure 3.
Distribution of similarity for (A) footprints and (B) intergenic regions for C.elegans. The distributions for C.briggsae are similar (not reported).
This measure of similarity inherently includes similarity due to both selective constraint and random matches. However, the level of selective constraint can be determined. We used the method of Shabalina and Kondrashov (3) to calculate constraint within footprints, intergenic regions and UTRs. This method assumes that there are only two types of nucleotide, freely evolving or constrained. By definition, all nucleotides outside of footprints are freely evolving, but nucleotides within footprints may be of either type. The selective constraint within a footprint is first estimated for the shorter sequence as (s – r)/(_l_short – r), where s is the similarity within the footprint, r is the probability of a match at random for the sequence composition of the footprint and _l_short is the length of the shorter sequence. Selective constraint for the longer sequence is estimated as (_l_short/_l_long) (s – r)/(_l_short – r). Once the number of constrained nucleotides is calculated for each footprint, the constrained nucleotides are added for all footprints within an intergenic region or UTR in order to calculate the constraint for that sequence.
On average, 71% of nucleotides within footprints are constrained in both C.elegans and C.briggsae. The level of constraint in footprints ranges from 46 to 100% in C.elegans and 46 to 96% in C.briggsae. In UTRs in C.elegans, 43% of nucleotides are constrained, and in the whole intergenic region 15% of nucleotides in both C.elegans and C.briggsae are constrained on average. The level of constraint over the whole intergenic region can vary between 0 and 65% depending on the method used to extract footprints, the orientation of the boundary genes and probably also on the function of the boundary genes.
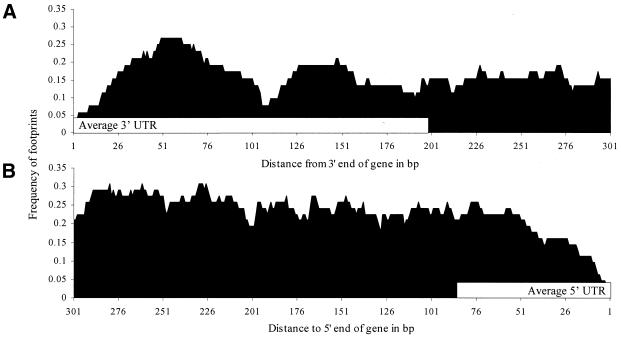
The footprints are spatially distributed in two important ways. First, from the 3′ ends of genes, the highest frequency of footprints occurs between nucleotides 0 and 100 of the intergenic region, which is within the average 3′ UTR (Fig. 4A). For 5′ ends of genes, the highest frequency of footprints occurs between nucleotides 200 and 300, and the bulk of the footprints fall outside the average 5′ UTR (Fig. 4B).
Figure 4.
Frequency profile of footprints covering each nucleotide in C.elegans from (A) the 3′ end of translation to 300 nt into the intergenic region (n = 52) and (B) from 300 nt into the intergenic region to the 5′ end of translation (n = 62) for intergenic regions >600 nt in length. The white bar indicates the length of the average 3′ UTR (A) and 5′ UTR (B). The profiles for C.briggsae are similar (not reported).
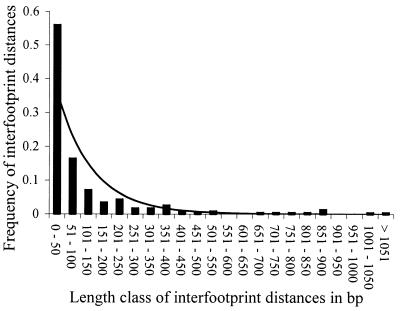
The distribution of footprints is also significantly clumped. This is illustrated for a single intergenic region in Figure 5. The null hypothesis is that the spacing of footprints can be represented as the result of a Poisson process where points analogous to footprints are ‘thrown’ randomly at a line of sequence. Interfootprint distances must then be exponentially distributed. Of course, footprints are not points, but they are small relative to the length of the intergenic region and relatively rare, covering in total ∼20% of the intergenic sequence we analyzed, so the Poisson process is a reasonable approximation. The distribution of interfootprint distances across all intergenic regions is significantly different from the null expectation of an exponential distribution (χ2 = 384.4, P < 0.005; Fig. 6). There is an overabundance of short distances and a deficiency of intermediate distances, which leads to the clumped distribution of the footprints.
Figure 5.
Example of clumping of footprints within an intergenic region. Lines indicate where footprints fall within the intergenic region, and 0 is the beginning of the intergenic region. Caenorhabditis elegans sequence from accession number Z74040 (cosmid K10D6): 8203–13293, and C.briggsae sequence from cosmid MM10A5: 17365–21824.
Figure 6.
The distribution of interfootprint distances in C.elegans measured as the length from the end of one footprint to the beginning of the next. The bars represent the observed distribution of 225 interfootprint distances. The expected line is from an exponential distribution fitted with the same parameter as the observed data. The distribution for C.briggsae is similar (not reported).
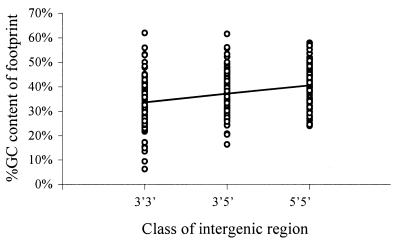
Footprints also differ from the rest of the intergenic region in GC content and from the null expectation for the ratio of transitions to transversions. The average ratio of transitions to transversions in footprints, 0.81, is significantly higher than the null expectation, 0.5 (t = 7.2, P < 0.0001). The average ratio in the intergenic regions is 0.46, which is close to the null expectation and consistent with much of the average intergenic region being comprised of non-alignable sequence where the ratio should be close to that expected at random. GC content is higher in footprints than in the rest of the intergenic region (t = 9.0, P < 0.0001). Within footprints, the average GC content is 0.37 in C.elegans and 0.38 in C.briggsae, and within intergenic regions the average GC content is 0.31 in C.elegans and 0.33 in C.briggsae. The GC content also increases within footprints with the number of 5′ ends bordering the intergenic region (_r_2 = 0.09, F = 32.7, P < 0.0001; Fig. 7).
Figure 7.
Regression of %GC content within a footprint against the class of intergenic region in C.elegans (y = 0.03_x_ + 0.34). The regression for C.briggsae is similar (not reported).
DISCUSSION
The most likely explanation for the existence of footprints is that they are functional in nature and the process of selection conserves them. An alternative hypothesis is that footprints are mutational cold spots (18), but this seems unlikely given the non-random clumping, frequency profiles, higher ratio of transitions to transversions and higher GC content, as well as other studies that link footprints directly to experimentally determined functional elements (4,5,19–21). Additionally, Clark’s mutation-drift model (18) predicts that footprint length should be lognormally distributed, and the distribution of our footprints is not lognormal (Shapiro–Wilkinson test on log transformed data, W = 0.97, P = 0.012). Given that footprints are conserved functional elements, there are still many possibilities as to what the actual function is. An a priori list of functional possibilities includes transposable elements, coding or non-coding exons, elements of RNA secondary structure important for regulation, RNA genes, and promoters and enhancers. Some of these possibilities can be eliminated as the function of most of our footprints based on our results.
It is virtually impossible that our footprints are transposable elements, domesticated or otherwise. Generally, transposable elements are thought to be rare in C.elegans (17). However, there is some evidence emerging that transposable elements can be domesticated by a genome for use as genes or regulatory elements (22–24). Such elements are conserved, but they do not appear to be present in our data set. We ran all of our sequences against the C.elegans database for transposable elements in RepeatMasker (http://repeatmasker.genome.washington.edu/cgi-bin/RepeatMasker) (A.F.A.Smit and P.Green, unpublished data) and found only seven elements, none of which overlap footprints. We also compared all footprints against the entire C.elegans genome using BLAST (12). Almost all of the footprints have sequences that are unique in the genome. This is consistent with some footprints being members of large families of sequences recognized by the same transcription factor, because sequence similarity between such members is often rather low, except a very short consensus (25).
It is unlikely that these footprints are unknown coding exons for several reasons. First, three different gene prediction programs were used on the sequences, and none of the programs predicted coding exons in the sequences we are using. Second, the intergenic alignments do not have the characteristic structure of coding exons: namely, the similarity between actual nucleotide sequences is no less than putative amino acid sequences that can be translated from them and gaps that are not modulus three are common. Third, the ratio of transitions to transversions in coding sequence is usually much greater than one (26,27), and the ratio in our footprints, 0.81, is significantly lower than one (t = 4.7, P < 0.001). Finally, the average length of footprints, 61.8 nt, is significantly shorter than the average length of exons, 99.7 nt, in C.elegans (t = 48.3, P < 0.001) (28).
The concern that some of our footprints might be exons is particularly reasonable for Caenorhabditis given that an estimated 70% of gene products in C.elegans are _trans_-spliced (29,30). We eliminated 56% of potential orthologous intergenic regions by requiring agreement of three gene-finding programs; many of these were likely to be _trans_-spliced sequences as we expect _trans_-spliced sequences to be less consistently predicted. We looked for _trans_-splicing within our intergenic regions using those regions with both ends covered by ESTs. We searched for the canonical TTTCAG _trans_-splice acceptor sequence upstream of the 5′ EST (29) and found a total of three potential splice sites near the 14 5′ ESTs that we considered. This suggests that up to 21% of our regions could be _trans_-spliced. However, the longest known intercistronic length is ∼400 bp (29,30). When we look at data for intergenic regions that are longer than the longest known intercistronic length, those that are >500 bp, our results do not qualitatively change, implying that _trans_-splicing does not affect our results even if present.
Some footprints within UTRs may correspond to non-coding exons known from higher eukaryotes. Non-coding exons are often poorly predicted by gene prediction programs (31), but are important in translational regulation. Such exons are transcribed but not translated, and so could be in our footprints.
A second possible function for footprints in UTRs is as elements of mRNA secondary structure. In particular, structural elements such as Y-type stem–loop structures and pseudoknots may be important in IRES elements where translational regulation occurs without an initiator tRNA (32,33). More generally, conservation of some types of RNA structural elements, like Y-type stem–loop structures and pseudoknots, could produce the clumping of footprints that we see. There are also several examples of GC rich leader-sequences associated with translation regulation at 5′ ends of genes (34), which fits with our observed pattern of increased GC content associated with the 5′ ends of genes.
Footprints that fall outside of UTRs could be conserved RNA genes (35). There is also direct evidence that these footprints can be regulatory elements such as promoters or enhancers, and we think this is the most likely possibility for many of the non-UTR footprints in our data set. Direct correspondence at the sequence level has been found between footprints and experimentally determined regulatory elements in Drosophila (36), and conserved motifs in footprints of human–mouse comparisons correspond to experimentally determined regulatory motifs (37). The nucleotide content of the footprints in this study also indirectly points to a regulatory function. The ratio of transitions to transversions in our footprints is very similar to that found in experimentally known regulatory elements (38), as is the higher GC content in footprints compared to the rest of the intergenic region (39,40). Overall, it seems likely that many of our footprints carry out some sort of transcriptional or translational regulation.
Interestingly, our estimate of the average level of constraint within intergenic regions, 0.15, is quite similar to several other studies. Not surprisingly, our estimate is similar to another estimate for C.elegans and C.briggsae, 0.18, made with a small data set comprised of much longer regions averaging ∼3000 nt in length (3). More surprisingly, our estimate is also similar to that found for comparisons of human–mouse, 0.19 in mouse and 0.15 in human (6), and Drosophila, 0.22–0.26 (5). Average levels of 15–30% constraint in intergenic regions appear to be fairly constant across several different comparisons of eukaryotes and also compare closely to estimates for introns (3,5).
The distribution of the frequency of footprints in C.elegans and C.briggsae has both similarities and differences compared with human–mouse (6). In Caenorhabditis, the highest frequency of footprints is within 3′ UTRs, but outside of 5′ UTRs. The frequency drops off only slightly beyond 3′ UTRs and is fairly constant within and beyond 5′ UTRs. The constant frequency of footprints with distance in 5′ UTRs may imply that important positions for 5′ regulation are unique in intergenic regions. In contrast, position may be more conserved in 3′ regulation. In comparisons with human and mouse, the bulk of the distribution is at the translational boundary with both 3′ and 5′ UTRs, and drops off steadily for both types of UTRs (6). This may imply that more regulatory elements are near the translational boundary and in 5′ UTRs in mammals than in nematodes, potentially leading to fundamental differences in how transcriptional and translational regulation work and the importance of the exact position of regulatory elements in these two groups.
While the absolute placement of footprints differs, the clumping pattern of footprints is similar across interspecies comparisons. Similar clumping patterns occur in comparisons of D.melanogaster and D.virilis (41). This may be due to protein–protein interactions if multiple proteins need to interact when binding to an enhancer (41). A second hypothesis is that the clumping pattern reflects higher order structure of the DNA if, for example, regulation occurs more easily where DNA is exposed. Currently, there is too much variability in the data to determine if the clumping corresponds to spacing of known structural elements like nucleosomes, so this hypothesis cannot be disproved by genome comparison alone. Clumping could also reflect conservation of sites involved in RNA secondary structure like pseudoknots and Y-type stem–loop elements (33).
We suggest that characteristics from footprints could be helpful for prediction of conserved regulatory elements from individual DNA sequence. Although within taxa the distribution of footprint frequency at particular positions varies somewhat, it seems consistent within specific taxa. Across taxa, footprints may clump together. In addition, we find for nematodes that nucleotide composition differs within footprints and the number of footprints and GC content are correlated with gene orientation. Taken together, these pieces of information can help determine the most likely places to look for regulatory elements when considering individual sequences.
Acknowledgments
ACKNOWLEDGEMENTS
We would like to acknowledge the helpful comments of two anonymous reviewers. C.T.W. acknowledges funding from an NIH IRTA fellowship.
REFERENCES
- 1.Tautz D. (2000) Evolution of transcriptional regulation. Curr. Opin. Genet. Dev., 10, 575–579. [DOI] [PubMed] [Google Scholar]
- 2.Kimura M. (1983) The Neutral Theory of Molecular Evolution. Cambridge University Press, New York.
- 3.Shabalina S.A. and Kondrashov,A.S. (1999) Pattern of selective constraint in C. elegans and C. briggsae genomes. Genet. Res., 74, 23–30. [DOI] [PubMed] [Google Scholar]
- 4.Kent W.J. and Zahler,A.M. (2000) Conservation, regulation, synteny, and introns in a large-scale _C. briggsae_-C. elegans genomic alignment. Genome Res., 10, 1115–1125. [DOI] [PubMed] [Google Scholar]
- 5.Bergman C.M. and Kreitman,M. (2001) Analysis of conserved noncoding DNA in Drosophila reveals similar structural and evolutionary properties of intergenic and intronic sequences. Genome Res., 11, 1335–1345. [DOI] [PubMed] [Google Scholar]
- 6.Shabalina S.A., Ogurtsov,A.Yu., Kondrashov,V.A. and Kondrashov,A.S. (2001) Selective constraint in intergenic regions of human and mouse genomes. Trends Genet., 17, 373–376. [DOI] [PubMed] [Google Scholar]
- 7.Tagle D.A., Koop,B.F., Goodman,M., Slightom,J.L., Hess,D.L. and Jones,R.T. (1988) Embryonic epsilon and gamma globin genes of a prosimian primate (Galago crassicaudatus) nucleotide and amino acid sequences, developmental regulation and phylogenetic footprints. J. Mol. Biol., 203, 439–455. [DOI] [PubMed] [Google Scholar]
- 8.Hardison R.C. (2000) Conserved noncoding sequences are reliable guides to regulatory elements. Trends Genet., 16, 369–372. [DOI] [PubMed] [Google Scholar]
- 9.Wasserman W.W., Palumbo,M., Thompson,W., Fickett,J.W. and Lawrence,C.E. (2000) Human-mouse genome comparisons to locate regulatory sites. Nature Genet., 26, 225–228. [DOI] [PubMed] [Google Scholar]
- 10.Kent W.J. and Zahler,A.M. (2000) The Intronerator: exploring introns and alternative splicing in Caenorhabditis elegans. Nucleic Acids Res., 28, 91–93. [DOI] [PMC free article] [PubMed] [Google Scholar]
- 11.Burge C. and Karlin,S. (1997) Prediction of complete gene structures in human genomic DNA. J. Mol. Biol., 268, 78–94. [DOI] [PubMed] [Google Scholar]
- 12.Altschul S.F., Madden,T.L., Schaffer,A.A., Zhang,J.H., Zhang,Z., Miller,W. and Lipman,D.J. (1997) Gapped BLAST and PSI-BLAST: a new generation of protein database search programs. Nucleic Acids Res., 25, 3389–3402. [DOI] [PMC free article] [PubMed] [Google Scholar]
- 13.Karlin S. and Altschul,S.F. (1993) Applications and statistics for multiple high-scoring segments in molecular sequences. Proc. Natl Acad. Sci. USA, 90, 5873–5877. [DOI] [PMC free article] [PubMed] [Google Scholar]
- 14.Altschul S.F. and Gish,W. (1996) Local alignment statistics. Methods Enzymol., 266, 460–480. [DOI] [PubMed] [Google Scholar]
- 15.Mott R. and Tribe,R. (1999) Approximate statistics of gapped alignments. J. Comput. Biol., 6, 91–112. [DOI] [PubMed] [Google Scholar]
- 16.Mott R. (2000) Accurate formula for p-values of gapped local sequence and profile alignments. J. Mol. Biol., 300, 649–659. [DOI] [PubMed] [Google Scholar]
- 17.The C. elegans Sequencing Consortium. (1998) Genome sequence of the nematode C. elegans: a platform for investigating biology. Science, 282, 2012–2018. [DOI] [PubMed] [Google Scholar]
- 18.Clark A.G. (2001) The search for meaning in noncoding DNA. Genome Res., 11, 1319–1320. [DOI] [PubMed] [Google Scholar]
- 19.Hardison R.C., Oeltjen,J. and Miller,W. (1997) Long human-mouse sequence alignments reveal novel regulatory elements: a reason to sequence the mouse genome. Genome Res., 7, 959–966. [DOI] [PubMed] [Google Scholar]
- 20.Boeddrich A., Burgtorf,C., Crollius,H.R., Hennig,S., Bernot,A., Clark,M., Reinhardt,R., Lehrach,H. and Francis,F. (1999) Analysis of the spermine synthase gene region in Fugu rubripes, Tetraodon fluviatilis, and Danio rerio. Genomics, 57, 164–168. [DOI] [PubMed] [Google Scholar]
- 21.Jareborg N., Birney,E. and Durbin,R. (1999) Comparative analysis of noncoding regions of 77 orthologous mouse and human gene pairs. Genome Res., 9, 815–824. [DOI] [PMC free article] [PubMed] [Google Scholar]
- 22.Kidwell M.G. and Lisch,D.R. (2001) Perspective: transposable elements, parasitic DNA, and genome evolution. Evolution, 55, 1–24. [DOI] [PubMed] [Google Scholar]
- 23.Brosius J. (1999) Genomes were forged by massive bombardments with retroelements and retrosequences. Genetica, 107, 209–238. [PubMed] [Google Scholar]
- 24.Makalowski W. (2000) Genomic scrap yard: how genomes utilize all that junk. Gene, 259, 61–67. [DOI] [PubMed] [Google Scholar]
- 25.Levy S., Hannenhalli,S. and Workman,C. (2001) Enrichment of regulatory signals in conserved non-coding genomic sequence. Bioinformatics, 17, 871–877. [DOI] [PubMed] [Google Scholar]
- 26.Mullikin J.C., Hunt,S.E., Cole,C.G., Mortimore,B.J., Rice,C.M., Burton,J., Matthews,L.H., Pavitt,R., Plumb,R.W., Sims,S.K. et al. (2000) An SNP map of human chromosome 22. Nature, 407, 516–520. [DOI] [PubMed] [Google Scholar]
- 27.Wang D.G., Fan,J.B., Siao,C.J., Berno,A., Young,P., Sapolsky,R., Ghandour,G., Perkins,N., Winchester,E., Spencer,J. et al. (1998) Large-scale identification, mapping, and genotyping of single-nucleotide polymorphisms in the human genome. Science, 280, 1077–1082. [DOI] [PubMed] [Google Scholar]
- 28.Deutsch M. and Long,M. (1999) Intron-exon structures of eukaryotic model organisms. Nucleic Acids Res., 27, 3219–3228. [DOI] [PMC free article] [PubMed] [Google Scholar]
- 29.Blumenthal T. (1995) Trans-splicing and polycistronic transcription in Caenorhabditis elegans. Trends Genet., 11, 132–136. [DOI] [PubMed] [Google Scholar]
- 30.Huang T., Kuersten,S., Deshpande,A.M., Spieth,J., MacMorris,M. and Blumenthal,T. (2001) Intercistronic region required for polycistronic Pre-mRNA processing in Caenorhabditis elegans. Mol. Cell. Biol., 21, 1111–1120. [DOI] [PMC free article] [PubMed] [Google Scholar]
- 31.Wong G.K.S., Passey,D.A., Huang,Y.Z., Yang,Z.Y. and Yu,J. (2000) Is “junk” DNA mostly intron DNA? Genome Res., 10, 1672–1678. [DOI] [PMC free article] [PubMed] [Google Scholar]
- 32.RajBhandary U.L. (2000) More surprises in translation: initiation without the initiator tRNA. Proc. Natl Acad. Sci. USA, 97, 1325–1327. [DOI] [PMC free article] [PubMed] [Google Scholar]
- 33.Le S.Y. and Maizel,J.V. (1997) A common RNA structural motif involved in the internal initiation of translation of cellular mRNAs. Nucleic Acids Res., 25, 362–369. [DOI] [PMC free article] [PubMed] [Google Scholar]
- 34.Kozak M. (1991) An analysis of vertebrate messenger RNA sequences: intimations of translational control. J. Cell Biol., 115, 887–903. [DOI] [PMC free article] [PubMed] [Google Scholar]
- 35.Erdmann V.A., Barciszewska,M.Z., Szymanski,M., Hochberg,A., de Groot,N. and Barciszewski,J. (2001) The non-coding RNAs as riboregulators. Nucleic Acids Res., 29, 189–193. [DOI] [PMC free article] [PubMed] [Google Scholar]
- 36.Dickinson W.J. (1991) The evolution of regulatory genes and patterns in Drosophila. Evol. Biol., 25, 127–173. [Google Scholar]
- 37.Kondrashov A.S. and Shabalina,S.A. (2002) Classification of common conserved sequences in mammalian intergenic regions. Hum. Mol. Genet., 11, in press. [DOI] [PubMed] [Google Scholar]
- 38.Shabalina S.A., Yurieva,O.V. and Kondrashov,A.S. (1991) On the frequencies of nucleotides and nucleotide substitutions in conservative regulatory DNA sequences. J. Theor. Biol., 149, 43–54. [DOI] [PubMed] [Google Scholar]
- 39.Brown A.M. and Lemke,G. (1997) Multiple regulatory elements control transcription of the peripheral myelin protein zero gene. J. Biol. Chem., 272, 28939–28947. [DOI] [PubMed] [Google Scholar]
- 40.Butta N., Gonzalez-Manchon,C., Arias-Salgado,E.G., Ayuso,M.S. and Parilla,R. (2001) Cloning and functional characterization of the 5′ flanking region of the human mitochondrial malic enzyme gene – Regulatory role of Sp1 and AP-2. Eur. J. Biochem., 268, 3017–3027. [DOI] [PubMed] [Google Scholar]
- 41.Bergman C. (2001) Evolutionary analyses of transcriptional control sequences. Ph.D. Thesis, University of Chicago.
