Symmetrical base preferences surrounding HIV-1, avian sarcoma/leukosis virus, and murine leukemia virus integration sites (original) (raw)
Abstract
To investigate retroviral integration targeting on a nucleotide scale, we examined the base frequencies directly surrounding cloned in vivo HIV-1, murine leukemia virus, and avian sarcoma/leukosis virus integrations. Base preferences of up to 2-fold the expected frequencies were found for three viruses, representing P values down to <10-100 and defining what appear to be preferred integration sequences. Offset symmetry reflecting the topology of the integration reaction was found for HIV-1 and avian sarcoma/leukosis virus but not murine leukemia virus, suggesting fundamental differences in the way different retroviral integration complexes interact with host-cell DNA.
Keywords: retrovirus, targeting
Although recent evidence suggests that integration preferences for some retroviruses are based on the in vivo transcriptional activity of the target DNA (1-5), it has been generally thought that there is little sequence specificity for bases surrounding the integration site. In vitro, studies using nonionic detergent-lysed HIV-1 virions have found small base preferences surrounding the integration (6). In vivo, only a weak base preference has been described within the five-base duplication produced during HIV-1 integration (7).
Recently, several cloning projects have produced an unprecedented number of sequences from HIV-1, murine leukemia virus (MLV), and avian sarcoma/leukosis virus (ASLV) integrations into human cellular DNA (1, 3-5). To better understand how these viruses select an integration site, we analyzed the base preferences in the genomic sequence directly surrounding the integration sites. We report here that, with an analysis possessing sufficient statistical power, strong preferences are shown. In addition, this analysis reveals previously undescribed patterns of symmetry reflecting the topology of the integration reaction.
Materials and Methods
Obtaining Cloned Integration Sites. Sequence sets used were obtained by selective amplification and cloning of human cellular DNA flanking integration sites published by Schröder et al. (1) for HIV-1 deposited in GenBank (accession nos. BH609398-BH609878); those reported by Wu et al. (3), for HIV-1 and MLV obtained as a gift from the authors and deposited in GenBank (accession nos. AY515855-AY517469); those reported by Mitchell et al. (4), for HIV-1 and ASLV deposited in GenBank (accession nos. CL528318-CL529767); and those reported by Narezkina et al. (5), for ASLV obtained as a gift and deposited in GenBank (accession nos. AY653309-AY653534) (sequence sets are further described in Table 1).
Table 1. Sets of integration clones used.
| Infecting virus | Original number | After curation | Experimental description | Base frequencies A/C/G/T,% |
|---|---|---|---|---|
| HIV-1 (1) | 481 | 342 | Pseudotyped HIV-1 infecting SupT1 cells | 29.5/20.2/20.3/30.0 |
| HIV-1 (3) | 462 | 360 | Wild-type HIV-1 in H9 cells | 30.6/19.6/19.6/30.2 |
| HIV-1 (3) | 294 | 164 | Pseudotyped HIV-1 infecting HeLa cells | 30.0/19.9/20.0/30.1 |
| HIV-1 (4) | 528 | 503 | Pseudotyped HIV-1 infecting peripheral blood mononuclear cells | 30.9/19.2/19.2/30.9 |
| HIV-1 (4) | 467 | 426 | Pseudotyped HIV-1 infecting IMR-90 lung fibroblasts | 30.4/19.8/19.8/30.1 |
| MLV (3) | 623 | 567 | Pseudotyped MLV infecting HeLa cells | 28.7/21.4/21.5/28.4 |
| MLV (3) | 431 | 372 | Pseudotyped MLV infecting HeLa cells | 28.0/22.1/22.1/27.8 |
| ASLV (5) | 226 | 194 | Pseudotyped ASLV infecting HeLa cells | 28.9/20.6/20.6/29.7 |
| ASLV (4) | 455 | 426 | Pseudotyped ASLV infecting 293-TVA cells | 29.3/20.2/20.2/30.1 |
| Random control | 881 | 881 | Randomly chosen 2,001 bp human sequences | 28.9/21.1/21.1/29.0 |
| Total HIV | 2,232 | 1,795 | 30.4/19.7/19.7/30.2 | |
| Total MLV | 1,054 | 939 | 28.3/21.8/21.8/28.2 | |
| Total ASLV | 681 | 620 | 29.2/20.3/20.3/30.0 |
Genomic Localization of Integration Sites. The blat program, hosted at the University of California, Santa Cruz (8), was used to search each integration clone against the July 2003 freeze of the human genome. The blat genome search, hosted by the University of California at Santa Cruz Genome Bioinformatics Group, was used because it excels at quickly finding high-identity matches searching with 30-mer or longer sequences. Results were curated to remove low-quality hits. Matches were grouped by sequence name, then sorted by total number of bases matched. The best match for each sequence was used if it had ≥95% identity and if the second best match had ≤90% identity. Of the clones discarded, nearly all were removed because they were too short to uniquely match a single genomic site. Additionally, the effects observed were quite similar among data sets irrespective of the number of clones discarded. If the beginning of the match did not fall at the first base of the clone, the genomic match was adjusted by the same number of bases. For plus-strand matches, bases were subtracted from the lower of the two genomic site boundaries. For minus-strand matches, bases were added to the higher of the two genomic site boundaries. The genomic sequence was then retrieved from the July 2003 freeze of the genome database hosted at the University of California, Santa Cruz (9, 10). For plus-strand matches, the lower boundary of the genomic match was used as the site of viral joining, and the plus-strand sequence was requested. For minus-strand matches, the higher boundary of the genomic match was used as the site of viral joining, and the minus-strand sequence was requested. One thousand bases of flanking sequence both 5′ and 3′ to the site of viral joining was also requested, producing a 2,001-base sequence with the joining site for a retroviral integration event located at the center. A set of 881 random locations throughout the genome was used as a control.
Analysis of Base Frequency Surrounding Integration Sites. Sequences were aligned to their integration site and numbered relative to distance from integration. The center base was the first genomic base 3′ to the viral integration joint, referred to as offset 0, flanked by 500 bases 5′, referred to as offsets -500 through -1, and flanked by 500 bases 3′, referred to as offsets 1-500. Thus the sequences analyzed represented the genomic sequence before the viral long terminal repeat (LTR) was inserted between offsets -1 and 0. A global base frequency was calculated across all offsets for all sequences present in a set. Base frequencies observed at each offset between -500 and 500 within a set were compared to the global base frequencies and the P value of any differences determined by using χ2 analysis. The overall base composition for each set did not differ greatly from that of the genome as a whole (Table 1).
Results
To determine whether there was a base preference in the vicinity of the integrations, the sequences from each data set were aligned to the integration site and the frequency of each base at each position tabulated. These frequencies were compared with the overall frequency for that set by using a χ2 analysis to calculate P values. The randomly selected genomic sites showed no significant bias at any site, with only two locations in the 1,001 bases analyzed having P values below 0.001 (Fig. 1 D and E and Table 2, which is published as supporting information on the PNAS web site).
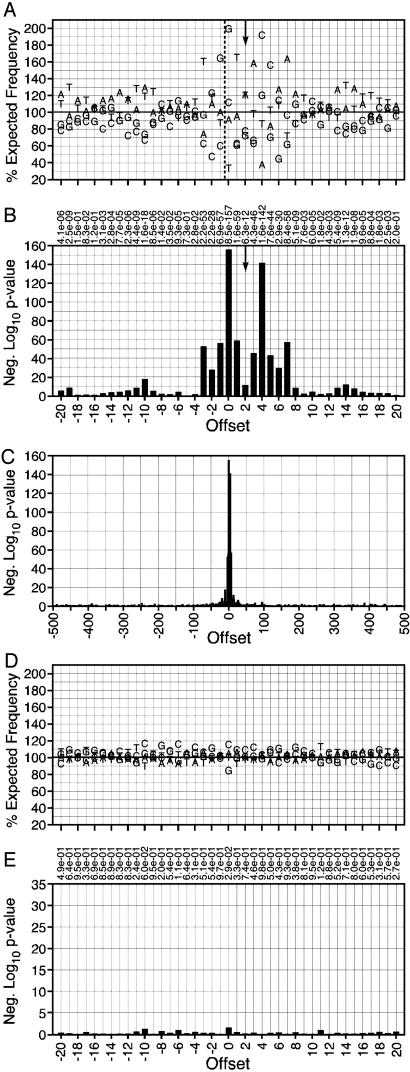
In a preliminary analysis, the five HIV-1 sequence sets revealed significant preferences at offsets as far as 19 bases 5′ and 15 bases 3′ from the integration site (Figs. 5-9, which are published as supporting information on the PNAS web site) that correlated across all five data sets (Fig. 10, which is published as supporting information on the PNAS web site). These five sets were then analyzed together as a combined HIV-1 data set, further clarifying the sequence preferred by the virus and expanding the region containing strongly preferred sites. The pattern [-3]TDG(int)GTWACCHA[7] (written by using standard International Union of Biochemistry mixed base codes) was preferred between offsets -3 and 7 with some bases appearing at frequencies up to 2-fold higher than expected yielding P values as low as 10-156 (Fig. 1 A and B and Table 3, which is published as supporting information on the PNAS web site). Preferred bases with P values <10-3 were found as far as 20 bases 5′ and 17 bases 3′ of the site of integration with particularly A-T-rich regions centered around positions -10 and 14. The bias for particular bases near the integration site is particularly clear when the P values for the base distribution are plotted for the entire 1-kb region flanking the integration site (Fig. 1_C_).
Fig. 1.
Base preferences directly surrounding cloned HIV-1 integration sites. (A) Preferences around the HIV-1 integration site. Base frequencies relative to the integration site of the 5′ LTR end are shown. The vertical arrow indicates the expected axis of symmetry based on the characteristic five-base spacing between the sites of HIV-1 DNA integration. The x axis shows the offset for each base from the integration site. Sequences have been aligned so that all integrations fall between offsets -1 and 0, as indicated by the black dashed vertical line. The y axis represents the percent of the expected frequency observed for each base (58% A/T, 42% G/C). The horizontal line is drawn at 100% of the expected frequency. (B) P values obtained by χ2 analysis comparing observed base frequencies with the expected frequencies. The y axis indicates the negative log10 of the P value. Taller bars indicate a more significant P value. Actual P values for each offset are shown at the top of the section. (C) Negative log10 of P values seen within the entire region 500 bases 5′ and 3′ from the integration site. (D) Base preferences directly surrounding mock integration sites in randomly selected genomic sites. Conventions are as in A.(E) P values of the base preferences surrounding mock integration sites in randomly selected genomic sites. Conventions are as in B.
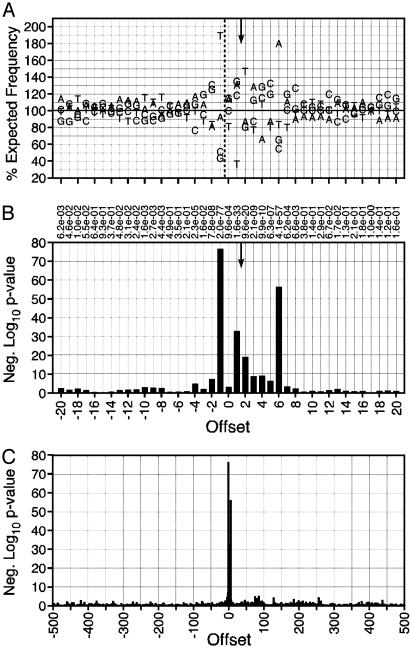
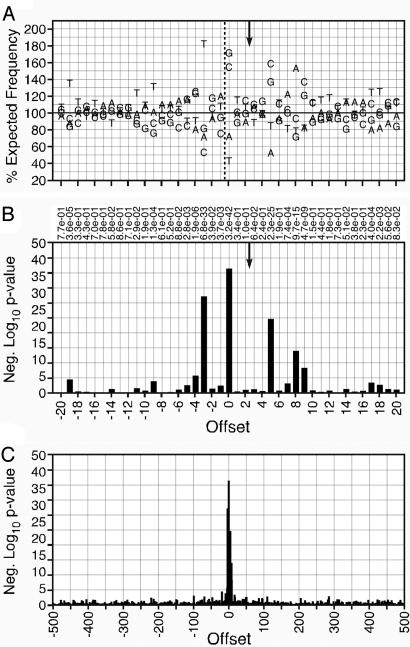
The MLV and ASLV data sets were analyzed by the same methods, with minor preprocessing of the Narezkina sequences† (Figs. 11-16, which are published as supporting information on the PNAS web site). Both viruses showed significant base preferences proximal to the site of integration and little preference distant from it (Figs. 2 and 3 and Tables 4 and 5, which are published as supporting information on the PNAS web site). The preferences found in the region of integration, [-4]DNST(int)VVTRBSAV[7] for MLV and [-4]ST-NN(int)SNNNNSNAAS[9] for ASLV contained individual bases occurring up to 2-fold more or 2-fold less often than expected, representing P values as low as 10-77. Among the three viruses, the patterns of base preferences showed similarity neither in the pattern of bases preferred nor in the sites at which a preference occurred. This result is consistent with the observation that different viruses produce different patterns of integration hot and cold spots (11). Likely, the base preferences observed alter the bending, twisting, or stacking of the DNA strand to produce a secondary structure optimal for interaction with a specific species of viral integrase.
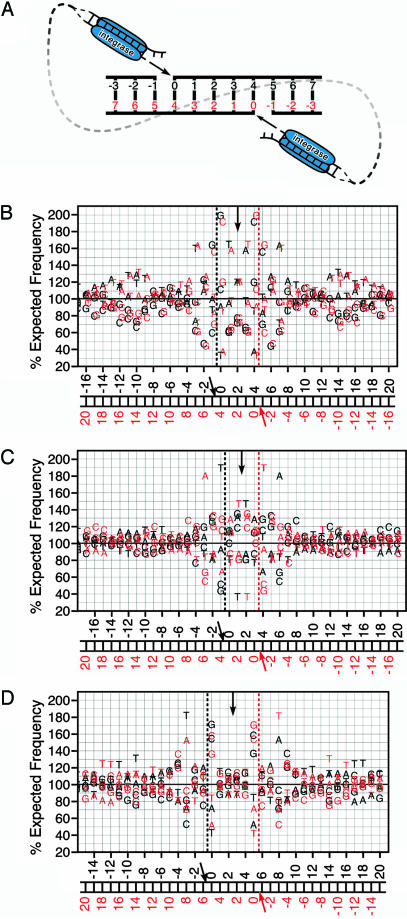
Further analysis of the preferred sequences revealed a striking symmetry that may provide important clues to the role of each LTR integrase complex in the targeting of the integration reaction. Integration is mediated by a presumably symmetrical complex of four integrase molecules, the two LTR ends, and some associated host factors. During integration, both 3′ ends of the viral DNA are inserted into the host DNA separated by four to six bases, depending on the viral species (6, 12). Therefore, for HIV-1 with its five-base separation, the base pair that represents offset 0 from one LTR integration also represents offset 4 observed from the perspective of the opposite LTR (Fig. 4_A_). To determine whether this predicted symmetry was represented in the pattern of preferred bases, we plotted the observed base preferences for each virus compared with the same preferences seen from the opposite LTR integrase complex.‡ HIV-1 exhibited a strong axis of symmetry at offset 2 corresponding to its five-base integration spacing (Fig. 4_B_, black vs. red lettering). This symmetry was retained through both preferred and avoided bases, for example, the preferred G/C pair at offset 0 and the avoided C/G pair at offset -2. Offsets as far as -15 upstream and 19 downstream showed complementarity to the corresponding offset, as seen by the opposing complex. This result strongly suggests that, for HIV-1, the topology of the double-ended integration reaction with its conserved 5-bp duplication is key in target site choice and is thus reflected in the base preferences observed surrounding the integration site. ASLV integration creates a six-base duplication, putting the predicted axis of symmetry between offsets 2 and 3. Complementary preferred and avoided bases were seen at all six sites that exhibit significant preferences (Fig. 4_D_, black vs. red lettering). MLV integration leads to four-base duplication of genomic DNA, corresponding to an axis of symmetry between offsets 1 and 2. In the MLV data, however, little complementarity was seen around this axis (Fig. 4_C_, black vs. red lettering). Thus, the strong symmetry seen with HIV-1 and ASLV is not a feature of retroviral DNA integration in general.
Fig. 4.
Comparison of the observed integration preferences to the inferred preferences for the opposite LTR. (A) Schematic of the topology of HIV-1 integration. HIV-1 integration complexes join the viral LTRs to opposite strands of the DNA separated by five bases. MLV joins with an offset of four bases, whereas ASLV uses a six-base offset (not pictured). (B) Symmetry observed in HIV-1 with five-base offset. Black lettering represents the base preference seen from the top LTR (Fig. 1). The integration site is indicated by the black dashed vertical line in the graph and the black arrow in the numbering schematic. The vertical arrow indicates the expected axis of symmetry based on the characteristic five-base spacing between the sites of HIV-1 DNA integration. The red lettering represents the same base preferences; however, they are reversed and shifted five bases to represent the preferences as observed from the bottom LTR. The inferred integration site is indicated by the red vertical line in the graph and the red arrow in the numbering schematic. (C) Symmetry observed in MLV with four-base offset. (D) Symmetry observed in ALV with six-base offset.
Fig. 2.
Base preferences directly surrounding cloned MLV integration sites. Conventions are as in Fig. 1, except that the symmetry is based on a four-base offset between integration sites.
Discussion
Because the expected symmetry exists in the preference patterns for HIV-1 and ASLV, both LTRs likely play a strong role in the targeting of the integration reaction, not necessarily acting together. The symmetry observed could be the result of either the interaction of the complex as a whole with a symmetric site or of either one complex or the other interacting with an asymmetric target DNA using the same site preference. There may be fundamental differences in MLV to preclude such symmetry. Possibly the asymmetric targeting of MLV may be due to the action of a single dominant LTR complex. These differences in symmetry would represent evidence of fundamental differences in the integration mechanisms of different retroviruses.
Fig. 3.
Base preferences directly surrounding cloned ASLV integration sites. Conventions are as in Fig. 1, except that the symmetry is based on a six-base offset between integration sites.
Our analysis has shown highly significant base preferences surrounding the integration sites of HIV-1, MLV, and ASLV, in some cases representing 2-fold higher- or lower-than-expected base frequencies. The patterns differ strikingly among viruses in both the sites at which preferences exist and the bases preferred at those sites. All bases are allowed at all sites; none is absolutely required or prohibited. The absence of an absolute consensus suggests that targeting mechanisms other than primary sequence recognition are involved. It is likely that structural characteristics optimal for interaction with integrase are shaped by the DNA primary sequence. Specificity of integration of retroviral DNA into chromosomal DNA is defined by a combination of several factors, including proximity to genes and/or transcriptional start sites (1, 3-5); transcriptional activity of the target DNA at the time of integration (1, 2); and, as exposed by our analysis, sequence of the integration target itself. Large regional effects may cause DNA to become accessible to the integration machinery, whereas microscale effects mediated by primary sequence seem to regulate actual target site choice. For HIV-1 and ASLV but not MLV, the symmetry of the integration reaction was reflected in the preferred bases, suggesting underlying differences in the way the virus interacts with DNA. Understanding how these specificities interact with one another is crucial to understanding the nature, mechanism, and importance of the overall specificity of the integration process.
Supplementary Material
Supporting Information
Acknowledgments
We thank Shawn Burgess of the National Human Genome Research Institute, National Institutes of Health (Bethesda, MD), for the gift of the Wu data sets; Anna Narezkina of the University of Pennsylvania School of Medicine (Philadelphia) for the gift of the Narezkina data sets; the Center for Gastroenterology Research on Absorptive and Secretory Processes (GRASP) at Tufts University for technical support, and Kurt Wollenberg for statistical consultation. This work was supported by National Institutes of Health Grant R01-CA-92192 (to J.M.C.). J.M.C. was a Research Professor of the American Cancer Society, with support from the F. M. Kirby Foundation. A.G.H. was supported by a National Institutes of Health Interdisciplinary Training Program in Cancer Genetics (NIH T32 CA65441).
Author contributions: A.G.H. and J.M.C. designed research; A.G.H. performed research; A.G.H. and J.M.C. analyzed data; and A.G.H. and J.M.C. wrote the paper.
Abbreviations: MLV, murine leukemia virus; ASLV, avian sarcoma/leukosis virus; LTR, long terminal repeat.
See Commentary on page 5903.
Footnotes
†
The Schröder, Wu, and Mitchell sequence sets are deposited in Genbank, with the integration site occurring at the 5′ followed by the cloned genomic sequence. The Narezkina set places the integration at either end of each sequence, depending on the strand to which the integration was mapped. The cloning of the Narezkina sequences used a single four-cutter restriction enzyme whose site was required in the final screening of the clones. Thus it was possible to reorient the sequences based on the occurrence of the restriction site at the 3′ end of the genomic sequence and to place the integration site at the 5′ end. In the few cases where neither or both ends showed a restriction site, the sequence was discarded from the analysis.
‡
Base preferences viewed from the opposite LTR were created by reversing the observed preferences and offsetting them four to six bases depending on the spacing seen between the LTR integration sites for each virus species.
References
- 1.Schröder, A. R., Shinn, P., Chen, H., Berry, C., Ecker, J. R. & Bushman, F. (2002) Cell 110**,** 521-529. [DOI] [PubMed] [Google Scholar]
- 2.Maxfield, L. F., Fraize, C. D. & Coffin, J. M. (2005) Proc. Natl. Acad. Sci. USA 102**,** 1436-1441. [DOI] [PMC free article] [PubMed] [Google Scholar]
- 3.Wu, X., Li, Y., Crise, B. & Burgess, S. M. (2003) Science 300**,** 1749-1751. [DOI] [PubMed] [Google Scholar]
- 4.Mitchell, R. S., Beitzel, B. F., Schroder, A. R., Shinn, P., Chen, H., Berry, C. C., Ecker, J. R. & Bushman, F. D. (2004) PloS Biol. 2**,** E234. [DOI] [PMC free article] [PubMed] [Google Scholar]
- 5.Narezkina, A., Taganov, K. D., Litwin, S., Stoyanova, R., Hayashi, J., Seeger, C., Skalka, A. M. & Katz, R. A. (2004) J. Virol. 78**,** 11656-11663. [DOI] [PMC free article] [PubMed] [Google Scholar]
- 6.Goodarzi, G., Chiu, R., Brackmann, K., Kohn, K., Pommier, Y. & Grandgenett, D. P. (1997) Virology 231**,** 210-217. [DOI] [PubMed] [Google Scholar]
- 7.Carteau, S., Hoffmann, C. & Bushman, F. (1998) J. Virol. 72**,** 4005-4014. [DOI] [PMC free article] [PubMed] [Google Scholar]
- 8.Kent, W. J. (2002) Genome. Res. 12**,** 656-664. [DOI] [PMC free article] [PubMed] [Google Scholar]
- 9.Karolchik, D., Baertsch, R., Diekhans, M., Furey, T. S., Hinrichs, A., Lu, Y. T., Roskin, K. M., Schwartz, M., Sugnet, C. W., Thomas, D. J., et al. (2003) Nucleic Acids Res. 31**,** 51-54. [DOI] [PMC free article] [PubMed] [Google Scholar]
- 10.Lander, E. S., Linton, L. M., Birren, B., Nusbaum, C., Zody, M. C., Baldwin, J., Devon, K., Dewar, K., Doyle, M., FitzHugh, W., et al. (2001) Nature 409**,** 860-921. [DOI] [PubMed] [Google Scholar]
- 11.Shibagaki, Y. & Chow, S. A. (1997) J. Biol. Chem. 272**,** 8361-8369. [DOI] [PubMed] [Google Scholar]
- 12.Goodarzi, G., Im, G. J., Brackmann, K. & Grandgenett, D. (1995) J. Virol. 69**,** 6090-6097. [DOI] [PMC free article] [PubMed] [Google Scholar]
Associated Data
This section collects any data citations, data availability statements, or supplementary materials included in this article.
Supplementary Materials
Supporting Information


