Structure of RsrI methyltransferase, a member of the N6-adenine β class of DNA methyltransferases (original) (raw)
Abstract
DNA methylation is important in cellular, developmental and disease processes, as well as in bacterial restriction–modification systems. Methylation of DNA at the amino groups of cytosine and adenine is a common mode of protection against restriction endonucleases afforded by the bacterial methyltransferases. The first structure of an _N_6-adenine methyltransferase belonging to the β class of bacterial methyltransferases is described here. The structure of M·_Rsr_I from Rhodobacter sphaeroides, which methylates the second adenine of the GAATTC sequence, was determined to 1.75 Å resolution using X-ray crystallography. Like other methyltransferases, the enzyme contains the methylase fold and has well-defined substrate binding pockets. The catalytic core most closely resembles the _Pvu_II methyltransferase, a cytosine amino methyltransferase of the same β group. The larger nucleotide binding pocket observed in M·_Rsr_I is expected because it methylates adenine. However, the most striking difference between the _Rsr_I methyltransferase and the other bacterial enzymes is the structure of the putative DNA target recognition domain, which is formed in part by two helices on an extended arm of the protein on the face of the enzyme opposite the active site. This observation suggests that a dramatic conformational change or oligomerization may take place during DNA binding and methylation.
INTRODUCTION
DNA methylation in bacteria acts as a protective ‘immune response’ to destroy invading foreign DNA (1–3). The type II restriction–modification (R-M) systems that perform this function are each composed of two enzymes, a restriction endonuclease and a methyltransferase (MTase). In typical R-M systems the MTases transfer a methyl group from _S_-adenosyl-l-methionine (AdoMet) to the C5 position of the cytosine base or to the exocyclic amino group of either cytosine or adenine bases within a specific DNA sequence of the host DNA, while the endonuclease cleaves foreign DNA at the same specific DNA sites that lack methylation. The protective effect of methylation for the host has ensured the propagation and expansion of this system throughout the bacterial and archaeal kingdoms (2,3).
Each of the more than 100 type II MTases that have been sequenced can be classified into one of four main groups, based on methylation target and domain structure (3). In addition, two classes of type II restriction MTases are distinguished by the DNA position that is methylated. One class methylates the C5 position of the cytosine pyrimidine ring yielding _C_5-methylcytosine (5mC) and the other class methylates the exocyclic amino nitrogen atoms of cytosine or adenine forming _N_4-methylcytosine (N4mC) and _N_6-methyladenine (N6mA), respectively. Sequence analyses reveal that all C5 MTases contain a set of 10 consecutive conserved blocks of amino acid residue motifs (I–X) and a variable region near the C-terminus that makes up part of the target recognition domain (TRD) that is responsible for sequence-specific DNA recognition (4–7). The amino MTases contain only nine of the 10 conserved sequence motifs (I–VIII and X), which are arranged in several distinct orders giving rise to the subclassifications α, β and γ (Table 1; 8). Each group is dominated by a specific MTase family; the α group almost exclusively contains N6mA MTases, the β group contains mainly N4mC MTases and several N6mA MTases and the γ group contains N6mA MTases (7,8). Structural studies of several MTases from these groups show that the spatial positioning of the MTase functional regions required for AdoMet binding and catalysis of methyl transfer are maintained, despite the different sequential motif orders (4,9–12). However, the sequence-specific DNA binding domain, TRD, differs among the MTase classes in sequence and spatial position (8).
Table 1. DNA methyltransferase classifications.
| Family | Groupa | Motifsb | Enzymes |
|---|---|---|---|
| C5 | γ-like | I, II, III, IV, V, VI, VII, VIII, TRD, IX, X | M·_Hha_I, M·_Hae_III (C5mC)c |
| Amino | α | X, I, II, TRD, III, IV, V, VI, VII, VIII | M·_Dpn_M (N6mA)c |
| Amino | β | IV, V, VI, VII, VIII, TRD, X, I, II, III | M·_Pvu_II (N4mC), M·RsrI (N6mA)c |
| Amino | γ | X, I, II, III, IV, V, VI, VII, VIII, TRD | M·_Taq_I (N6mA)c |
The proposed mechanism of methylation for the amino MTases differs from that observed for the C5 MTases (11). Rather than employing a covalent intermediate between a nucleophilic cysteine thiol of the enzyme and C6 of the cytosine base as a means of activating the C5 carbon for methyl addition (13,14), methylation at the exocyclic amino position likely occurs with deprotonation of the nitrogen being methylated, as shown in Figure 1. The proposed mechanism for the amino MTases involves a direct methyl transfer to the exocyclic amino group with inversion of configuration around the methyl carbon (11,15,16). A tyrosine residue in the vicinity of the active site has been identified in photo-crosslinking studies with 5-iodouracil (17). This tyrosine resides in the amino MTase motif IV, a highly conserved X1PPX2 sequence, where X1 is Asp, Asn or Ser and X2 is Tyr or Phe. This motif is positioned for involvement in catalysis (11,12) and also corresponds to the PC motif that is involved in the C5 MTase mechanism of formation of the covalent enzyme–DNA adduct (18). Some mutations in the X1PPX2 motif IV sequence abolish catalytic activity (17,19–22), while others affect AdoMet binding (18). In the proposed mechanism the aromatic residue at position X2 could stabilize the target base via stacking interactions, the main chain carbonyl between the two prolines could interact with the target amine via a hydrogen bond and X1 could facilitate deprotonation of the target amine. Methyl transfer would then occur by nucleophilic attack by the deprotonated target amine on the methylsulfonium group of AdoMet (11).
Figure 1.

Proposed catalytic mechanism of amino methylation by DNA methyltransferases.
For this mechanism to operate in a manner consistent with the known structures of the cytosine amino MTase _Pvu_II (11) and the adenine MTases _Taq_I (12) and _Dpn_M (10) the target base would have to be flipped out of the DNA duplex in order to enter the enzyme active site. Such base flipping has been observed directly in structural studies of the C5 MTases (9,23) and indirectly in numerous functional studies of both C5 and amino MTases. Fluorescence spectroscopy of the _Eco_RI adenine amino MTase shows that the target base is likely removed from the stacked bases of the double helix (24,25). Recent studies on the isocatalytic M·_Rsr_I show similar behavior (26). In addition, DNA fragments that have a base mismatch or an abasic site opposite the target base are bound better by the amino MTases, which is also consistent with a base flipping mechanism (25,26). Another unresolved question is how the amino MTases of different classes recognize DNA with a high degree of specificity. The structure, which has recently been determined (E.Weinhold, personal communication), of M·_Taq_I bound to DNA will show how the γ class of adenine MTases achieve base flipping and specificity. However, this class differs dramatically from the β class in structure and location of the TRD. Furthermore, for the β class of enzymes, the TRD region is not well defined in the crystal structure analysis of _Pvu_II MTase, because of disorder in the crystal (11).
In order to understand the mechanisms of catalysis and sequence specificity of the N6mA β class of amino MTases, we are studying the Rhodobacter sphaeroides (_N_6-adenosine) DNA MTase (M·_Rsr_I) (27,28). M·_Rsr_I is isocatalytic with M·_Eco_RI and methylates the second adenine of GAATTC at the N6 position. We have crystallized M·_Rsr_I and describe the structure determination, analyses and comparison of the M·_Rsr_I structure to other DNA MTases. The implications of these observations and the correlation with biochemical and mutagenesis results will be discussed (26,29).
MATERIALS AND METHODS
Overexpression, purification and crystallization
The DNA encoding M·_Rsr_I was subcloned into pET28a (Novagen), to create pET28a+::rsrIM. PCR primers d(GCTCTAGAATGGCAAACCGATCTCA) and d(AAGGATCCGAATTCTATGAAGCAACATCTCC) were used to amplify the rsrIM gene (∼1 kb) from the source plasmid, pTRC99A::rsrIM (29). The _Xba_I and _Eco_RI recognition sequences are underlined. The _Xba_I and _Eco_RI digested PCR product was inserted into the _Nhe_I and _Eco_RI sites of the pET28a+ vector, which places the initiator methionine of M·_Rsr_I in-frame in front of sequences encoding an N-terminal 23 amino acid residue tag that contains six histidines and a thrombin cleavage site.
Bacterial production of histidine-tagged M·_Rsr_I from pET28a+::rsrIM was carried out in Escherichia coli strain BL21(DE3) (Novagen) in rich medium (LB) at 37°C. Protein production was induced by the addition of isopropyl-β-d-thiogalactoside to 1 mM at an OD600 of 0.6–0.8. Cells were harvested 6 h after induction by centrifugation at 10 000 g. Cells were lysed by sonication and cell debris was removed by centrifugation at 16 000 g. The crude cell lysate was passed through a 0.22 µm nitrocellulose filter, loaded onto a nickel column and washed with 10 column vol of 20 mM phosphate, pH 8.0, 500 mM NaCl and 10 mM imidazole. The protein was eluted by increasing the concentration of imidazole. The purity of the eluted protein was examined by SDS–PAGE analysis and the concentration determined by UV absorbance at 280 nm (Am = 48.7 × 10³ M–1cm–1) (27). Typical results gave 6 mg purified protein/g wet cell paste of single-band purity on a silver stained SDS–PAGE gel (>95% pure; not shown). The A280/A260 ratio of the purified protein was 1.4, indicating little contamination by nucleic acids or cofactors (see below for a discussion of the occupied AdoMet binding pocket of the enzyme in the structure). The purified protein was transferred to 20 mM Tris, pH 8.5, 300 mM KCl, 10 mM EDTA and 10 mM β-mercaptoethanol using a 5 ml desalting column (G25 Sepharose; Pharmacia) and stored at –80°C.
The selenomethionine (SeMet) derivative of the protein was produced from the same expression plasmid in a methionine auxotroph, E.coli strain B834(DE3) (Novagen). Cells were grown in M9 minimal medium supplemented with Basal Medium Eagle vitamins, 0.17 mM CaCl2, 1 mM MgCl2, 0.035 mM FeCl3, 2.5% glucose and 25 mg/l SeMet. The protein purification protocol was identical to that used for the native protein and similarly pure protein was obtained based on silver stained SDS–PAGE analysis.
M·_Rsr_I was diafiltered prior to crystallization trials. Crystallization conditions were found using a sparse matrix screen (30). After optimization, the best crystallization conditions were 1.5 M Li2SO4, 100 mM HEPES, pH 7.4, 0.5% NaN3 and 10 mM EDTA. Typical crystals were chunky plates of 400 × 400 × 50 µm3. The M·_Rsr_I SeMet derivative crystallized under the same conditions as the native protein, producing crystals of nearly identical morphology.
Data collection, MAD phasing and structure determination
Native data from a single M·_Rsr_I crystal were collected at Brookhaven National Synchrotron Light Source on beam line X12C. M·_Rsr_I crystallized in the space group C2221 with cell dimensions of 70.42 × 130.25 × 67.28 Å3 and data were collected to 1.70 Å resolution. These data were processed and scaled using the program HKL2000 (31). The solvent content of the unit cell was estimated at 31%, consistent with one molecule per asymmetric unit.
Multiwavelength anomalous dispersion (MAD) methods were used to obtain phases for the structure solution. Data at four wavelengths to 2.83 Å resolution were collected at the Advanced Photon Source at Argonne National Laboratory on the SBC 19D beam line on a single SeMet derivative M·_Rsr_I crystal. The crystal was of the same space group as the native and had similar cell dimensions. MAD data collection was performed as described previously (32,33). The four wavelengths were selected on the basis of an X-ray fluorescence spectrum collected directly from the crystal, which was analyzed by the program CHOOCH (G.Evans, 1994, available at http://lagrange.mrc-lmb.cam.ac.uk/doc/gwyndaf/Chooch.html ). The four wavelength MAD data set was processed and scaled using HKL2000 (31). Details of the MAD data collection and processing are given in Table 2. The program SOLVE (34) was used to find the Se positions within the unit cell. SOLVE found four of the possible 11 selenium atom sites and these coordinates were used as initial starting points in the program SHARP (35), which allowed location of three additional Se sites. The positions of these seven Se sites were confirmed by visual inspection of anomalous and dispersive Patterson maps. Solvent flattening using Solomon as implemented within SHARP was used to improves the phases.
Table 2. Statistics of experimental SeMet MAD data.
| | λ1 | λ2 | λ3 | λ4 | Native | | | ------------------------------ | ------- | ------- | ------- | ------- | ------------------- | | Wavelength (Å) | 1.07813 | 0.97947 | 0.97921 | 0.94645 | 1.0 | | Resolution range (Å) | 20–2.8 | 20–2.83 | 20–2.83 | 20–2.83 | 20–1.75 (1.81–1.75) | | Completeness (%) | 78.7 | 85.4 | 84.6 | 87.7 | 94.2 (93.9) | | _R_syma | 0.055 | 0.063 | 0.085 | 0.067 | 0.035 (0.242) | | <_I_/σ> | 7.8 | 8.9 | 10.2 | 10.1 | 13.2 (4.3) | | Observed reflections | 73 795 | 77 962 | 121 979 | 80 609 | 69 339 (2873) | | Unique reflections | 7025 | 7621 | 7552 | 7831 | 20,741 (2281) | | Anomalous pairs | 6064 | 6660 | 6570 | 6806 | | | Phasing powerb | 0.16 | 2.50 | 2.04 | | | | _R_-Krautc | 0.42 | 0.38 | 0.27 | | | | _R_-Cullisd | 0.70 | 0.51 | 0.56 | | | | Overall figure of merite | | | | 0.45 | | | _R_factorf | | | | | 0.21 (0.27) | | _R_freef | | | | | 0.24 (0.28) | | Non-hydrogen protein atoms | | | | | 2135 | | Waters | | | | | 227 | | r.m.s. deviation from ideality | | | | | | | Bond lengths (Å) | | | | | 0.006 | | Bond angles (°) | | | | | 1.15 | | Dihedrals (°) | | | | | 22.66 | | Impropers (°) | | | | | 0.08 |
The initial model was generated by the program ARP/wARP (36) from maps made by applying the phase information from the MAD solution to the high resolution native data and using the phase extension protocol of DM from the CCP4 suite of programs (37). O (38) was used to build and refit the model to the native data and the maximum likelihood procedure implemented in CNS (39) was used for model refinement. OOPs (40) and PROCHECK (41) were used to evaluate the model geometry. Numerous cycles of model rebuilding/refitting followed by model refinement with individual B factor refinement were used to obtain the final model. A series of simulated annealing omit maps were generated to confirm the correctness of the model during model building. Water molecules were identified automatically using CNS by peak searches of both 2Fo – Fc and Fo – Fc Fourier maps using the following criteria: peak height in Fo – Fc maps must be >1.5σ and the position must be 2.2–3.4 Å from any hydrogen acceptor or hydrogen donor atoms. The water molecules were refined as above with the protein model and were deleted if their minimum real space correlation was less than 0.5 or occupied an electron density of <1.2σ in 2Fo – Fc maps. In addition to the protein, the model included eight residues in alternate conformations (R39, R87, K184, K191, R202, R209, V231 and E278) and 227 water molecules. At this point, electron density within the putative AdoMet binding pocket was observed in Fo – Fc maps contoured at 1.2σ, indicating that this site of the protein was occupied. The best fit to the electron density as judged by R value and omit map density was for the AdoMet breakdown product 5′-methylthioadenosine (5′-MTA) (42), which refines best with an occupancy of 1 and B factors similar to the surrounding protein atoms. The selenium atoms used for MAD phasing were found at or near the refined sulfur atom positions in methionines 71, 79, 126, 132, 146, 188 and 210. Protein numbering begins at the N-terminus of the protein proper and does not include the histidine tag.
Structural analysis
Secondary structure determination was performed using the program PROMOTIF (43), which implements the DSSP algorithm of Kabsch and Sander (44). Hydrogen bonding interactions within the protein were identified by the program HBPLUS (45). The nomenclature of Schluckebier et al. (46) and Posfai et al. (5) was used for secondary structure assignment and conserved motifs, respectively. Loops and turns are designated by their flanking secondary structures and their classification is consistent with Ring et al. (47) and Wilmot and Thornton (48).
The structures of the previously determined MTases were obtained from the PDB entries [M·_Pvu_II (11), 1BOO; M·_Hha_I (4), 1MHT; M·_Hae_III (9), 1DCT; M·_Taq_I (12), 2ADM; M·_Dpn_M (10), 2DPM]. The universally conserved positions of the Rossmann-based methylase fold as determined by Mirny and Shakhnovich (49), M·_Rsr_I residues 61–63, 84–91, 245–248 and 267–271, were used to align the previously determined MTases to M·_Rsr_I using LSQMAN (50). The root mean square deviation for main chain atoms (including Cβ where applicable) of similar structural elements of the methylase fold in the aligned MTases was determined using LSQMAN.
The program GRASP (51) was used to generate molecular surface models of the MTases to which electrostatic potential, calculated using the Poisson–Boltzmann equation, was applied. Residues Arg, Lys, Asp and Glu were used to calculate the electrostatic potential.
Coordinate deposition
Atomic coordinates have been deposited in the Protein Data Bank under accession number 1EG2.
RESULTS AND DISCUSSION
Histidine-tagged M·_Rsr_I, which consists of 342 amino acids (319 amino acids of the full-length protein plus 23 from the His tag at the N-terminus), was crystallized and native data were collected to 1.70 Å resolution. The structure was phased using MAD methods (52,53) with data to 2.83 Å from crystals of the SeMet-substituted protein (Table 2). A section of the experimental electron density map in Figure 2 shows clear electron density and connectivity, which is present throughout most of the protein in the crystal. The initial model, obtained from the automated building program ARP/wARP (36), consisted of six chains composed of 220 amino acids with a connectivity index of 0.93. After several cycles of refinement using CNS (39) and manual rebuilding using O (40), the final model was refined to a resolution of 1.75 Å with a crystallographic R value of 0.21 and an _R_free value of 0.24 (Table 2; 54). Although, the model is well refined, significant regions of the protein, which include 58 residues at the N-terminus (23 residues of the His tag and 35 residues of M·_Rsr_I), five residues at the C-terminus (315–319) and nine residues of a loop (288–296) were not included in the model due to weak electron density from disorder in the crystal. Therefore, the final model consists of two chains composed of 270 amino acids (residues 36–287 and 297–314), eight residues with alternate conformations, one 5′-MTA and 227 water molecules. The stereochemistry of the model is excellent, with r.m.s. deviations from ideality of bond angles and bond lengths well within acceptable limits.
Figure 2.

Stereo view of a representative section of the experimental electron density map contoured at 1.4σ at 1.75 Å resolution. The model in the catalytic region near the DPPY motif and the DPPY motif itself are superimposed on the map. Phase information from the MAD SeMet M·_Rsr_I data was used to extend the phases to the resolution of the 1.75 Å native data. This figure was generated using SETOR (56) and Photoshop (Adobe).
Overview of the M·_Rsr_I structure
The overall structure of M·_Rsr_I, shown in Figure 3, is bilobal with a V-shaped cleft and a large protruding arm. It contains nine β-strands, nine α-helices, two 310-helices, 11 β-turns, one β-hairpin turn, one ψ-loop, two β-α-β units and a number of different types of loops and turns (Tables S1 and S2 of Supplementary material). The central core of the enzyme is composed of a twisted, nine stranded β-sheet flanked by seven α-helices with a strand order of β9↑, β3↑, β2↑, β1↑, β4↑, β5↑, β7↓, β6↑ and β8↑. The α-helices H, C, D and E flank one face of the β-sheet and α-helices B, A and Z flank the other, creating the methylase fold tertiary structure seen in all previous structures of MTases (46). A hairpin turn between β-strands β6 and β7, composed of 14 residues (142–155), generates the only anti-parallel β strand in the large β-sheet of the protein. The two β-α-β units consist of β4-D1(310-helix)-D-β5 and β1-A-β2. The catalytic DPPY motif lies in the cleft between the two lobes at the base of a loop (motif IV) between strand β4 and the D1 helix. The large protruding arm, which is composed of a loop with two α-helices (F and G) and one 310-helix (F1), is included in the region of the protein considered to be the TRD.
Figure 3.
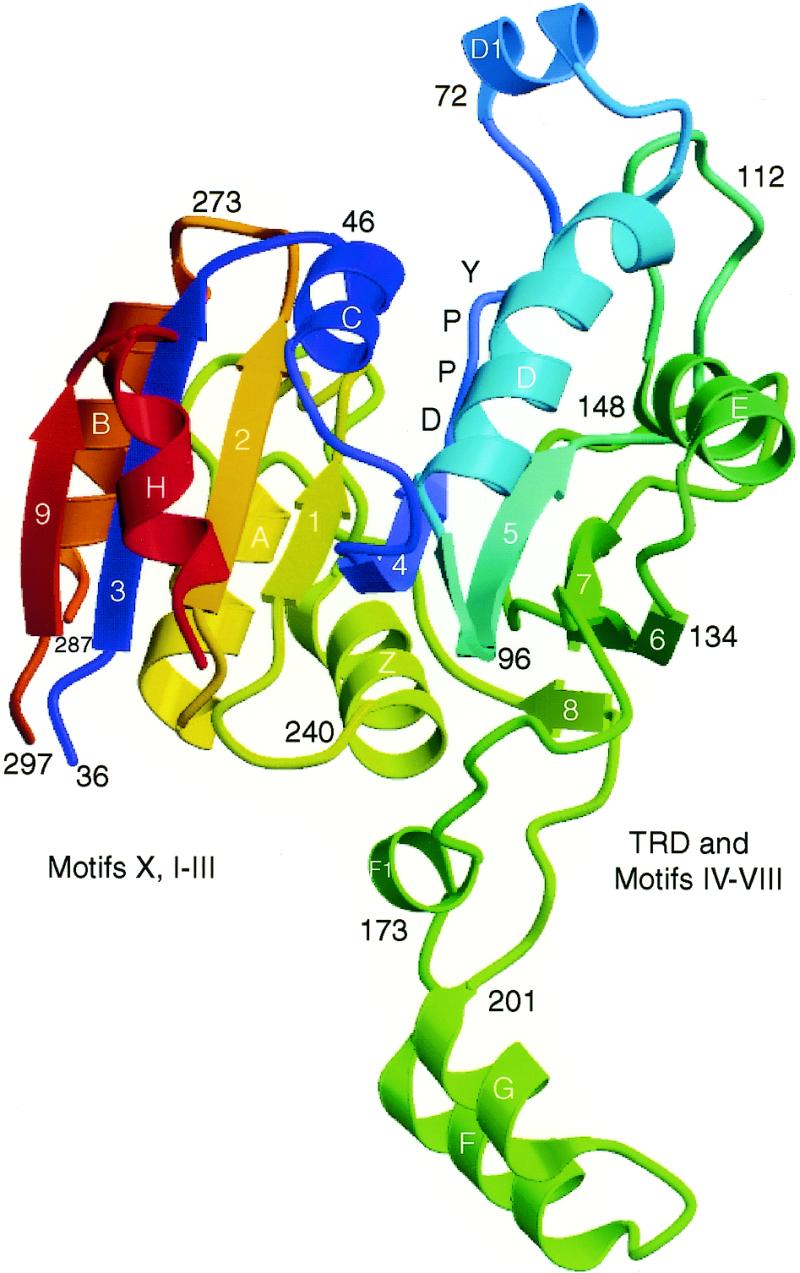
Ribbon diagram of M·_Rsr_I. The catalytic domain containing the methylase fold is to the left of the central V-shaped cleft and the TRD domain is to the right. Rainbow coloring from blue through green to red indicates the N- to C-terminal position of the residues in the model. The helices are lettered and β-strands numbered in white and other residue positions are labeled in black. The catalytic DPPY motif is labeled in blue, indicating its position at the base of the loop that contains helix D1. The diagram was made using MOLSCRIPT (57), Raster3D (58) and Photoshop (Adobe).
The structure is recognizable as a MTase. Five other MTase structures have been determined: M·_Hha_I (4), M·_Hae_III (9), M·_Pvu_II (11), M·_Taq_I (12) and M·_Dpn_M (10). Figure 4 illustrates the topology of the secondary structural elements in comparison with these structurally characterized MTases (4,9–12,23). The M·_Rsr_I methylase fold contains the central seven-stranded sheet sandwiched by six α-helices with two additional β-strands and one additional α-helix flanking the β-sheet (46). The organization of the various motifs in the protein structure and topology diagram is similar to the other MTase classes and is most similar to the cytosine amino MTase _Pvu_II (11).
Figure 4.

Diagram of secondary structure profiles of six methyltransferase structures, M·_Rsr_I, M·_Pvu_I, M·_Dpn_M, M·_Taq_I and M·_Hha_I/M·_Hae_III, aligned based on the common structural elements. M·_Hha_I and M·_Hae_III can be represented by one diagram. All six MTases have a core structure similar to that represented by M·_Hha_I, with the motif positions illustrated at the top of the diagram. Variations among the MTases include additional secondary structural elements located in loop regions. The catalytic X1PPX2 location is denoted by labeled amino acids. Dashed lines represent regions of the structures that were not modeled. The starred positions in the M·_Rsr_I schematic diagram represent the locations of mutations L72P and D173A. This diagram was made using ShowCase.
AdoMet and nucleotide binding regions of M·_Rsr_I
Of the known MTase structures, M·_Hha_I and M·_Hae_III (C5 MTases) were co-crystallized as covalent DNA adducts with and without bound AdoMet derivatives (4,9,23), respectively, and the other three are exocyclic amino MTases and were determined with either AdoMet, the product _S_-adenosyl-l-homocysteine (AdoHcy) or the inhibitor sinefungin in the active site (10–12). Thus, all of the known structures contain either DNA, substrates/inhibitors or both. The M·_Rsr_I crystals were grown without added substrate, product or inhibitor, but an Fo – Fc electron density map revealed the presence of a 5′-MTA-like species (42) in the AdoMet binding pocket (Fig. 5). This strongly suggests that M·_Rsr_I requires cofactor binding at the AdoMet site for protein stability or for crystallization. 5′-MTA is also capable of stabilizing DNA binding by M·_Rsr_I in electrophoretic mobility shift experiments, as do other cofactor analogs (C.Thomas, unpublished results; 26).
Figure 5.

The 5′-MTA contacts within the M·_Rsr_I active site. Stereo view of the 5′-MTA (navy) in an Fo – Fc electron density map (red) contoured at 1.0 σ, which was produced by omitting the 5′-MTA from the model during simulated annealing refinement and map calculations. The surrounding residues contact the 5′-MTA and apparent hydrogen bonds are shown as green lines. This figure was generated using SETOR (56) and Photoshop (Adobe).
Structural alignment of M·_Rsr_I with the other MTase structures reveals a higher degree of similarity to M·_Pvu_II than to the other MTases; the root mean square deviation (r.m.s.d.) for the equivalent residues of the methylase fold between M·_Rsr_I and M·_Pvu_II is <1.5 Å (Table 3). The protein folds, summarized in Figure 4, also reveal a strong similarity between M·_Rsr_I and M·_Pvu_II, as expected, since both are members of the β subclass of MTases having the same conserved motif order. Based on the sequence and structural similarities with other known MTase structures, the lobe of M·_Rsr_I (on the left in Fig. 3) that contains motifs I–III and X is involved primarily in AdoMet binding and catalysis and the other domain, including the protruding arm, contains the TRD and motifs IV–VIII. The circular permutation of the motif order that distinguishes the β class from the other MTases is summarized in Table 1 and is shown in Figure 4. In the protein sequence shown, motif IV is at the N-terminus and starts in the left-most lobe of the structure (in Fig. 3) before joining with motifs V–VIII in the structural domain on the right.
Table 3. Structural homology of methyltransferases.
| | M·_Hha_I | M·_Hae_III | M·_Pvu_II | M·_Taq_I | M·_Dpn_M | | | ---------------------- | ---------- | --------- | -------- | -------- | ---- | | Number of atomsa | 392 | 391 | 394 | 330 | 396 | | r.m.s.d. distance (Å)b | 3.17 | 3.16 | 1.13 | 3.06 | 3.78 |
M·_Rsr_I is similar overall to the other MTases in the region of the substrate binding pockets. The view (Fig. 6) of the MTases from the top and rotated 180° with respect to the view in Figure 3 places the X1PPX2 loop and the D1 helix at the top (of the figure) and the substrate binding pocket in the middle of the surface. The models that have AdoMet or AdoHcy illustrate the relative positions of the substrates in other MTases. The 5′-MTA moiety in the M·_Rsr_I, structure is not shown to illustrate the binding pocket shape, although it superimposes well with the AdoHcy in M·_Pvu_II and has similar contact residues (Figs 5 and 6). A large substrate binding pocket is clearly visible in M·_Rsr_I, which in the absence of AdoMet is slightly electronegative. In M·_Rsr_I, residues 249–253 of motif I on β-strand 1 and the N-terminus of α-helix A, residues 223–227 of motif X at the N-terminus of α-helix Z and residues 270–275 of motif II in β-strand 2 and α-helix B form the lower right-most side of the AdoMet binding pocket. The upper left-most side of the pocket is lined by residues 65–67 of motif IV, at the C-terminal end of β-strand 4, and by motif V, near the N-terminal end of α-helix D. This pocket is negatively charged, which will attract as well as partially neutralize the positive charge of the amine and methylsulfonium groups of AdoMet. The sulfur position of the AdoHcy molecule in the M·_Pvu_II–AdoHcy complex indicates that the methyl group would be directed towards the partially negatively charged pocket to the left of the AdoMet binding pocket. This unfilled pocket is likely the flipped target adenine nucleotide binding site and would appear to be more neutrally charged once the slightly positive AdoMet is bound.
Figure 6.

Electrostatic surface potential of the four amino methyltransferases. This view of the V-shaped cleft separating the catalytic domain (on the right) from the TRD (on the left) is rotated about the vertical axis by ∼180° and tilted toward the viewer by ∼90° with respect to the view in Figure 3. The structures have been aligned as described in Materials and Methods. Cofactors are included in several of the diagrams. Purple/bue shading represents positive potential and red negative potential, based on surface potentials calculated using GRASP (51).
Closer inspection of the molecular surface models of the enzymes (Fig. 6) reveals that M·_Rsr_I has a larger nucleotide binding pocket than that of M·_Pvu_II, which is consistent with the size of the target base that must be accommodated, adenine for M·_Rsr_I and cytosine for M·_Pvu_II. Residues from motifs IV (65–67) and X (223–227) are likely to interact with the flipped adenine and with AdoMet. In contrast, residues 105–109 of motif VI and two regions, 140–145 and 154–157, of motif VIII appear to be able to interact only with an adenine nucleotide. The classically described motifs III and VII (8) are not in proximity to the substrate binding surface, but the structure of the β class enzymes bound to DNA has not yet been determined. Thus, the role in DNA binding of these motifs is unknown.
Target recognition by M·_Rsr_I
DNA binding, base flipping and sequence-specific DNA recognition are accomplished by an array of loops and conserved sequences of the known MTases (8,9,23). These include three of the same motifs that bind the adenine nucleotide as discussed above, residues 65–81 (motif IV), 109–114 (motif VI) and 144–155 (motif VIII). A structured loop formed from β-strands 6 and 7 and the intervening β-hairpin turn (residues 132–161), at the slightly basic protrusion at the lower left side of the substrate binding pocket in Figure 6, is similar in structure to loops in other MTases that have been implicated in DNA binding (10,13). In M·_Rsr_I this region contains Arg150, Phe151 and Phe152 at the tip of the loop, which could interact with the DNA through electrostatic or hydrophobic interactions in the minor groove. This interaction would be similar to that proposed for the _Dpn_M MTase, and the M·_Pvu_II structure has a similar protruding region with an Arg at a comparable position to Arg130 and Ile and Val as the corresponding hydrophobic residues (10,11). The variation in residue composition of this region of the β subgroup of amino MTases may indicate a possible role in DNA binding.
In addition to these loops, the region between motifs VIII and X, residues 160–225, including the C-terminus of β-strand 4 and four additional β-strands (5–8), two α-helices (D and E) and one 310-helix (D1) form another part of the TRD in M·_Rsr_I. Specifically, residues 220–225, between motifs VIII and X, form a slightly basic hydrophobic ridge that may interact with the DNA. Interestingly, the bulk of the TRD region, defined by its lack of homology with the classical motifs, residues 165–210, forms the protruding arm of the enzyme. It is connected to the large domain by a loop (β7–F1) and the short β-strand 8, which continues the β-sheet with β-strand 6. The helices forming the helix–turn–helix at the tip of this loop are unique in structure and do not resemble the canonical helix–turn–helix motif or any other structure in the PDB. A comparison of helices F and G to DNA recognition helices in eukaryotic transcription factors based on the work of Suzuki (55) revealed no similarities to known DNA binding helices. The amino acid sequence is consistent with DNA binding because a number of basic and hydrophilic residues reside in this region.
Interestingly, the position of the protruding arm is on the opposite face of the protein from the active site. One possibility is that a movement of the helix–turn–helix portion of the loop of ∼40 Å would bring it near to the active site V-cleft facilitating its putative interaction with DNA. The residues that join the loop and the bulk of the protein are solvent accessible and appear to be stabilized by numerous hydrogen bonds and ion pairs, as discussed below. There is a small β-sheet formed by β-strands 6–8 that could be disrupted by DNA binding, resulting in a large hinge movement to bring the TRD to the DNA. Another possibility is that the enzyme may dimerize or oligomerize. Further, sequence analyses (29) strongly suggest conservation of sequence in this region among the β class members that is dependent on the DNA sequence of the target binding site; enzymes recognizing GAA differ in this region from those that recognize CCCGGG. The position of the TRD in the three MTase classes appears to differ in part because of circular permutation of the motif order. The location of the protruding arm in M·_Rsr_I appears to be more similar to the TRD protrusion of M·_Taq_I than to the other MTase classes, as seen in Figure 6 comparing the TRD location of M·_Dpn_M to M·_Taq_I. Since the β class of enzymes lack a large TRD near the active site and the F and G helices are in a region proposed to contain the TRD, it is likely that this region will be somehow involved in DNA recognition.
Comparison of M·_Rsr_I to M·_Pvu_II
In spite of the overall similarity between M·_Rsr_I and M·_Pvu_II (11), several significant differences exist between the crystal structures in four loop regions, at the N- and C-termini and in the TRD region, evident in Figure 7. The positions of residues in motif IV, M·_Pvu_II residues 55–72, which are equivalent to 67–81 in M·_Rsr_I, are slightly different, possibly due to crystal packing interactions. The loop encompassing residues 107–118 of M·_Rsr_I (motif VI) is shorter than and is shifted in position from the equivalent residues (98–111) of M·_Pvu_II, possibly because of different crystal packing environments. The loop equivalent to residues 142–154 (motif VIII) of M·_Rsr_I is formed by a longer polypeptide segment, which contains a small α-helix in M·_Pvu_II (residues 135–155). Another loop that differs significantly comprises M·_Rsr_I residues 218–222 (between motifs VIII and X), which are equivalent to residues 231–245 and include a small α-helix (residues 235–242) extending from M·_Pvu_II. Despite these differences in the loop structures, the catalytic residues X1PPX2, in motif IV, for M·_Rsr_I and M·_Pvu_II are nearly superimposable, as seen in Figure 7C. The X2 side chain (Tyr for M·_Rsr_I and Phe for M·_Pvu_II) differs in the way that it packs into the hydrophobic core of each protein, but the carbonyl oxygen between the Pro residues and the nucleophilic oxygen of the Asp or Ser that are implicated in catalysis (Fig. 1) are clearly aligned to participate similarly in N6 amino stabilization and methyl transfer.
Figure 7.

Comparison of M·_Rsr_I and M·_Pvu_II. (A) Alignment of M·_Rsr_I and M·_Pvu_II sequences on the basis of common structural elements. The secondary structure designations of α for α-helix, β for β-strand and 3 for 310-helix indicate the positions of these secondary structure elements in M·_Rsr_I. The M·_Rsr_I sequence numbering is directly below its sequence. The regions that differ significantly between M·_Rsr_I and M·_Pvu_II are underlined and those that are not represented in the structures are also italicized. The detailed structural assignments and loop assignments are available as Supplementary Material (Tables S1 and S2). (B) Stereo diagram of the superimposed M·_Pvu_II (magenta) and M·_Rsr_I (aqua) structures. The catalytic DPPY motif of M·_Rsr_I is illustrated in yellow and numbering in black for M·_Rsr_I and magenta for M·_Pvu_II indicates particular regions discussed in the text. The view is similar to that in Figure 3. (C) Close-up view of the X1PPX2 motif aligned only on X1PPX2, using the same color scheme. The diagrams were made using MOLSCRIPT (57), Raster3D (58) and Photoshop (Adobe).
The complete TRD of M·_Pvu_II has not been modeled, due to disorder in the crystal (11). However, the region that directs the protruding arm up to residue 177 and after residue 202 (M·_Rsr_I numbering) superimposes quite well (Fig. 7B), which suggests that M·_Pvu_II may also have a similar protruding arm. This arm is observed in the M·_Rsr_I structure probably because of different crystal packing environments. In M·_Rsr_I, residues 192–195 form crystal contacts with the equivalent residues of a second molecule related by a crystallographic 2-fold axis. There is also a crystallographic dimer interface of ∼1500 Å2 formed by two molecules which are related by a different crystallographic 2-fold axis. The residues that form this interface include parts of α-helix E, 310-helix F1, β-strands 6–8 and the loops preceding β-strands 7 and 8. Similar crystal contacts are not observed in the M·_Pvu_II structure and the putative TRD extends into a solvent region (11). We suggest that the β class of MTases are distinguished from the α and γ classes of MTases by this protruding arm region, which we propose contributes to DNA binding and specificity.
An unexpected difference between these two members of the β MTase class is that the N-terminal residues (16–39) of M·_Pvu_II are found in a similar position to the C-terminal residues (299–311) of M·_Rsr_I, but form a β-strand in a different orientation. The electron density maps and refinement of both proteins have been re-examined and scrutinized (X.Cheng, personal communication), and this difference appears to be real. This region differs among the MTase classes (Fig. 4) and also between members of the β class. An intriguing explanation for this difference may involve a slightly different circular permutation that may have occurred within different β class MTases during evolution.
Structural explanation of DNA binding results
The structure of M·_Rsr_I provides an explanation for mutagenesis data obtained in a challenge-phage screen for mutant methyltransferases (29). Two mutants were isolated, L72P and D173A. Leu72 when mutated to Pro abolishes catalytic activity. Asp173 when mutated to Ala depresses site-specific DNA binding (29). The L72P mutation occurs in 310-helix D1, which is just C-terminal to the catalytic DPPY motif (Figs 3 and 8A). Changing the Leu to a Pro would be expected to destabilize helix formation of D1 or alter the flexibility of the β-hairpin loop, thereby disrupting the normal conformation of the DPPY motif (IV). This minor structural change may be sufficient to hinder the successful transition from ground state binding to catalysis, which requires precise spatial alignment and complementarity at the site of catalysis (23).
Figure 8.

Diagram of M·_Rsr_I showing the interactions of residues affecting DNA binding and catalytic activity of M·_Rsr_I. (A) The loop from residue 50 to 90 is shown with relevant side chains. Leu72 is located at the tip of this loop that contains the catalytic residues, DPPY. (B) The large protruding arm is shown with side chains in a view similar to Figure 3. Hydrogen bonding/ion pair interactions are shown by the gray lines. Asp173 is involved in a network of electrostatic interactions that appear to stabilize the observed structure of the protruding arm. The diagrams were made using MOLSCRIPT (57), Raster3D (58) and Photoshop (Adobe).
The D173A mutation occurs in the second 310-helix F1, which is located just N-terminal to helix F of the helix–turn–helix motif (Fig. 3), which is thought to be part of the TRD involved in DNA binding (Fig. 8B). Asp173 is involved in a large network of hydrogen bonding and ion pair interactions with neighboring residues that may stabilize this region of the protein. Changing residue 173 from an Asp to an Ala would not necessarily disrupt formation of the 310-helix, but the change from a negatively charged polar residue to an uncharged hydrophobic residue may alter the hydrophilicity, charge or direct interactions with the DNA, methylase molecules or other parts of the methylase, such as Arg176, with which it makes a direct ion pair (Fig. 8B). All of these possibilities are consistent with the decrease in affinity of this D173A mutant for DNA in the bacteriophage P22 challenge-phage assay (29). As discussed, this region of the protein is well conserved among all MTases of the β class and may undergo a structural change or be involved in formation of a dimer in order to recognize specific sequences of DNA.
An interesting observation from Szegedi et al. is that the binding affinity for DNA increases 18-fold when an AdoMet analog, sinefungin, is present (26). Comparison of the active site of M·_Rsr_I to the M·_Pvu_II–AdoHcy complex in Figures 5 and 6 shows that the sizes and shapes of the AdoMet binding pockets are very similar. Although the core structures surrounding these residues are slightly different, the AdoMet interacting surfaces are similar. The residues in the M·_Rsr_I–5′-MTA complex that may interact with AdoMet, by analogy to the M·_Pvu_II–AdoHcy structure (Fig. 5 and Supplementary material, Table S3; 11), reveal good homology between the two enzymes. Since a cofactor-free structure has not been obtained with any β class MTase, the cofactor may be necessary for protein stability, by altering the rigidity of the enzyme, inducing subtle changes in the structure or binding characteristics of the TRD, or it may simply increase the positive charge of the binding site. A structure of the ternary complex would resolve this question and reveal any structural changes in the TRD.
Conclusions
This structure of M·_Rsr_I, an _N_6-adenine MTase belonging to the β class of bacterial MTases, is similar to a previously known structure of the cytosine MTase of the same class, M·_Pvu_II. The enzyme contains the methylase fold, and the nucleotide-binding and active-site regions form a catalytic core, which most closely resembles the _Pvu_II MTaseI. However, there are some striking differences. The larger nucleotide binding pocket observed in M·_Rsr_I is expected because it methylates adenine. The structure provides an explanation for the functional defects of mutants shown to alter catalytic activity (L72P) and DNA binding (D173A). However, the most striking difference between _Rsr_I MTase and the other bacterial enzymes of the β class is the structure of the putative DNA binding domain, which is formed in part by two helices on an extended arm of the protein found on the opposite face of the enzyme from the active site. This structure and its putative role in DNA binding suggests that a dramatic conformational change or dimerization may take place during the DNA binding and methylation reaction.
SUPPLEMENTARY MATERIAL
See Supplementary Material available at NAR Online.
[Supplementary Data]
Acknowledgments
ACKNOWLEDGEMENTS
We thank Frank Murphy for help with cryocrystallography and early data collection and Janet Klass for assistance with manuscript preparation. We thank Elmar Weinhold for sharing data prior to its publication. We appreciate the assistance of members of the beamline X12-C team at the National Synchrotron Light Source, which is supported by the US DOE, the NSF and the NIH (RR12408-01A1). The HKL software package is supported by NIH grant GM-53163 to Z. Otwinowski and W. Minor. We are grateful for support from NIH grants GM 25621 to R.I.G. and GM59456 to M.E.A.C. This project was supported in part by the US Department of Energy, Office of Health and Environmental Research, under contract W-31-109-Eng-38 (A.J. and M.W.).
PDB accession no. 1EG2
REFERENCES
- 1.Bickle T.A. and Kruger,D.H. (1993) Microbiol. Rev., 57, 434–450. [DOI] [PMC free article] [PubMed] [Google Scholar]
- 2.Cheng X. (1995) Annu. Rev. Biophys. Biomol. Struct., 24, 293–318. [DOI] [PubMed] [Google Scholar]
- 3.Wilson G.G. (1991) Nucleic Acids Res., 19, 2539–2566. [DOI] [PMC free article] [PubMed] [Google Scholar]
- 4.Cheng X., Kumar,S., Klimasauskas,S. and Roberts,R.J. (1993) Cold Spring Harbor Symp. Quant. Biol., 58, 331–338. [DOI] [PubMed] [Google Scholar]
- 5.Posfai J., Bhagwat,A.S., Posfai,G. and Roberts,R.J. (1989) Nucleic Acids Res., 17, 2421–2435. [DOI] [PMC free article] [PubMed] [Google Scholar]
- 6.Kumar S., Cheng,X., Klimasauskas,S., Mi,S., Posfai,J., Roberts,R.J. and Wilson,G.G. (1994) Nucleic Acids Res., 22, 1–10. [DOI] [PMC free article] [PubMed] [Google Scholar]
- 7.Lauster R., Trautner,T.A. and Noyer-Weidner,M. (1989) J. Mol. Biol., 206, 305–312. [DOI] [PubMed] [Google Scholar]
- 8.Malone T., Blumenthal,R.M. and Cheng,X. (1995) J. Mol. Biol., 253, 618–632. [DOI] [PubMed] [Google Scholar]
- 9.Reinisch K.M., Chen,L., Verdine,G.L. and Lipscomb,W.N. (1995) Cell, 82, 143–153. [DOI] [PubMed] [Google Scholar]
- 10.Tran P.H., Korszun,Z.R., Cerritelli,S., Springhorn,S.S. and Lacks,S.A. (1998) Structure, 6, 1563–1575. [DOI] [PubMed] [Google Scholar]
- 11.Gong W., O’Gara,M., Blumenthal,R.M. and Cheng,X. (1997) Nucleic Acids Res., 25, 2702–2715. [DOI] [PMC free article] [PubMed] [Google Scholar]
- 12.Schluckebier G., Kozak,M., Bleimling,N., Weinhold,E. and Saenger,W. (1997) J. Mol. Biol., 265, 56–67. [DOI] [PubMed] [Google Scholar]
- 13.Fauman E.B., Blumenthal,R.M. and Cheng,X. (1999) In Blumenthal,R.M. and Cheng,X. (eds), S-Adenosylmethionine-dependent Methyltransferases: Structures and Functions. World Scientific Publishing, Singapore, pp. 1–38.
- 14.Sheikhnejad G., Brank,A., Christman,J.K., Goddard,A., Alvarez,E., Ford,H., Marquez,V.E., Marasco,C.J., Sufrin,J.R., O’Gara,M. and Cheng,X. (1999) J. Mol. Biol., 285, 2021–2034. [DOI] [PubMed] [Google Scholar]
- 15.Ho D.K., Wu,J.C., Santi,D.V. and Floss,H.G. (1991) Arch. Biochem. Biophys., 284, 264–269. [DOI] [PubMed] [Google Scholar]
- 16.Pogolotti A.L., Ono,A., Subramaniam,R. and Santi,D.V. (1988) J. Biol. Chem., 263, 7461–7464. [PubMed] [Google Scholar]
- 17.Holz B., Dank,N., Eickhoff,J.E., Lipps,G., Krauss,G. and Weinhold,E. (1999) J. Biol. Chem., 274, 15066–15072. [DOI] [PubMed] [Google Scholar]
- 18.Kossykh V.G., Schlagman,S.L. and Hattman,S. (1993) Nucleic Acids Res., 21, 4659–4662. [DOI] [PMC free article] [PubMed] [Google Scholar]
- 19.Willcock D.F., Dryden,D.T.F. and Murray,N.E. (1994) EMBO J., 13, 3902–3908. [DOI] [PMC free article] [PubMed] [Google Scholar]
- 20.Pues H., Bleimling,N., Holz,B., Wolcke,J. and Weinhold,E. (1999) Biochemistry, 38, 1426–1434. [DOI] [PubMed] [Google Scholar]
- 21.Ahmad I. and Rao,D.N. (1996) J. Mol. Biol., 259, 229–240. [DOI] [PubMed] [Google Scholar]
- 22.Roth M., Helm-Kruse,S., Friedrich,T. and Jeltsch,A. (1998) J. Biol. Chem., 273, 17333–17342. [DOI] [PubMed] [Google Scholar]
- 23.Klimasauskas S., Kumar,S., Roberts,R.J. and Cheng,X. (1994) Cell, 76, 357–369. [DOI] [PubMed] [Google Scholar]
- 24.Allan B.W. and Reich,N.O. (1996) Biochemistry, 35, 14757–14762. [DOI] [PubMed] [Google Scholar]
- 25.Allan B.W., Beechem,J.M., Lindstrom,W.M. and Reich,N.O. (1998) J. Biol. Chem., 273, 2368–2373. [DOI] [PubMed] [Google Scholar]
- 26.Szegedi S.S., Reich,N.O. and Gumport,R.I. (2000) Nucleic Acids Res., 28, 3962–3971. [DOI] [PMC free article] [PubMed] [Google Scholar]
- 27.Kaszubska W., Webb,H.K. and Gumport,R.I. (1992) Gene, 118, 5–11. [DOI] [PubMed] [Google Scholar]
- 28.Kaszubska W., Aiken,C., O’Connor,C.D. and Gumport,R.I. (1989) Nucleic Acids Res., 17, 10403–10425. [DOI] [PMC free article] [PubMed] [Google Scholar]
- 29.Szegedi S.S. and Gumport,R.I. (2000) Nucleic Acids Res., 28, 3972–3981. [DOI] [PMC free article] [PubMed] [Google Scholar]
- 30.Jancarik J. and Kim,S.H. (1991) J. Appl. Crystallogr., 24, 409–411. [Google Scholar]
- 31.Otwinowski Z. and Minor,W. (1997) Methods Enzymol., 276, 307–326. [DOI] [PubMed] [Google Scholar]
- 32.Walsh M.A., Dementieva,I., Evans,G., Sanishvili,R. and Joachimiak,A. (1999) Acta Crystallogr., D55, 1168–1173. [DOI] [PubMed] [Google Scholar]
- 33.Walsh M.A., Evans,G., Sanishvili,R., Dementieva,I. and Joachimiak,A. (1999) Acta Crystallogr., D55, 1726–1732. [DOI] [PubMed] [Google Scholar]
- 34.Terwilliger T.C. and Berendzen,J. (1999) Acta Crystallogr., D55, 849–861. [DOI] [PMC free article] [PubMed] [Google Scholar]
- 35.Fortelle E. and Bricogne,G. (1997) Methods Enzymol., 276, 472–494. [DOI] [PubMed] [Google Scholar]
- 36.Perrakis A., Sixma,T.K., Wilson,K.S. and Lamzin,V.S. (1997) Acta Crystallogr., D53, 448–455. [Google Scholar]
- 37.Bailey S. (1994) Acta Crystallogr., D50, 760–763. [Google Scholar]
- 38.Jones T.A., Zou,J.Y., Cowan,S.W. and Kjelgaard,M. (1991) Acta Crystallogr., A47, 110–119. [Google Scholar]
- 39.Brünger A.T., Adams,P.D., Clore,G.M., Delano,W.L., Gros,P., Grosse-Kunstleve,R.W., Jiang,J.-S., Kuszewski,J., Nilges,M., Pannu,N.S., Read,R.J., Rice,L.M., Simonson,T. and Warren,G.L. (1998) Acta Crystallogr., D54, 905–921. [DOI] [PubMed] [Google Scholar]
- 40.Kleywegt G.J. and Jones,T.A. (1997) Methods Enzymol., 277, 208–230. [DOI] [PubMed] [Google Scholar]
- 41.Laskowski R.A., MacArthur,M.W., Moss,D.S. and Thornton,J.M. (1993) J. Appl. Crystallogr., 26, 283–291. [Google Scholar]
- 42.Hoffman J.L. (1986) Biochemistry, 25, 4444–4449. [DOI] [PubMed] [Google Scholar]
- 43.Hutchinson E.G. and Thornton,J.M. (1996) Protein Sci., 5, 212–220. [DOI] [PMC free article] [PubMed] [Google Scholar]
- 44.Kabsch W. and Sanders,C. (1983) Biopolymers, 22, 2577–2637. [DOI] [PubMed] [Google Scholar]
- 45.McDonald I. and Thornton,J.M. (1994) J. Mol. Biol., 238, 777–793. [DOI] [PubMed] [Google Scholar]
- 46.Schluckebier G., O’Gara,M., Saenger,W. and Cheng,X. (1995) J. Mol. Biol., 247, 16–20. [DOI] [PubMed] [Google Scholar]
- 47.Ring C.S., Kneller,D.G., Langridge,R. and Cohen,F.E. (1992) J. Mol. Biol., 224, 685–699. [DOI] [PubMed] [Google Scholar]
- 48.Wilmot C.M. and Thornton,J.M. (1990) Protein Eng., 3, 479–493. [DOI] [PubMed] [Google Scholar]
- 49.Mirny L.A. and Shakhnovich,E.I. (1999) J. Mol. Biol., 291, 177–196. [DOI] [PubMed] [Google Scholar]
- 50.Kleywegt G.J. (1996) Acta Crystallogr., D52, 842–857. [DOI] [PubMed] [Google Scholar]
- 51.Nicholls A., Bharadwaj,R. and Honig,B. (1993) Biophys. J., 64, A166. [Google Scholar]
- 52.Hendrickson W.A. (1991) Science, 254, 51–58. [DOI] [PubMed] [Google Scholar]
- 53.Ramakrishnan V. and Biou,V. (1997) Methods Enzymol., 276, 538–557. [PubMed] [Google Scholar]
- 54.Brünger A.T. (1997) Methods Enzymol., 277, 366–396. [DOI] [PubMed] [Google Scholar]
- 55.Suzuki M. (1993) EMBO J., 12, 3221–3226. [DOI] [PMC free article] [PubMed] [Google Scholar]
- 56.Evans S. (1993) J. Mol. Graph., 11, 134–138. [DOI] [PubMed] [Google Scholar]
- 57.Kraulis P.J. (1991) J. Appl. Crystallogr., 24, 946–950. [Google Scholar]
- 58.Merritt E.A. and Bacon,D.J. (1997) Methods Enzymol., 277, 505–524. [DOI] [PubMed] [Google Scholar]
Associated Data
This section collects any data citations, data availability statements, or supplementary materials included in this article.
Supplementary Materials
[Supplementary Data]