Human microRNA prediction through a probabilistic co-learning model of sequence and structure (original) (raw)
Abstract
MicroRNAs (miRNAs) are small regulatory RNAs of ∼22 nt. Although hundreds of miRNAs have been identified through experimental complementary DNA cloning methods and computational efforts, previous approaches could detect only abundantly expressed miRNAs or close homologs of previously identified miRNAs. Here, we introduce a probabilistic co-learning model for miRNA gene finding, ProMiR, which simultaneously considers the structure and sequence of miRNA precursors (pre-miRNAs). On 5-fold cross-validation with 136 referenced human datasets, the efficiency of the classification shows 73% sensitivity and 96% specificity. When applied to genome screening for novel miRNAs on human chromosomes 16, 17, 18 and 19, ProMiR effectively searches distantly homologous patterns over diverse pre-miRNAs, detecting at least 23 novel miRNA gene candidates. Importantly, the miRNA gene candidates do not demonstrate clear sequence similarity to the known miRNA genes. By quantitative PCR followed by RNA interference against Drosha, we experimentally confirmed that 9 of the 23 representative candidate genes express transcripts that are processed by the miRNA biogenesis enzyme Drosha in HeLa cells, indicating that ProMiR may successfully predict miRNA genes with at least 40% accuracy. Our study suggests that the miRNA gene family may be more abundant than previously anticipated, and confer highly extensive regulatory networks on eukaryotic cells.
INTRODUCTION
MicroRNAs (miRNAs), constituting a large family of noncoding (nc) small RNAs, directly take part in post-transcriptional regulation either by arresting the translation of messenger RNAs (mRNAs) or by the cleavage of mRNAs (1). miRNAs are defined as single-stranded RNAs of ∼22 nt in length (ranged 19–25 nt) generated from endogenous transcripts that can form local hairpin structures (2). miRNA genes are transcribed by RNA polymerase II (3,4). The local hairpin structures in the primary transcripts [primary microRNAs, (pri-miRNAs)] are first processed by the nuclear RNase type III enzyme, Drosha, to release the hairpin-shaped intermediates (pre-miRNAs) (5). Pre-miRNAs are typically 60–70 nt, and contain an ∼22 bp double-stranded stem and an ∼10 nt terminal loop. The terminal end at the opposite side of the loop contain an ∼2 nt overhang at the 3′ end, which is typical of RNase III products. Pre-miRNAs are then exported to the cytoplasm by the nuclear export factor Exportin 5 and the Ran-GTP cofactor (6–8). In the cytoplasm, pre-miRNAs are cleaved by another RNase III type enzyme, Dicer, to generate an ∼22 nt RNA duplex (9–13). Dicer cleaves at ∼22 nt from the terminal staggered end discarding the terminal loop region. One strand of the miRNA duplex is usually selected as mature miRNA while the other strand is degraded (14,15). Therefore, two-step processing events are required for miRNA maturation: (i) the cleavage at the non-looped side of the stem by Drosha in the nucleus, followed by (ii) the cleavage at the looped end by Dicer in the cytoplasm (5,6).
Identification of novel miRNA genes is one of the most imminent problems towards the understanding of post-transcriptional gene regulation. Thus far, 227 human miRNAs have been reported (16–31). Experimental cloning efforts have successfully identified highly expressed miRNAs from various tissues. However, cloning methods are highly biased towards miRNAs that are abundantly and/or ubiquitously expressed.
On the other hand, computational prediction of miRNAs could become a robust approach for tissue-specific or lowly expressed miRNAs. Several computational methods have been developed to find close homologs among related miRNAs (29,32–35). The program MiRscan successfully predicted close homologs of Caenorhabditis briggsae with statistically conserved patterns of Caenorhabditis elegans miRNAs (35). However, MiRscan failed to detect miRNAs that lack clear homologs in related species. Recently, the structural features of pre-miRNAs and the upstream sequence motif of miRNAs have been incorporated in the computations (34,36). MiRscan has been improved by defining the newly observed upstream sequence motif and the patterns of flanking sequence conservation for nematode miRNAs (34). Likewise, the program miRseeker was able to predict new Drosophila miRNA genes by screening closely homologous stem–loops in entire genomes (32). A profile-based method is better than the previous similarity searches and can predict close homologs in animal genomes by profiling the miRNA sequence family (33). However, these methods also frequently fail to detect miRNAs that lack detectable homologs.
In this study, we suggest a probabilistic co-learning method based on the paired hidden Markov model (HMM) to implement a general miRNA prediction method to identify close homologs as well as distant homologs. It combines both sequential and structural characteristics of miRNA genes in a probabilistic framework, and simultaneously decides if an miRNA gene and a region of mature miRNA are present by detecting the signals for the site cleaved by Drosha. We employed this method to predict novel miRNA genes and experimentally validated the candidates by examining the accumulation of pri-miRNAs in the cells depleted of Drosha.
MATERIALS AND METHODS
Datasets
We trained and validated the algorithm through 5-fold cross-validation with a positive dataset [known human miRNA precursor (pre-miRNAs)] and a negative dataset. We used previously known human pre-miRNAs consisting of 81 5′ strand and 55 3′ strand mature miRNAs as the positive dataset (available at http://www.sanger.ac.uk/Software/Rfam/mirna/search.shtml, release 4.0).
The negative dataset consisted of 1000 extended stem–loop structures randomly extracted from human chromosomes with several criteria described in the Supplementary Material (based on the NCBI build 34, version 3 of the human genome). All stem–loop structures were predicted using the Vienna RNA software package (37). These criteria were obtained through learning the common structure of human pre-miRNAs (38) and were also used for the extraction of extended stem–loop structures similar to pre-miRNAs in genome sequences.
Probabilistic co-learning model of pre-miRNAs
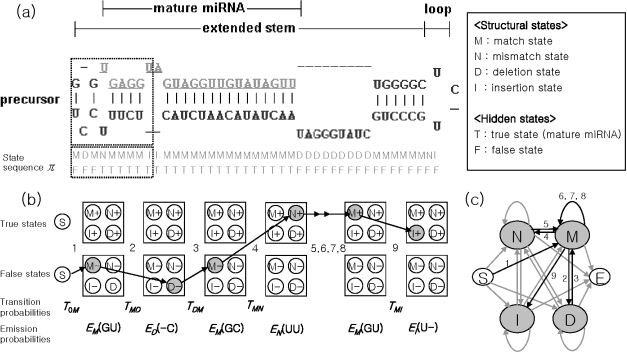
An pre-miRNA can be represented as a pairwise sequence. It forms an extended stem–loop structure, and this structure can be formulated as a sequence of matched base pairs (Figure 1a). The pairwise sequence starts from the non-looped side of the pre-miRNA and ends at the loop. The state of each pair can be classified on the basis of its base pairing status as (i) match, (ii) mismatch, (iii) deletion or (iv) insertion. In particular, we regard a loop structure as an ordered sequence of mismatches and insertions as in the paired HMM.
Figure 1.
Pairwise representation of stem–loop structures and state sequences of pre-miRNAs, where the state of each pair includes structural information and mature miRNA region information (hidden states). (a) The structure of the pre-miRNA. (b) The transition and emission scheme of the structural states and the hidden states for pairwise sequence in the dotted rectangle shown in (a). T_0_M, TDM, TMN and TMI are transition probabilities. EM(GU), ED(−C), EM(GC), EN(UU), EM(GU) and EI(U−) are emission probabilities. (c) The four-state finite state automaton. Finally, the probability of the pairwise sequence is assigned by multiplication of the transition probabilities and the emission probabilities.
Each position of the pairwise sequence has two properties, i.e. structural states (match/mismatch/deletion/insertion) and hidden states (information for the mature miRNA region). In the structural states, each match state, M, can emit A–U, U–A, G–C, C–G, U–G or G–U as an emission symbol. Deletion states, D, can emit •–A, •–U, •–G or •–C. Insertion states, I, can emit A–•, U–•, G–• or C–•. Mismatch states, N, can emit one of the remaining combinations. The possible transitions between the four structural states are shown in Figure 1c. Each emission is represented as a corresponding character in alphabetical order. In the hidden states, T means a true state, namely a region of mature miRNA, and F means a false state, the precursor region outside mature miRNA sequences (Figure 1b). The probabilities of hidden states in this sequence-structure co-learning model are estimated from the distribution of all four structural states.
Screening of pre-miRNAs
To screen miRNPs, we estimate the probability of the pairwise sequence of pre-miRNAs. To derive the probability of the pairwise sequence of the states and the symbols, we need to estimate two parameters: a transition probability and an emission probability. For the transition probability, let us call the state sequence a path, π. The probability of a state depends only on the previous state. If π_i_ denotes the _i_-th state in the path, the transition probability is defined as
where the transition is from state π_i_−1 = k to state π_i_ = l. The probability of starting in state k can be defined as T_0_k. Let xi denote the symbol emitted from the _i_-th state. Then, the emission probability of observing symbol b in state k is defined as
Using the transition and emission probabilities, we can estimate the probability P(x) that sequence x is generated by the probabilistic co-learning model. It is easy to define the joint probability of an observed sequence x and a state sequence π:
| P(x,π)=T0π1∏i=1LEπi(xi)Tπiπi+1, | 3 |
|---|
where L is the window size. If we are to choose just one path for our prediction, that one, π*, with the highest probability should be chosen as follows:
The Viterbi algorithm (39) is a common method for finding the most probable state transition path and its probability in HMMs. However, a straightforward application of the algorithm is impossible in this case because the values of the probability returned by the algorithm are very small. In particular, when the given sequence is longer, the probability the Viterbi algorithm produces is smaller, exponentially. To use the Viterbi probability for classification, we should evaluate the Viterbi probability of the fixed-length sequence that represents the mature miRNA region instead of the entire sequence. We evaluate the Viterbi probability for the mature miRNA region as
| P(x,π)=T0π1∏i=122Eπi(xi)Tπiπi+1. | 5 |
|---|
On a given pairwise sequence, we search for the maximum P(x, π) value by using a sliding window, the size of which is 22 ± 2 bp—the mean length of the mature miRNAs in the pairwise representation. We evaluate two P(x, π) values for the models of 5′ strand pre-miRNAs and 3′ strand pre-miRNAs, respectively. If the P(x, π) values for the 5′ and 3′ strands are higher than a threshold selected in advance, then we classify the given candidate as an pre-miRNA. The threshold was determined by the receiver operator characteristic (ROC) curve analysis.
Evidence for validation of miRNP prediction
Statistical significance of minimum free energy
The thermodynamic stability and statistical significance of the secondary structures can be assessed using minimum free energy (MFE) and Monte Carlo simulations (40). Van de Peer's group (41) proposed _P_-values to assess the statistical significance of MFE values of miRNAs and ncRNAs and developed the randfold, a program for testing statistical significance. The _P_-values of miRNAs were lower than those for other ncRNAs, with statistical significance. The low _P_-value (under P = 0.05) provides evidence to identify putative miRNA genes from the genome sequence. However, the stability and conservation of secondary structures was stated as insufficient evidence to predict new ncRNAs as a general method in a study on the common structures of ncRNAs (42). Thus, to efficiently predict miRNA genes, the statistical stability of the MFE value should be combined with other information.
Repeat and published RNA sequences
No published human pre-miRNAs contain human repeat motifs such as alu sequences. Results of genome-wide miRNA prediction might thus produce false positives of repeat sequences. Therefore, candidates containing human repeat sequences should be excluded. Human repeat sequences were downloaded from the Alu sequence database of GenBank. Only 10 of the published human pre-miRNAs could be matched with published RNA sequences that include transfer, ribosomal and small nuclear RNAs, and others. Some of these were located in the intron of mRNA. Therefore, such evidence can be used as negative information to predict pre-miRNAs in the genome sequence. Here, we have aligned the sequences using BLAST to investigate whether candidates contain repeat sequences or published RNAs. The _E_-value threshold was 10−20.
Prediction of a mature miRNA region and a functional strand
Mature miRNA region
To apply the miRNA maturation mechanism to our probabilistic model, we first detect the stem-end of mature miRNA and then we seek the loop-end, 22 ± 2 bp distant from the non-looped end. We introduce two hidden states indicating whether the position is a mature miRNA region. The probabilities that state whether the _i_-th position is true or false are computed as
| Pt(i)=max{Pt(i−1)⋅Tτi−1τi,Pf(i−1)⋅Tυi−1τi}⋅Eτi(xi) | 6 |
|---|
| Pf(i)=max{Pt(i−1)⋅Tτi−1υi,Pf(i−1)⋅Tυi−1υi}⋅Eυi(xi), | 7 |
|---|
where τ_i_ means that the i_-th state is true and υ_i means that the _i_-th state is false. The initial condition is Pt(1) = 0, Pf(1) = 1.
Using only the true and the false probabilities, we cannot exactly determine mature miRNA regions, because the transition probability around the cleavage site of an miRNA is low. Thus, we focus on the transition probability of false states and compute S(i) as
| S(i)=Pt(i−1)⋅TυτPt(i−1)⋅Tυτ+Pf(i−1)Tυυ. | 8 |
|---|
Functional strand
In addition, we can determine the functional strand of a mature miRNA not only by comparing the probabilities of both the strands, but by absolute and relative internal stability of the base pairs at the 5′ ends of the pre-miRNA. The helicase initiates unwinding at the end of base pairs with lower stability and the miRNP complex is assembled with the 5′ end strand, which becomes the functional strand, at its unwinding end (15). To determine the functional strand before prediction of the mature miRNA region, the free energy values for five bases at the end region are calculated from the known 2 nt free energy value table (14).
Experimental verification
Depletion of Drosha was achieved by RNA interference experiments as previously described (see Supplementary Material) (5). Briefly, HeLa cells were incubated with small interfering RNA (siRNA) duplex (Samchully Pharm, Seoul, Korea) complementary to Drosha mRNA for 3 days. As a control, siRNAs complementary to firefly luciferase (instead of Drosha siRNA) were incubated with HeLa cells. Total RNA from both control and test cells was prepared using Trizol (Invitrogen, Carlsbad, CA) and used to synthesize a complementary DNA (cDNA) with oligo-dT primers and the Superscript II enzyme (Invitrogen). The resulting cDNA was then used for PCR amplification. PCR primers were designed to detect pri-miRNAs and are described in the Supplementary Material. The size of PCR products is ∼200–280 nt. If the given miRNA gene candidate can indeed express miRNA, the PCR product is expected to accumulate when Drosha is depleted, because under normal condition pri-miRNA would be rapidly cleaved by Drosha. To quantitate the relative level of accumulation of pri-miRNAs, we also performed real-time quantitative PCR (see Supplementary Material). For real-time PCR, the relative quantity of each product is inversely proportional to the threshold cycle (CT) value. The difference in the CT value between the control and the test sample means the difference in relative expression level.
RESULTS
Evaluation of performance
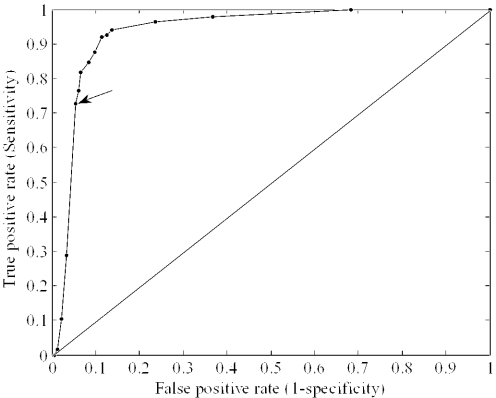
We performed 5-fold cross-validation for various screening thresholds to plot ROC curves, which is an effective method for evaluating the performance of diagnostic tests. Figure 2 describes an ROC curve of 136 known miRNAs and a negative dataset of 1000 sequences according to change of threshold. Thresholds are provided as a parameter to predict putative miRNAs in genome-wide search. When selecting thresholds, the trade off between sensitivity and specificity should be considered. We chose the threshold (P = 0.033) for the classification of pre-miRNA candidates at the point that shows 73% sensitivity and 96% specificity, on average.
Figure 2.
The ROC curve, which is defined as a plot of test sensitivity as the _y_-coordinate, versus the false positive rate (FPR; 1 − specificity) as the _x_-coordinate. The area under the ROC curve is 0.936 by non-parametric estimation. The arrow indicates the point of threshold, where P = 0.033, specificity is 96% and sensitivity is 73%.
We have performed additional evaluation with miRNAs, recently reported by the Poy group, to reconfirm the efficiency of our method. In the validation, we could predict the most recently reported miRNAs, hsa-mir-376a, hsa-mir-377, hsa-mir-378, hsa-mir-381, hsa-mir-382, hsa-mir-384, hsa-mir-423 and hsa-mir-424, which are unrelated to our original training data. This result indicates that, unlike previously reported methods, our approach may be sensitive enough to identify unrelated miRNA genes.
Screening for miRNAs on human chromosomes 16, 17, 18 and 19
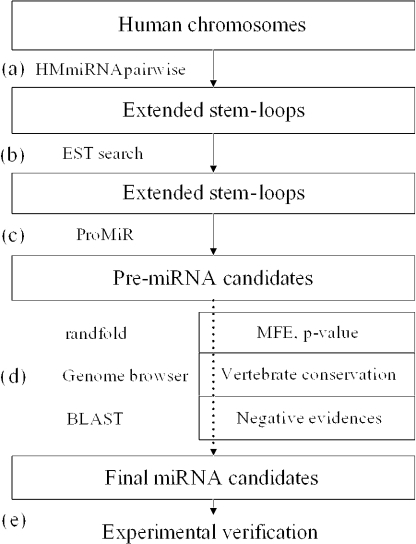
To perform genome-wide screening for miRNA genes, we extracted 65539, 68458, 34853 and 62229 sequences of stem–loop structures on chromosomes 16, 17, 18 and 19, respectively, using the extracting method of stem–loops mentioned above (Figure 3a and Table 1, see Supplementary Material). Next, to verify the expression of the extracted stem–loops, we performed a human expressed sequence tag (EST) database search using BLAST (NCBI Entrez EST database; February 6, 2003). From the EST database search, 8153, 9367, 3135 and 7765 stem–loops on chromosomes 16, 17, 18 and 19, respectively, were matched with human ESTs and the _E_-values were below 1.0 × 10⁻³⁰ (Figure 3b, Table 1).
Figure 3.
Flow chart for human miRNA gene finding. (a) The program, HMmiRNApairwise using an RNAfold algorithm extracts extended stem–loops with several criteria described in the Supplementary Material; (b) human EST database search; (c) ProMiR predicts pre-miRNA candidates, the region of mature miRNA and the location of a functional strand; (d) screening by additional evidence—MFE values, vertebrate conservations and negative evidences; (e) experimental verification.
Table 1.
Results of genome-wide screening of human miRNA
| Chr | Extracted stem–loop structures | Expressed stem–loops | pre-miRNA candidates | Detected known miRNA |
|---|---|---|---|---|
| 16 | 65539 | 8153 | 253 | 2 |
| 17 | 68458 | 9367 | 274 | 11 |
| 18 | 34853 | 3135 | 83 | 4 |
| 19 | 62229 | 7765 | 207 | 7 |
From these 28420 expressed stem–loops, our model ‘ProMiR’ classified 817 pre-miRNA candidates. The candidates included two of the three known miRNA sequences (mir-138-2, mir-140) on chromosome 16, eleven (mir-21, mir-22, mir-195, mir-196a-1, mir-10a, mir-132, mir-152, mir-195, mir-301, mir-338, mir-108) of the 16 known miRNAs on chromosome 17, four (mir-1-2, mir-122a, mir-133a-1 and mir-187) of the four known miRNA sequences on chromosome 18 and seven (has-let-7e, mir-7-3, mir-27a, mir-150, mir-199a-1, mir-330 and mir-371) of the 14 known miRNAs on chromosome 19 (Figure 3c, Table 1). Because the candidate sets still included many false positives, we selected sequences using the additional evidence mentioned above to identify the more reliable candidates. The miRNA candidates were further screened as follows. We selected candidates with thermodynamically stable stem–loop structures by testing the statistical significance for each candidate's MFE value using the randfold (Figure 3d). Then we screened the candidates with conserved patterns among vertebrates. Recently, computational phylogenetic shadowing showed that the stems of pre-miRNAs are strongly conserved in whole genome alignments, whereas most terminal loop sequences are only loosely conserved (43). The conservation of the flanking region of the conserved pre-miRNA is rapidly decayed (43). Thus, using the UCSC genome browser we investigated whether the putative pre-miRNAs show similar conservation patterns among vertebrates (Figure 3d, http://genome.ucsc.edu, based on NCBI Build 35). Finally, we screened the 23 representative candidates using negative evidence to determine if the candidates matched with human repeats or published RNA sequences (Figure 3d, Tables 1 and 2).
Table 2.
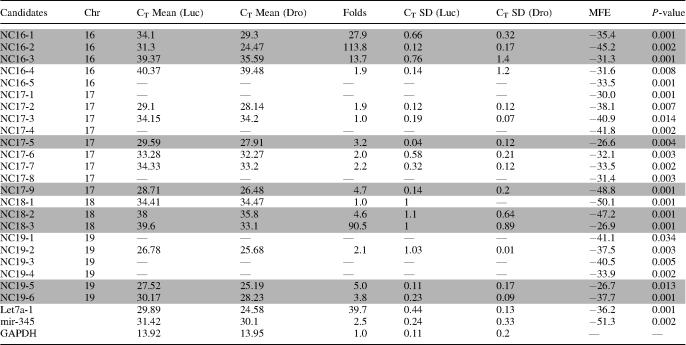
The real-time PCR results of final candidates
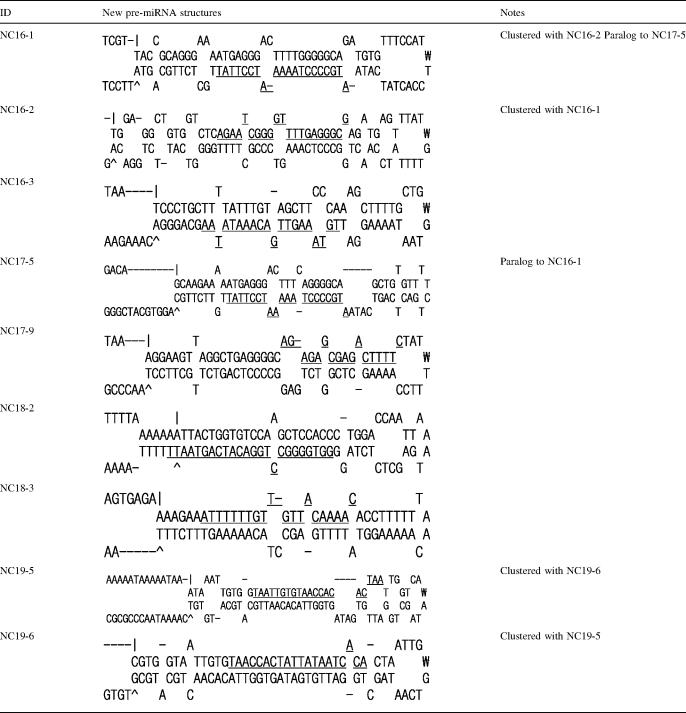
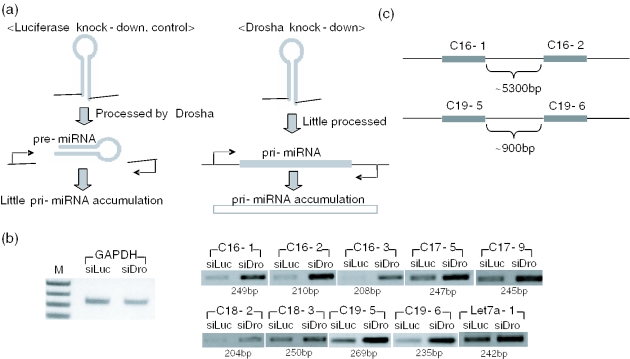
Some of the new miRNA candidates are found in clusters as is often observed in known miRNA gene loci (Table 3). One cluster contains two miRNAs (NC19-5 and NC19-6) spaced ∼900 bp apart and another cluster includes two miRNAs (NC16-1 and NC16-2) spaced 5320 bp apart (Figure 4c). Paralogs are also found: NC17-5 appears to be a paralog of NC16-1 with variation in loop sequences (Table 3).
Table 3.
Secondary structures by mfold of the new pre-miRNAs verified experimentally; the underline fonts indicate the mature miRNA regions predicted by ProMiR
Figure 4.
Experimental verification of the candidates predicted by ProMiR. (a) Comparison of the expected PCR results for the candidates in control and Drosha knockdown HeLa cells (b) The left gel image shows the PCR intensity of glyceraldehyde-3-phosphate dehydrogenase (GAPDH) for each cDNA. The first lane is the PCR result following silencing (si) RNA treatment for luciferase in HeLa cells for 3 days as the control and the second lane is the PCR result following siRNA for luciferase in HeLa cells for 3 days. (c) NC16-1 and 2, and NC19-5 and 6 are on a transcript that contains two pre-miRNAs, respectively.
To provide experimental confirmation, we sought to detect the putative pri-miRNAs by RT–PCR (Figure 3e) (44). Because pri-miRNAs, which are the primary precursors for mature miRNA, are rapidly cleaved by the processing enzyme Drosha, the authentic pri-miRNAs would accumulate when Drosha is depleted in cells. Because this assay is based on PCR amplification, it can detect miRNA genes that are expressed at a relatively low level (Figure 4a) (44). Nine putative miRNPs were confirmed using this method (Figure 4b and Table 3). Seven of the 14 remaining candidates were not detected in the PCR experiment, which may have been because of their low abundance in HeLa cells. For further confirmation, cells from different tissues and developmental stages should be examined. The rest (seven) of the candidates did not accumulate, suggesting that these candidates are unlikely to be authentic miRNA genes.
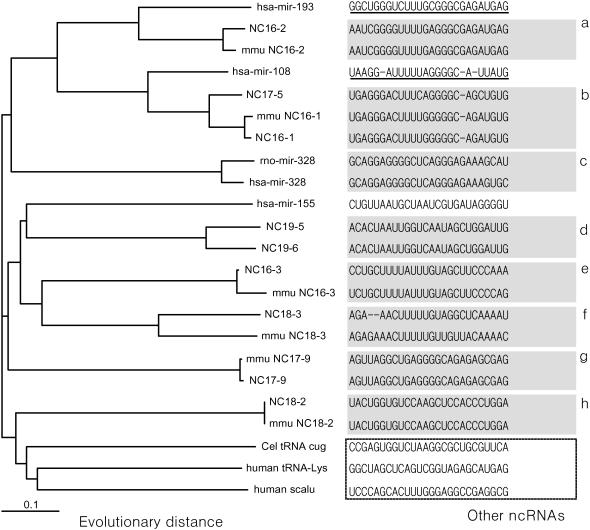
The miRNA candidates confirmed by RT–PCR experiment have relatively distant homologous patterns and show diverse sequence patterns, compared with previously published miRNAs. However, these new miRNAs are not more diverse than other ncRNAs. These results are provided by the phylogenetic analysis for pre-miRNA sequences (Figure 5).
Figure 5.
Phylogenetic tree for the nine new pre-miRNAs, several published miRNAs and other ncRNAs. The tree was drawn using the neighbor-joining method. The gray boxes in sequences indicate closely homologous (orthologs + paralogs) members. The dotted line box contains other ncRNA sequences, i.e. tRNAs and scAlu RNA. The new pre-miRNAs have distant homologous patterns to published pre-miRNAs—‘a’ homologous group shows distantly homologous pattern with has-mir-193 and the ‘b’ homologous group is a distant homolog to has-mir-108; however, they are relatively closer together than other ncRNAs.
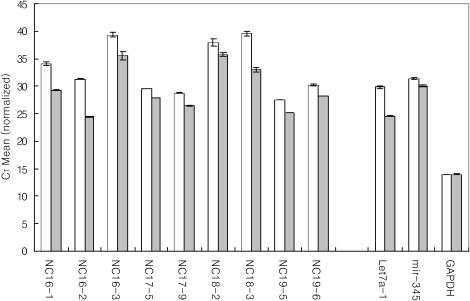
The results of real-time quantitative PCR indicate that some of the new miRNAs are expressed at low levels (CT value 27–35, Table 2), and some miRNAs such as NC16-2 and NC19-5 may be expressed at higher levels (CT value under 25). Low-abundant miRNAs may be difficult to detect with less sensitive methods such as northern blotting and may have escaped the conventional cloning (Table 2, Figure 6). Interestingly, the accumulation folds of pri-miRNAs vary significantly between the different miRNA genes. For instance, pri-miRNAs for Let7a-1, NC16-1, NC16-2 and NC18-3 accumulate more dramatically compared with those for miR-345 and NC17-5. This result suggests that pri-miRNA processing by Drosha may be differentially regulated in different miRNA genes.
Figure 6.
The differences of threshold cycle (CT) between control and Drosha knocked down cells.
Mature miRNA region prediction
We evaluated the accuracy of mature miRNA region prediction through 5-fold cross-validation with 136 known miRNAs (Table 4). The measures for assessment are the means of absolute distances and the square root of the mean of the squares. We found that for the 5′ strands ProMiR predicts the cleavage site at the non-loop side by Drosha more precisely than the cleavage site at the loop side by Dicer (mean absolute distance 1.96 versus 2.47 nt). For the 3′ strand, however, the end at the loop side is predicted more precisely than the end at the non-loop side (mean absolute distance 1.60 versus 2.13 nt). This indicates that the 3′ protruding ends generated by RNase III may be more variable than the 5′ recessive ends. Alternatively, the 3′ protruding ends may be subjected to additional modification in cells (decay or addition of extra nucleotides). The statistical signal of the cleavage site at the non-loop side of mature miRNA is relatively more dominant over the one at the loop side. This suggests that Drosha may be more important in determining the sequences of mature miRNA than Dicer.
Table 4.
Results of mature miRNA region prediction for 5-fold cross-validation
| Mean of absolute distance | Square root of the mean of the squares | |||||||
|---|---|---|---|---|---|---|---|---|
| 5′ Strand | 3′ Strand | 5′ Strand | 3′ Strand | |||||
| Unlooped | Loop | Unlooped | Loop | Unlooped | Loop | Unlooped | Loop | |
| Total | 2.83 (nt) | 3.31 | 2.42 | 2.15 | 4.16 | 5.11 | 3.32 | 3.65 |
| Total except failures (68 + 48) | 1.96 | 2.47 | 2.13 | 1.60 | 2.56 | 3.26 | 2.70 | 2.14 |
We correctly predicted the orientation of the mature miRNA region for the 57/81 5′ sense strand and 41/55 3′ antisense strand pre-miRNAs. The mean accuracy was 72%.
Permutation test for the learning model
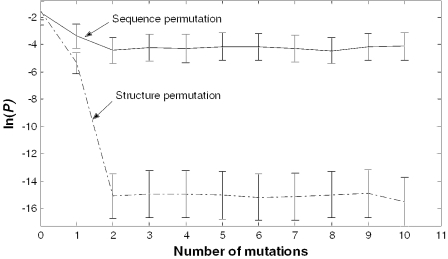
From the results so far, we can conclude that ProMiR effectively detects the cleavage signal recognized by Drosha. However, it is difficult to judge where the major cleavage signal originated. We designed a random permutation test to investigate whether the high specificity obtained by our model is caused by the base composition or the structure. Thus, we compared the change of efficiency for the trained model during 10 random permutations of the base pairs and bases in the stem, respectively. To measure the effect of base mutation, we randomly changed the base without changing the base pair; the effect of structure was measured by changing the base pair. Figure 7 presents the result of this study. The ln(P) value produced by structural permutation rapidly decayed to far below the threshold [ln(0.033)] even when the number of permutations was only one. In contrast, ln(P) values measured by sequence permutation reduced a little at the first permutation and then fluctuated near the threshold value. Thus, the specificity of our algorithm is influenced more by the conserved structural signals, such as match, mismatch, deletion and insertion, than by conserved sequence information.
Figure 7.
Permutation test for the structure and sequence of mature miRNA. The solid line indicates the change of probability P according to base permutation. The dotted line indicates the change of probability according to base pair permutation.
Comparison of efficiency with other approaches
Detection of the conserved primary motif or secondary structure is a straightforward approach for identifying new ncRNAs, especially, miRNAs (45,46). Several methods to search the common motifs in RNA sequences or protein sequences have been introduced. Profile HMM tools such as HMMer are based on the frequency and the transition probability of the sequences and are usually used to detect conserved primary motifs such as those for proteins and regulatory regions in multiple sequence alignment (47). This method shows the effectiveness of searching distantly homologous sequences. Covariance models such as INFERNAL are usually used to detect structurally conserved motifs (48,49). The success of covariance models depends on finely curated structural multiple alignments. In this experiment, we used MARNA, a method of multiple structural alignments to search for conserved secondary structures of ncRNAs (50). The esRCSG is a method recently introduced to optimize RNA common structural grammar using genetic programming, a form of evolutionary algorithm (38). This method does not need multiple alignment data but uses only primary sequence as input data.
We compared the efficiency of our ProMiR model with four different approaches including a previous miRNA prediction method, which relies on the characteristic feature that the known miRNAs derive from conserved stem–loop structures (Table 5, see Supplementary Material). To perform a fair comparison, we trained each model with various amounts of data. This made it possible to search for the optimal result of each method. In this comparison, the HMMer method by multiple sequence alignment showed very low accuracy. This might have been caused by inappropriate alignment results, because miRNA genes have conserved structural motifs rather than conserved sequence motifs. The results for INFERNAL showed higher sensitivity when there were more training data, but the specificity decreased to 0.18. This low specificity might be because, when given more training data, the method learns to recognize structures that are more common. Next, contrary to our expectation, a method based on conservation did not show improved performance. The lower sensitivity clearly demonstrates that it is not suitable to predict unrelated (not conserved) miRNAs. Finally, the results using esRCSG showed more effective prediction than the other methods using sequence or structural alignment. However, esRCSG gave lower sensitivity (0.67) than ProMiR (0.73) using probabilistic co-learning of sequence and structure.
Table 5.
Comparison of the efficiency of miRNA prediction
| Training data | Sensitivity | Specificity | |
|---|---|---|---|
| HMMer | 10 | 0.03 | 1.00 |
| 30 | 0.00 | 0.00 | |
| 50 | 0.00 | 0.00 | |
| 68 | 0.00 | 0.00 | |
| INFERNAL | 30 | 0.68 (0.00)a | 0.50 (0.00) |
| 50 | 0.91 (0.00) | 0.30 (0.00) | |
| 68 | 0.94 (0.00) | 0.18 (0.00) | |
| Conservationb | 68 | 0.34 | 0.87 |
| esRCSG | 50 | 0.36 (0.67)c | 0.96 (0.89) |
| ProMiR | 68 | 0.69 | 0.94 |
| 5-fold cross validation | 0.73 | 0.96 |
In contrast to the previous methods, the result of the comparison clearly demonstrates that our probabilistic method is more effective than previous methods and can be applied to identify miRNA with close homology as well as unrelated miRNAs (miRNAs with distant homology). Main reasons for the advanced results can be explained by several criteria. (i) The pairwise model considering structure and sequence of extended stem–loops. (ii) A sensible negative dataset; an approach to conserved structural motifs and MFE assessment, realistically using the MFE as evidence for miRNP. (iii) Additional evidence such as sequence conservation among vertebrates.
DISCUSSION
We have shown that probabilistic co-learning of structure and sequence is an effective method for the identification of miRNA genes with close or distant homology. It could also spontaneously predict mature miRNA regions. Another merit of the probabilistic model is that it provides a common method for identifying human miRNA genes as well as those from other species.
In the genome-wide screening of human miRNA, we determined a _P_-value threshold (0.033) from the screening performance ROC curve shown in Figure 2, where the sensitivity was 72.8% and the specificity was 95.9%, to minimize the number of false positive findings and maximize the number of true positive findings. The major reason for the requirement of high specificity is that genomes are very complex with noisy sequences such as repeat sequences, palindromic sequences, pseudogenes and transposons. Thus, the screening method should have a stringent classifier. Of course, we can adjust this threshold to fine-tune miRNA prediction. We performed human EST analysis and MFE tests to select the more probable candidates. Additional resources, such as vertebrate conservations and human repeat sequences, made it possible to screen for more reliable candidates. Finally, we verified the candidates by detecting the accumulation of pri-miRNA. The main purpose of the experiment was to determine whether the pre-miRNA candidates are indeed authentic Drosha substrates. Therefore, the experiments clearly demonstrate that our candidates are true positives (Figure 4). However, we still do not know whether the candidates not verified by the experiment are truly negative, because the candidates might be expressed in specific cell types but not in the tested cells.
The mean error of the mature miRNA region prediction results was 2.7 nt and the mean variation except for the 20 prediction failures was 2.0 nt. The main reasons for the error may have originated from inaccuracy of the cleavage of the pre-miRNA by Dicer, which bears an error of 1 nt and from overhanging ends of 2 nt at the 3′ end (51). In addition, there are several instances of incompatible data for the locations of mature miRNAs in the miRNA database (http://www.sanger.ac.uk/Software/Rfam/mirna/) that may lead to some errors in mature miRNA region prediction. When these limitations are considered, the result indicates that our algorithm gives meaningful results for the prediction of mature miRNA regions over pre-miRNAs.
The prediction of a functional strand on precursors is a problem related with region prediction. The internal stability of 5′ terminal base pairs for mature miRNA improved the effectiveness of prediction of the functional strand (14,15). However, ∼25% of the prediction results were false despite the clear criterion of internal stability. This is caused by the exceptional characteristics of pre-miRNA. Most mature miRNAs on the precursors are located in either the 5′ strand or the 3′ strand. However, some of the known miRNAs exist in both the strands simultaneously. In addition, most pre-miRNAs have extended stem–loop structures, but a few pre-miRNAs have branched stem–loop secondary structures. These exceptional features of miRNAs make it difficult to predict the orientation as well as the region of mature miRNAs. Moreover, because even 1 nt error in predicting the mature region can result in the change of functional strands, it is more difficult to verify the mature miRNAs of the correct length. We firmly feel that the improvement of our predictive model to overcome the limitations in terms of mature miRNA prediction may make it possible to address the problems.
Our study identified at least nine novel miRNA gene candidates from four chromosomes. Importantly, these novel miRNA candidates are not related to previously reported miRNAs. These new miRNAs may define a novel subfamily of miRNA genes as they have homologs and/or paralogs in many vertebrate genomes. Further refinement of our model and a more extensive screening is likely to yield a significant number of novel miRNAs from various organisms. Effective miRNA gene mining will greatly enhance our knowledge of small RNA-mediated regulatory networks.
SUPPLEMENTARY MATERIAL
Supplementary Material is available at NAR Online.
Supplementary Material
[Supplementary Material]
Acknowledgments
This work was supported by the National Research Laboratory programs (M10412000095-04J0000-03610 and M1050000010905J000010910) and the Systems Biology project (M10309000002-03B5000-00110) of the Korea Ministry of Science and Technology and the BK21-IT program of the Korean Ministry of Education. The ICT at Seoul National University provided research facilities for this study. Funding to pay the Open Access publication charges for this article was provided by the Korea Ministry of Science and Technology under the NRL program.
Conflict of interest statement. None declared.
REFERENCES
- 1.Bartel D.P. MicroRNAs: genomics, biogenesis, mechanism, and function. Cell. 2004;116:281–297. doi: 10.1016/s0092-8674(04)00045-5. [DOI] [PubMed] [Google Scholar]
- 2.Kim V.N. Small RNAs: classification, biogenesis, and function. Mol. Cells. 2005;19:1–15. [PubMed] [Google Scholar]
- 3.Lee Y., Kim M., Han J., Yeom K.H., Lee S., Baek S.H., Kim V.N. MicroRNA genes are transcribed by RNA polymerase II. EMBO J. 2004;23:4051–4060. doi: 10.1038/sj.emboj.7600385. [DOI] [PMC free article] [PubMed] [Google Scholar]
- 4.Cai X., Hagedorn C.H., Cullen B.R. Human microRNAs are processed from capped, polyadenylated transcripts that can also function as mRNAs. RNA. 2004;10:1957–1966. doi: 10.1261/rna.7135204. [DOI] [PMC free article] [PubMed] [Google Scholar]
- 5.Lee Y., Ahn C., Han J., Choi H., Kim J., Yim J., Lee J., Provost P., Radmark O., Kim S., Kim V.N. The nuclear RNase III Drosha initiates microRNA processing. Nature. 2003;425:415–419. doi: 10.1038/nature01957. [DOI] [PubMed] [Google Scholar]
- 6.Lund E., Guttinger S., Calado A., Dahlberg J.E., Kutay U. Nuclear export of microRNA precursors. Science. 2004;303:95–98. doi: 10.1126/science.1090599. [DOI] [PubMed] [Google Scholar]
- 7.Yi R., Qin Y., Macara I.G., Cullen B.R. Exportin-5 mediates the nuclear export of pre-microRNAs and short hairpin RNAs. Genes Dev. 2003;17:3011–3016. doi: 10.1101/gad.1158803. [DOI] [PMC free article] [PubMed] [Google Scholar]
- 8.Bohnsack M.T., Czaplinski K., Gorlich D. Exportin 5 is a RanGTP-dependent dsRNA-binding protein that mediates nuclear export of pre-miRNAs. RNA. 2004;10:185–191. doi: 10.1261/rna.5167604. [DOI] [PMC free article] [PubMed] [Google Scholar]
- 9.Bernstein E., Caudy A.A., Hammond S.M., Hannon G.J. Role for a bidentate ribonuclease in the initiation step of RNA interference. Nature. 2001;409:363–366. doi: 10.1038/35053110. [DOI] [PubMed] [Google Scholar]
- 10.Grishok A., Pasquinelli A.E., Conte D., Li N., Parrish S., Ha I., Baillie D.L., Fire A., Ruvkun G., Mello C.C. Genes and mechanisms related to RNA interference regulate expression of the small temporal RNAs that control C. elegans developmental timing. Cell. 2001;106:23–34. doi: 10.1016/s0092-8674(01)00431-7. [DOI] [PubMed] [Google Scholar]
- 11.Hutvagner G., McLachlan J., Pasquinelli A.E., Balint E., Tuschl T., Zamore P.D. A cellular function for the RNA-interference enzyme Dicer in the maturation of the let-7 small temporal RNA. Science. 2001;293:834–838. doi: 10.1126/science.1062961. [DOI] [PubMed] [Google Scholar]
- 12.Ketting R.F., Fischer S.E., Bernstein E., Sijen T., Hannon G.J., Plasterk R.H. Dicer functions in RNA interference and in synthesis of small RNA involved in developmental timing in C.elegans. Genes Dev. 2001;15:2654–2659. doi: 10.1101/gad.927801. [DOI] [PMC free article] [PubMed] [Google Scholar]
- 13.Knight S.W., Bass B.L. A role for the RNase III enzyme DCR-1 in RNA interference and germ line development in Caenorhabditis elegans. Science. 2001;293:2269–2271. doi: 10.1126/science.1062039. [DOI] [PMC free article] [PubMed] [Google Scholar]
- 14.Khvorova A., Reynolds A., Jayasena S.D. Functional siRNAs and miRNAs exhibit strand bias. Cell. 2003;115:209–216. doi: 10.1016/s0092-8674(03)00801-8. [DOI] [PubMed] [Google Scholar]
- 15.Schwarz D.S., Hutvagner G., Du T., Xu Z., Aronin N., Zamore P.D. Asymmetry in the assembly of the RNAi enzyme complex. Cell. 2003;115:199–208. doi: 10.1016/s0092-8674(03)00759-1. [DOI] [PubMed] [Google Scholar]
- 16.Lagos-Quintana M., Rauhut R., Lendeckel W., Tuschl T. Identification of novel genes coding for small expressed RNAs. Science. 2001;294:853–858. doi: 10.1126/science.1064921. [DOI] [PubMed] [Google Scholar]
- 17.Lagos-Quintana M., Rauhut R., Yalcin A., Meyer J., Lendeckel W., Tuschl T. Identification of tissue-specific microRNAs from mouse. Curr. Biol. 2002;12:735–739. doi: 10.1016/s0960-9822(02)00809-6. [DOI] [PubMed] [Google Scholar]
- 18.Mourelatos Z., Dostie J., Paushkin S., Sharma A., Charroux B., Abel L., Rappsilber J., Mann M., Dreyfuss G. miRNPs: a novel class of ribonucleoproteins containing numerous microRNAs. Genes Dev. 2002;16:720–728. doi: 10.1101/gad.974702. [DOI] [PMC free article] [PubMed] [Google Scholar]
- 19.Calin G.A., Dumitru C.D., Shimizu M., Bichi R., Zupo S., Noch E., Aldler H., Rattan S., Keating M., Rai K., et al. Frequent deletions and down-regulation of micro-RNA genes miR15 and miR16 at 13q14 in chronic lymphocytic leukemia. Proc. Natl Acad. Sci. USA. 2002;99:15524–15529. doi: 10.1073/pnas.242606799. [DOI] [PMC free article] [PubMed] [Google Scholar]
- 20.Houbaviy H.B., Murray M.F., Sharp P.A. Embryonic stem cell-specific MicroRNAs. Dev. Cell. 2003;5:351–358. doi: 10.1016/s1534-5807(03)00227-2. [DOI] [PubMed] [Google Scholar]
- 21.Dostie J., Mourelatos Z., Yang M., Sharma A., Dreyfuss G. Numerous microRNPs in neuronal cells containing novel microRNAs. RNA. 2003;9:180–186. doi: 10.1261/rna.2141503. [DOI] [PMC free article] [PubMed] [Google Scholar]
- 22.Michael M.Z., O'Connor S.M., van Holst Pellekaan N.G., Young G.P., James R.J. Reduced accumulation of specific microRNAs in colorectal neoplasia. Mol. Cancer Res. 2003;1:882–891. [PubMed] [Google Scholar]
- 23.Lim L.P., Glasner M.E., Yekta S., Burge C.B., Bartel D.P. Vertebrate microRNA genes. Science. 2003;299:1540. doi: 10.1126/science.1080372. [DOI] [PubMed] [Google Scholar]
- 24.Lagos-Quintana M., Rauhut R., Meyer J., Borkhardt A., Tuschl T. New microRNAs from mouse and human. RNA. 2003;9:175–179. doi: 10.1261/rna.2146903. [DOI] [PMC free article] [PubMed] [Google Scholar]
- 25.Kim J., Krichevsky A., Grad Y., Hayes G.D., Kosik K.S., Church G.M., Ruvkun G. Identification of many microRNAs that copurify with polyribosomes in mammalian neurons. Proc. Natl Acad. Sci. USA. 2004;101:360–365. doi: 10.1073/pnas.2333854100. [DOI] [PMC free article] [PubMed] [Google Scholar]
- 26.Kasashima K., Nakamura Y., Kozu T. Altered expression profiles of microRNAs during TPA-induced differentiation of HL-60 cells. Biochem. Biophys. Res. Commun. 2004;322:403–410. doi: 10.1016/j.bbrc.2004.07.130. [DOI] [PubMed] [Google Scholar]
- 27.Suh M.R., Lee Y., Kim J.Y., Kim S.K., Moon S.H., Lee J.Y., Cha K.Y., Chung H.M., Yoon H.S., Moon S.Y., et al. Human embryonic stem cells express a unique set of microRNAs. Dev. Biol. 2004;270:488–498. doi: 10.1016/j.ydbio.2004.02.019. [DOI] [PubMed] [Google Scholar]
- 28.Poy M.N., Eliasson L., Krutzfeldt J., Kuwajima S., Ma X., Macdonald P.E., Pfeffer S., Tuschl T., Rajewsky N., Rorsman P., Stoffel M. A pancreatic islet-specific microRNA regulates insulin secretion. Nature. 2004;432:226–230. doi: 10.1038/nature03076. [DOI] [PubMed] [Google Scholar]
- 29.Weber M.J. New human and mouse microRNA genes found by homology search. FEBS J. 2005;272:59–73. doi: 10.1111/j.1432-1033.2004.04389.x. [DOI] [PubMed] [Google Scholar]
- 30.Xie X., Lu J., Kulbokas E.J., Golub T.R., Mootha V., Lindblad-Toh K., Lander E.S., Kellis M. Systematic discovery of regulatory motifs in human promoters and 3′ UTRs by comparison of several mammals. Nature. 2005;434:338–345. doi: 10.1038/nature03441. [DOI] [PMC free article] [PubMed] [Google Scholar]
- 31.Griffiths-Jones S. The microRNA registry. Nucleic Acids Res. 2004;32:D109–D111. doi: 10.1093/nar/gkh023. [DOI] [PMC free article] [PubMed] [Google Scholar]
- 32.Lai E.C., Tomancak P., Williams R.W., Rubin G.M. Computational identification of Drosophila microRNA genes. Genome Biol. 2003;4:R42. doi: 10.1186/gb-2003-4-7-r42. [DOI] [PMC free article] [PubMed] [Google Scholar]
- 33.Legendre M., Lambert A., Gautheret D. Profile-based detection of microRNA precursors in animal genomes. Bioinformatics. 2005;21:841–845. doi: 10.1093/bioinformatics/bti073. [DOI] [PubMed] [Google Scholar]
- 34.Ohler U., Yekta S., Lim L.P., Bartel D.P., Burge C.B. Patterns of flanking sequence conservation and a characteristic upstream motif for microRNA gene identification. RNA. 2004;10:1309–1322. doi: 10.1261/rna.5206304. [DOI] [PMC free article] [PubMed] [Google Scholar]
- 35.Lim L.P., Lau N.C., Weinstein E.G., Abdelhakim A., Yekta S., Rhoades M.W., Burge C.B., Bartel D.P. The microRNAs of Caenorhabditis elegans. Genes Dev. 2003;2:2. doi: 10.1101/gad.1074403. [DOI] [PMC free article] [PubMed] [Google Scholar]
- 36.Krol J., Sobczak K., Wilczynska U., Drath M., Jasinska A., Kaczynska D., Krzyzosiak W.J. Structural features of microRNA (miRNA) precursors and their relevance to miRNA biogenesis and small interfering RNA/short hairpin RNA design. J. Biol. Chem. 2004;279:42230–42239. doi: 10.1074/jbc.M404931200. [DOI] [PubMed] [Google Scholar]
- 37.Hofacker I.L. Vienna RNA secondary structure server. Nucleic Acids Res. 2003;31:3429–3431. doi: 10.1093/nar/gkg599. [DOI] [PMC free article] [PubMed] [Google Scholar]
- 38.Nam J.W., Joung J.G., Ahn Y.S., Zhang B.T. Two-step genetic programming for optimization of RNA common-structure. LNCS. 2004;3005:73–83. [Google Scholar]
- 39.Forney G.D., Jr The Viterbi Algorithm. Proc. IEEE. 1973;61:268–278. [Google Scholar]
- 40.Chen J.H., Le S.Y., Shapiro B., Currey K.M., Maizel J.V. A computational procedure for assessing the significance of RNA secondary structure. Comput. Appl. Biosci. 1990;6:7–18. doi: 10.1093/bioinformatics/6.1.7. [DOI] [PubMed] [Google Scholar]
- 41.Bonnet E., Wuyts J., Rouze P., Van de Peer Y. Evidence that microRNA precursors, unlike other non-coding RNAs, have lower folding free energies than random sequences. Bioinformatics. 2004;20:2911–2917. doi: 10.1093/bioinformatics/bth374. [DOI] [PubMed] [Google Scholar]
- 42.Rivas E., Eddy S.R. Secondary structure alone is generally not statistically significant for the detection of noncoding RNAs. Bioinformatics. 2000;16:583–605. doi: 10.1093/bioinformatics/16.7.583. [DOI] [PubMed] [Google Scholar]
- 43.Berezikov E., Guryev V., van de Belt J., Wienholds E., Plasterk R.H., Cuppen E. Phylogenetic shadowing and computational identification of human microRNA genes. Cell. 2005;120:21–24. doi: 10.1016/j.cell.2004.12.031. [DOI] [PubMed] [Google Scholar]
- 44.Lee Y., Jeon K., Lee J.T., Kim S., Kim V.N. MicroRNA maturation: stepwise processing and subcellular localization. EMBO J. 2002;21:4663–4670. doi: 10.1093/emboj/cdf476. [DOI] [PMC free article] [PubMed] [Google Scholar]
- 45.Griffiths-Jones S., Bateman A., Marshall M., Khanna A., Eddy S.R. Rfam: an RNA family database. Nucleic Acids Res. 2003;31:439–441. doi: 10.1093/nar/gkg006. [DOI] [PMC free article] [PubMed] [Google Scholar]
- 46.Klein R.J., Eddy S.R. RSEARCH: finding homologs of single structured RNA sequences. BMC Bioinformatics. 2003;4:44. doi: 10.1186/1471-2105-4-44. [DOI] [PMC free article] [PubMed] [Google Scholar]
- 47.Eddy S.R. Profile hidden Markov models. Bioinformatics. 1998;14:755–763. doi: 10.1093/bioinformatics/14.9.755. [DOI] [PubMed] [Google Scholar]
- 48.Eddy S.R., Durbin R. RNA sequence analysis using covariance models. Nucleic Acids Res. 1994;22:2079–2088. doi: 10.1093/nar/22.11.2079. [DOI] [PMC free article] [PubMed] [Google Scholar]
- 49.Eddy S.R. A memory-efficient dynamic programming algorithm for optimal alignment of a sequence to an RNA secondary structure. BMC Bioinformatics. 2002;3:18. doi: 10.1186/1471-2105-3-18. [DOI] [PMC free article] [PubMed] [Google Scholar]
- 50.Siebert S., Backofen R. MARNA: A server for multiple alignment of RNAs. In: Mewes H.-W., Heun V., Frishman D., Kramer S., editors. Proceedings of the German Conference on Bioinformatics. GCB 2003. Vol. 1. München: belleville Verlag Michael Farin; 2003. pp. 135–140. [Google Scholar]
- 51.Zamore P.D. Ancient pathways programmed by small RNAs. Science. 2002;296:1265–1269. doi: 10.1126/science.1072457. [DOI] [PubMed] [Google Scholar]
Associated Data
This section collects any data citations, data availability statements, or supplementary materials included in this article.
Supplementary Materials
[Supplementary Material]
