Physical limits to biochemical signaling (original) (raw)
Abstract
Many crucial biological processes operate with surprisingly small numbers of molecules, and there is renewed interest in analyzing the impact of noise associated with these small numbers. Twenty-five years ago, Berg and Purcell showed that bacterial chemotaxis, where a single-celled organism must respond to small changes in concentration of chemicals outside the cell, is limited directly by molecule counting noise and that aspects of the bacteria's behavioral and computational strategies must be chosen to minimize the effects of this noise. Here, we revisit and generalize their arguments to estimate the physical limits to signaling processes within the cell and argue that recent experiments are consistent with performance approaching these limits.
Astriking fact about biological systems is that single molecular events can have macroscopic consequences. The most famous example is, of course, the storage of genetic information in a single molecule of DNA, so that changes in the structure of this single molecule (mutations) can have effects on animal behavior and body plan from generation to generation (1). But the dynamics of individual molecular interactions can influence behavior on much shorter time scales. Thus, we (and other animals) can see when a single molecule of rhodopsin absorbs a photon (2), and some animals can smell a single molecule of airborne odorant (3). Even if a single molecular event does not generate a specific behavior, the reliability of behavior still can be limited by inevitable fluctuations associated with counting random molecular events. Thus, the visual system has a regime where perception is limited by photon shot noise (4, 5), and the reliability with which bacteria can swim up a chemical gradient appears to be limited by noise in the measurement of the gradient itself (6). It is an open question whether biochemical signaling systems within cells operate close to the corresponding counting noise limits.
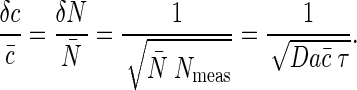
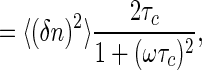
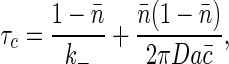
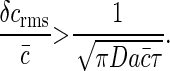
The analysis of bacterial chemotaxis by Berg and Purcell (6) provided a clear intuitive picture of the noise in “measuring” chemical concentrations. Their argument was that if we have a sensor with linear dimensions a, we expect to count an average of N̄ ∼ c̄a_3 molecules when the mean concentration is c̄. Each such measurement, however, is associated with a noise δ_N_1 ∼  . A volume with linear dimension a can be cleared by diffusion in a time τ_D ∼ _a_2/D, so if we are willing to integrate over a time τ we can make N_meas ∼ τ/τ_D independent measurements, reducing the noise in our estimate of N by a factor of
  . The result is that our fractional accuracy in measuring N, and hence in measuring the concentration c itself, is given by
 |
[1] |
|---|
A crucial claim of Berg and Purcell (6) is that this result applies when the sensor is a single receptor molecule, so that a is of molecular dimensions, as well as when the sensor is the whole cell, so that a ∼ 1 μm.
The discussion by Berg and Purcell (6) made use of several special assumptions that we suspect are not required, which leads to some clear questions: For interactions of a substrate with a single receptor, does Eq. 1 provide a general limit to sensitivity, independent of molecular and biochemical details? Can we understand explicitly how correlations among nearby receptors result in a limit like Eq. 1 but with a reflecting the size of the receptor cluster? Do the spatial correlations among nearby receptors have an analog in the time domain, so that there is a minimum averaging time required for noise reduction to be effective? Finally, if we can establish Eq. 1 or its generalizations as a real limit on sensitivity for any signaling process (Fig. 1), we would like to know if cells actually operate near this limit.
Fig. 1.

Measuring the concentration of a signaling molecule by a biological sensor, which in turn controls downstream events, is a generic task. Here, several examples are depicted schematically for E. coli. Binding of attractant/repellent molecules to a surface receptor complex modulates the rate of autophosphorylation of the associated kinase. This change in kinase activity results in a corresponding concentration change of the internal signaling molecule, CheY∼P, that controls the direction of flagellar motor rotation. Also shown is transcription initiation, where the promoter region can be regarded as a sensor for transcription factors (TF). These proteins, whose concentrations vary depending on the cell cycle and external cues, determine whether or not RNA polymerase (RNAP) turns on a gene.
We address these questions within the general framework of statistical mechanics through analysis of intrinsic fluctuations of the receptor-ligand system. In most cases that we know about, biochemical signaling molecules are thought to interact with their receptors through some kinetic processes that lead to equilibrium between bound and unbound states. In this case, fluctuations in occupancy of a binding site are a form of thermal noise. Rather than tracing through the consequences of different microscopic hypotheses about the nature of the interaction between signaling molecules and their targets, this connection to thermal noise allows us to use the fluctuation-dissipation theorem (7-9), which relates noise levels to macroscopic kinetics in the same way that Einstein connected the statistics of Brownian motion to the macroscopic frictional forces on the Brownian particle.
Our main result is a derivation of the accuracy limit to which biochemical receptors are able to measure concentrations of signaling molecules. Although analysis of fluctuations in chemically reacting systems has been an active area in theoretical chemistry (10-14), most existing approaches are based on the Fokker-Planck or Langevin equations and have focused on the detailed connection between kinetic parameters and observable fluctuation spectra. In contrast, our goal is to establish, if possible, general limits on the sensitivity or accuracy of signaling systems that are independent of the often unknown kinetic details. We begin with a simple example of binding to a single receptor to present the fluctuation-dissipation theorem for chemical kinetic systems and to show that we can recover conventional results. By considering the coupled binding and ligand diffusion processes, we derive the accuracy limit to measuring the concentration of a diffusing ligand, where we find a contribution from the chemical kinetics of the measurement process as well as a lower bound that depends only on molecule counting noise. Within the same framework, we extend this result from a single receptor to multiple, noninteracting receptors, addressing the more complex case of cooperative interactions among receptors elsewhere (W.B. and S.S., unpublished results). Our results can be summarized by saying that the intuitive estimates of Berg and Purcell in fact correspond to a “noise floor” that is independent of kinetic details; real systems can be noisier but not more precise than this limit.
We compare our results with two recent quantitative experiments on intracellular signaling in Escherichia coli, regulation of gene expression by transcription factors and control of the flagellar motor by the “response regulator” CheY∼P, and find that the performance of the cell is near the limit set by diffusive counting noise.
Theory
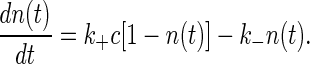
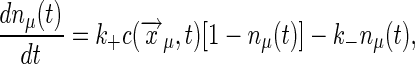
Binding to a Single Receptor. Consider a binding site for signaling molecules, and let the fractional occupancy of the site be n. If we do not worry about the discreteness of this one site, or about the fluctuations in concentration c of the signaling molecule, we can write a kinetic equation
 |
[2] |
|---|
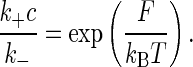
This equation describes the kinetics whereby the system comes to equilibrium. The free energy F associated with binding, which is given by the difference in the free energies of the unbound and bound states of the receptor, is related to the rate constant through detailed balance,
 |
[3] |
|---|
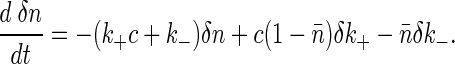
If we imagine that thermal fluctuations can lead to small changes δ_k_+ and δ_k_- in the rate constants, we can linearize Eq. 2 to obtain
 |
[4] |
|---|
But from Eq. 3 we have
 |
[5] |
|---|
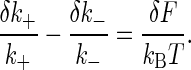
Applying this constraint to Eq. 4, we find that the individual rate constant fluctuations cancel, and all that remains is the fluctuation in the thermodynamic binding energy δ_F_; the resulting equation can be written in the form
 |
[6] |
|---|
It is useful to note the analogy between this chemical kinetic problem and the Langevin equation (15) for the position, X(t), of an overdamped Brownian particle bound by a Hookean spring. The spring generates a restoring force proportional to position, -κ_X_, and as the particle moves through the fluid it experiences a viscous drag with drag coefficient γ, so that the (Newtonian) equation of motion becomes
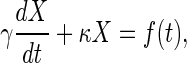 |
[7] |
|---|
where f(t) is a fluctuating force. The dissipative and fluctuating parts of the force on the Brownian particle are related through the fluctuation-dissipation theorem
 |
[8] |
|---|
where _k_B is the Boltzmann constant and T is the temperature; angle brackets denote ensemble averages. Intuitively, this relation is a consequence of the fact that the fluctuating and the dissipative forces both arise because of collisions of the Brownian particle with the molecules of the fluid.
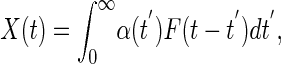
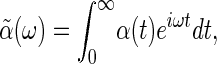
More generally, the linear response, X(t), of a system from equilibrium due to the thermodynamically conjugate “force,” F(t), defines the generalized susceptibility, α(t),
 |
[9] |
|---|
where we have taken 〈X(t)〉 = 0 (Fig. 2). The generalized susceptibility depends on the properties of the system and completely characterizes its response to small external perturbations. Fourier transforming
 |
[10] |
|---|
Fig. 2.

For the mass-spring system immersed in a viscous fluid, measuring the linear response of the position, X(t), to a known, small external force, F(t), determines the generalized susceptibility. From this susceptibility, the fluctuation-dissipation theorem can be used to obtain the power spectrum of fluctuations in the closed system at equilibrium, as in Eq. 11. These fluctuations provide a lower bound on the accuracy of any measurement of the position. If measurements are carried out on N identical mass-spring systems, the expected error is reduced by a factor of 1/ . However, as N increases, this improvement ceases to hold, as neighboring mass-spring systems become physically close enough to experience correlated fluctuations from collisions with the particle bath, as shown. These correlations have been measured for two optically trapped colloidal particles (16).
the response to an external force near equilibrium becomes  . In its general form, the fluctuation-dissipation theorem relates the imaginary part of the generalized susceptibility,
  , which determines how much energy is dissipated by a system as heat due to an external force, to the power spectrum of the spontaneous fluctuations of the corresponding coordinate, X, for the closed system in thermal equilibrium
 |
[11] |
|---|
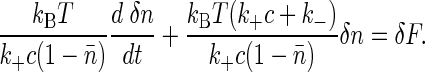
where Im [...] refers to the imaginary part. In the present chemical system, the “coordinates” are the concentrations of the interacting species, or equivalently the fractional occupancy of receptors, the phenomenological “equations of motion” are the chemical kinetic equations, and the thermodynamically conjugate “forces” are the free-energy differences among the species (17, 18) (Table 1).
Table 1. Linear response in mechanical and chemical systems.
| Physical quantity | Mass-spring system | Chemical system |
|---|---|---|
| Coordinate | Displacement | Receptor occupancy, δ_n_ = n - n̄ |
| Conjugate force | f | Free energy change δ_F_ = k_B_T (δ_k_+/k+ - δ_k_−/_k_−) |
| Spring constant | κ | k_B_T/[n̄ (1 - n̄)] |
| Damping constant | γ | k_B_T/(k_−_n̄) |
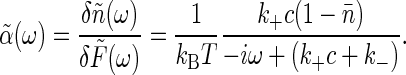
Fourier transforming, from Eq. 6 we find the generalized susceptibility,  , describing the response of the coordinate n to its conjugate force F,
 |
[12] |
|---|
The fluctuation-dissipation theorem relates this response function to the power spectrum of fluctuations in the occupancy, n,
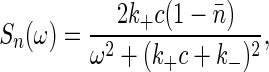 |
[13] |
|---|
 |
[14] |
|---|
where the total variance is
 |
[15] |
|---|
 |
[16] |
|---|
and the correlation time is given by τ_c_ = (k+c + _k_-)-1. These are the usual results for switching in a Markovian way between two states; here it follows from the “macroscopic” kinetic equations, as in Eq. 2, plus the fact that binding is an equilibrium process. Note that in using the fluctuation-dissipation theorem to arrive at this result, no assumptions are required about the underlying statistics of transitions between the bound and unbound states of the receptor. The Markovian nature of these transitions is reflected in the macroscopic chemical kinetic equations.
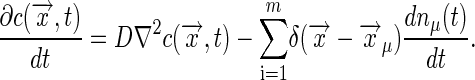
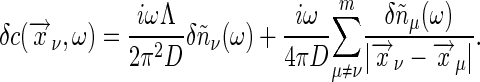
Coupled Binding and Diffusion. The same methods can be used in the more general case where the concentration itself has dynamics due to diffusion. Now we write
 |
[17] |
|---|
where the receptor is located at  , and
, and
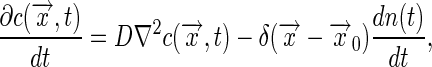 |
[18] |
|---|
where the last term expresses the “injection” of one molecule at the point  as it unbinds from the receptor. Linearizing the equations as before, and solving Eq. 18 by transforming to spatial Fourier variables, we find the linear response function
 |
[19] |
|---|
where c̃ is the mean concentration, and
 |
[20] |
|---|
We note that by obtaining the spatial Fourier transform of Eq. 18 over infinite volume, we are assuming the number of ligand molecules to be infinite at constant concentration. Hence, we are considering only the regime where the number of ligand molecules exceeds the number of receptors. The “self-energy” ∑ (ω) is ultraviolet divergent, which can be traced to the delta function in Eq. 18; we have assumed that the receptor is infinitely small. A more realistic treatment would give the receptor a finite size, which is equivalent to cutting off the k integrals at some (large) Λ ∼ π/a, with a the linear dimension of the receptor.
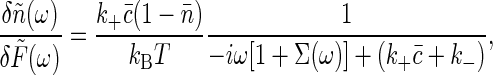
If we imagine mechanisms that read out the receptor occupancy and average over a time τ long compared with the correlation time τ_c_ of the noise, then the relevant quantity is the low frequency limit of the noise spectrum. Hence, we are interested in
 |
[21] |
|---|
and
 |
[22] |
|---|
Applying the fluctuation-dissipation theorem once again, we find
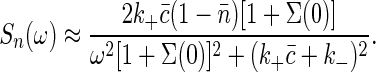 |
[23] |
|---|
The total variance in occupancy is unchanged because it is an equilibrium property of the system. Coupling to concentration fluctuations does serve to renormalize the correlation time of the noise, τ_c_ → τ_c_ [1 + ∑(0)]. The new τ_c_ can be written as
 |
[24] |
|---|
so the second term is a lower bound on τ_c_, independent of the kinetic parameters _k_±,
 |
[25] |
|---|
Again, the relevant quantity is the low-frequency limit of the noise spectrum,
 |
[26] |
|---|
If we average for a time τ, then the root-mean-square error in our estimate of n will be
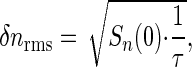 |
[27] |
|---|
and we see that this noise level has a minimum value independent of the kinetic parameters _k_±,
 |
[28] |
|---|
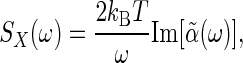
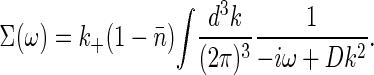
To relate these results back to the discussion by Berg and Purcell (6), we note that an overall change in concentration is equivalent to a change in F by an amount equal to the change in chemical potential, so that Δ_c_/c̄ ≡ Δ_F_/k_B_T. This equivalence means that there is an effective spectral density of noise in measuring c
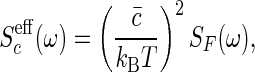 |
[29] |
|---|
where the “noise force” spectrum SF(ω) is given by the fluctuation-dissipation theorem as
 |
[30] |
|---|
In the present case, we find that
 |
[31] |
|---|
As before, the accuracy of a measurement that integrates for a time τ is set by
 |
[32] |
|---|
and we find again a lower bound that is determined only by the physics of diffusion,
 |
[33] |
|---|
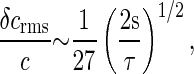
Note that this result is (up to a factor of  ) exactly the Berg-Purcell formula in Eq. 1.
Binding to Multiple, Noninteracting Receptors. To complete the derivation of Berg and Purcell's original results (6), we consider a collection of m receptor sites at positions  , where μ = 1, 2,..., m:
 |
[34] |
|---|
 |
[35] |
|---|
We can solve Eq. 35 by going to a spatial Fourier representation as before, and we find
 |
[36] |
|---|
where Λ is the cut-off wave number; as before, the cut-off arises to regulate the delta function in Eq. 35 and is related to the size of the individual receptor. In the limit 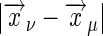 (ω/D)1/2 ≪ 1, for ν ≠ μ with ν, μ = 1,..., m, we have
 |
[37] |
|---|
Combining this equation with the Fourier transform of Eq. 34 and summing to find the total occupancy δ_Ñ_(ω) =  δ_n_μ(ω) of the receptor cluster, we obtain
 |
[38] |
|---|
In cluster geometries such that the innermost sum is independent of  , we can write the sum as
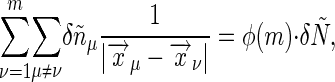 |
[39] |
|---|
where
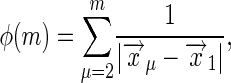 |
[40] |
|---|
and this simplification allows us to solve Eq. 38 directly to find the response of δ_Ñ_ to the force  . Then, as before, we use the fluctuation-dissipation theorem to find the spectrum of
  and convert that to an equivalent concentration error as in Eq. 31. The result is
 |
[41] |
|---|
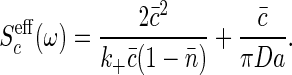
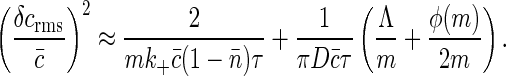
We note that whereas the first term is positive and depends on the details of the chemical kinetics of ligand-receptor binding, the second term defines a lower bound on the measurement accuracy of the ligand concentration by the receptor cluster that depends only on the physics of diffusion. As an example, for receptors of radius b uniformly distributed around a ring of radius a > b (Fig. 3), this lower bound is
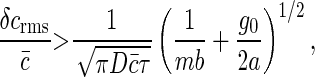 |
[42] |
|---|
Fig. 3.

Schematic representation of a cluster of m receptors of size b, distributed uniformly on a ring of size a. For a ≫ b, the relative accuracy in measurement of the substrate concentration improves as 1/ until mb ∼ a, at which point the binding/unbinding events of nearby receptors are no longer independent.
where for m ≫ 1, we have used φ(m) ≈ _mg_0/a; _g_0 is a geometric factor of order unity for typical cluster geometries and receptor distributions (W.B. and S.S., unpublished results). With an increasing number of receptors, m, the accuracy in measuring the substrate concentration ultimately is limited by the linear size of the cluster. Extension of this result to cooperatively interacting receptors is treated separately elsewhere (W.B. and S.S., unpublished results); remarkably, we find that this lower bound in measurement accuracy persists, independent of the details of cooperative interactions among the cluster subunits.
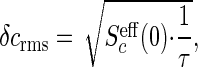
Summary. For both a single receptor and an array of receptors, we find that the sensitivity of signaling is limited, and this limit can be described as an effective noise in concentration, δ_c_rms, determined by
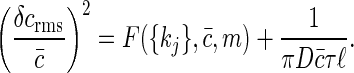 |
[43] |
|---|
In this summary, F({kj}, c̄, m) depends on the details of the kinetic interactions between the signaling molecules and its receptor through the kinetic parameters, {kj}, the substrate concentration, c̄, and the number of receptors, m. The important point is that this term is positive, so that even if we do not know the details of the ligand-receptor chemical kinetics, we know that the noise level can never be smaller than that set by the second term. In the second term ℓ is an effective size for the receptor or the receptor array; then, to within a factor, this term is exactly that written down by Berg and Purcell (Eq. 1) for a perfect concentration measuring device. Thus, although the original Berg and Purcell (6) arguments made use of very specific assumptions, we see that in the general case the details of the chemical signaling only add to the noise level.
Comparison with Experiment
Here, we consider two experimentally well-characterized examples to demonstrate how the theoretical limits on receptor occupancy noise and the resulting precision of concentration measurements compare with the performance of real cellular signaling systems.
Regulation of Gene Expression in Bacteria. Expression of genes is controlled in part by the occupancy of specific sites in the promotor regions adjacent to the sequences of DNA that code for protein (19). Reversing the usual picture of changes in transcription factor concentration as driving changes in gene expression, we can view gene expression as a sensor for the concentration of the transcription factor proteins that bind to the promoter site. In a bacterium like E. coli, transcription factors are present in _N_TF ∼ 100 copies in a cell of volume of ∼1 μm3 (20); presumably, the concentration of free transcription factor molecules is smaller than N_TF/V. Diffusion constants for small proteins in the E. coli cytoplasm are D ∼ 3 μm2/s (21); promoter sites have a linear dimension a ∼ 3 nm, and putting these factors together, we find the crucial combination of parameters π_Dac̄ ≲ 3 s-1.
If the transcription factor is a repressor then gene expression levels are determined by 1 - n, whereas if it is an activator then expression is related to n. Because δ_n_rms α n̄ (1 - n̄) (Eq. 28), fractional fluctuations in either A = n or A = 1 - n are determined by
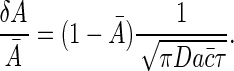 |
[44] |
|---|
The minimum fluctuations in expression level thus are given by
 |
[45] |
|---|
Recent experiments (22) indicate that E. coli achieves ≈10% precision in control of gene expression at small values of Ā. For this performance to be consistent with the physical limits, the transcription machinery must therefore integrate the promoter site occupancy for times of the order of 1 min, even assuming that the translation from occupancy to expression level itself is noiseless. This integration can be provided by the lifetime of the mRNA transcripts themselves, which is ∼3 min in prokaryotes (23). Recent theoretical work, motivated by ref. 22, has addressed the difference between “intrinsic” sources of noise in the regulation of gene expression in bacteria and “extrinsic” sources of noise that arise from population-level variations among cells (24-26). In this context, our results demonstrate the existence of a previously unappreciated intrinsic noise floor due to diffusion of transcription factors. In principle, this noise floor could be reduced by averaging over longer times, but very recent work on engineered regulatory elements in E. coli (27) shows that the correlation time of intrinsic noise is <10 min, suggesting that the time averaging done by this system is not much more than the minimum required to achieve the observed precision.
Control of the Flagellar Motor by CheY. The output of bacterial chemotaxis is control of the flagellar rotary motor (28). The phosphorylated form of the signaling protein CheY (CheY∼P) binds to the motor and modulates the probability of clockwise vs. counterclockwise rotation (29). Recent measurements (30) show that the probability p of clockwise rotation depends very steeply on the concentration c of CheY∼P,
 |
[46] |
|---|
with h ∼ 10 and _c_1/2 ∼ 3 μM. In the phenomenological description of the motor as a simple random telegraph process, switching between clockwise and counterclockwise rotation is governed by Poisson statistics. For c ≈ _c_1/2, the switching frequency is measured experimentally to be f ≈ 1.5 s-1. If we view the motor as a sensor for the internal messenger CheY∼P, then the observed behavior of the motor determines an equivalent noise level of
 |
[47] |
|---|
where τ0 is the correlation time of the motor state; for the simple telegraph model it can be shown that τ0 = 2_p_(1 - p)/f. Using Eq. 46 we find
 |
[48] |
|---|
Thus, for c ≈ _c_1/2, a single motor provides a readout of CheY∼P concentration accurate to ≈12% within 2 s.
The motor C ring has a diameter 2_a_ ∼ 45 nm, with m ∼ 34 individual subunits to which the CheY∼P molecules bind (31). From Eq. 42 we find
 |
[49] |
|---|
where we have taken the size of the individual receptor binding site to be b ∼ 1 nm, and D ∼ 3 μm2/s as above. Hence, for the collection of receptors comprising the motor, the physical limit to measurements of the CheY∼P concentration corresponds to ≈4% precision within 2 s.
Taken at face value, our estimates of the actual sensitivity and limiting sensitivity of the motor agree within a factor of three. Recent work shows that at constant CheY∼P concentration the power spectrum of motor bias deviates substantially from the Lorentzian prediction of the Poisson or telegraph model (32); in particular, there is peaking in the spectrum so that the low frequency limiting noise may be lower than estimated from the mean switching frequency. It also might be the case that even the very steep dependence in Eq. 46 is broadened by small errors in the concentration measurements (see note 17 in ref. 30), so that we underestimate the actual sensitivity of the motor. Thus, it is possible that there is an even closer agreement between the cell's performance and the physical limit, which could be tested in experiments pointed more specifically at this issue.
Concluding Remarks
We have derived from statistical mechanics the physical limits to the precision of concentration measurement for biological sensors that rely on the binding of a diffusing ligand to a receptor. Our approach complements and extends the classic work by Berg and Purcell (6), establishing that their intuitive result indeed does set a lower bound on the actual noise level. For a single receptor the accuracy in measurement of concentration is limited by the noise associated with the arrival of discrete substrate molecules at the receptor. Our approach extends in a straight-forward way to multiple receptors without relying on additional considerations; for this case, our result demonstrates more transparently the role of multiple receptors in improving the measurement accuracy, as well as that of correlations in insuring that this improvement saturates at a level set by the receptor cluster size. Relevant internal or external signaling molecules are often present in low copy numbers, and their concentration in turn regulates downstream biochemical networks crucial to the cell's functions. For two experimentally well-studied examples, we show that the cell's performance is close to the physical limits.
Acknowledgments
We thank T. Gregor, R. R. de Ruyter van Steveninck, D. W. Tank, and E. F. Wieschaus for many helpful discussions. This work was supported in part by the Materials Research Science and Engineering Centers Program of the National Science Foundation under Award DMR-0213706, National Institutes of Health Grant P50 GM071508, and by the Princeton University Council on Science and Technology.
Author contributions: W.B. and S.S. designed research, performed research, and wrote the paper.
References
- 1.Schrödinger, E. (1944) What is Life? (Cambridge Univ. Press, Cambridge, U.K.).
- 2.Rieke, F. & Baylor, D. A. (1998) Rev. Mod. Phys. 70 1027-1036. [Google Scholar]
- 3.Boeckh, J., Kaissling, K. E. & Schneider, D. (1965) Cold Spring Harbor Symp. Quant. Biol. 30 263-281. [DOI] [PubMed] [Google Scholar]
- 4.Barlow, H. B. (1981) Proc. R. Soc. London B 212 1-34. [DOI] [PubMed] [Google Scholar]
- 5.Rieke, F., Warland, D., de Ruyter van Stevenick, R. & Bialek, W. (1997) Spikes: Exploring the Neural Code (MIT Press, Cambridge, MA).
- 6.Berg, H. C. & Purcell, E. M. (1977) Biophys. J. 20 193-219. [DOI] [PMC free article] [PubMed] [Google Scholar]
- 7.Callen, H. B. & Greene, R. F. (1952) Phys. Rev. 86 702-710. [Google Scholar]
- 8.Kubo, R. (1966) Rep. Prog. Phys. 29 255-284. [Google Scholar]
- 9.Landau, L. D. & Lifshitz, E. M. (1980) Statistical Physics: Part I (Pergamon Press, Oxford).
- 10.Chen, Y. D. (1975) J. Theor. Biol. 55 229-243. [DOI] [PubMed] [Google Scholar]
- 11.Chen, Y. D. (1977) J. Chem. Phys. 65 357-367. [Google Scholar]
- 12.Chen, Y. D. (1977) J. Chem. Phys. 66 2431-2434. [Google Scholar]
- 13.Chen, Y. D. (1978) J. Chem. Phys. 68 1871-1875. [Google Scholar]
- 14.McQuarrie, D. A. & Keizer, J. E. (1981) Theoretical Chemistry: Advances and Perspectives 6A 165-213. [Google Scholar]
- 15.Langevin, P. (1908) C. R. Acad. Sci. (Paris) 146, 530;; trans. Lemons, D. S. & Gythiel, A. (1997) Am. J. Phys. 65 1079-1081. [Google Scholar]
- 16.Meiners, J. C. & Quake, S. R. (1999) Phys. Rev. Lett. 82 2211-2214. [Google Scholar]
- 17.Katchalsky, A. & Curran, P. F. (1965) Nonequilibrium Thermodynamics in Biophysics (Harvard Univ. Press, Cambridge, MA).
- 18.Bialek, W. (1987) Ann. Rev. Biophys. Biophys. Chem. 16 455-478. [DOI] [PubMed] [Google Scholar]
- 19.Ptashne, M. (1992) A Genetic Switch: Phage λ and Higher Organisms (Blackwell, Cambridge, MA).
- 20.Guptasarma, P. (1995) BioEssays 17 987-997. [DOI] [PubMed] [Google Scholar]
- 21.Elowitz, M. B., Surette, M. G., Wolf, P. E., Stock, J. B. & Leibler, S. (1999) J. Bacteriol. 181 197-203. [DOI] [PMC free article] [PubMed] [Google Scholar]
- 22.Elowitz, M. B., Levine, A. J., Siggia, E. D. & Swain, P. D. (2002) Science 207 1183-1186. [DOI] [PubMed] [Google Scholar]
- 23.Bernstein, J. A., Khodursky, A. B., Lin, P. H., Lin-Chao, S. & Cohen, S. N. (2002) Proc. Natl. Acad. Sci. USA 99 9697-9702. [DOI] [PMC free article] [PubMed] [Google Scholar]
- 24.Swain, P. S., Elowitz, M. B. & Siggia, E. D. (2002). Proc. Natl. Acad. Sci. USA 99 12795-12800. [DOI] [PMC free article] [PubMed] [Google Scholar]
- 25.Shibata, T. & Fujimoto, K. (2005) Proc. Natl. Acad. Sci. USA 102 331-336. [DOI] [PMC free article] [PubMed] [Google Scholar]
- 26.Paulsson, J. (2004) Nature 427 415-418. [DOI] [PubMed] [Google Scholar]
- 27.Rosenfeld, N., Young, J. W., Alon, U., Swain, P. S. & Elowitz, M. B. (2005) Science 307 1962-1965. [DOI] [PubMed] [Google Scholar]
- 28.Berg, H. C. (1983) Random Walks in Biology (Princeton Univ. Press, Princeton).
- 29.Falke, J. J., Bass, R. B., Butler, S. L., Chervitz, S. A. & Danielson, M. A. (1997) Ann. Rev. Cell Dev. Biol. 13 457-512. [DOI] [PMC free article] [PubMed] [Google Scholar]
- 30.Cluzel, P., Surette, M. & Leibler, S. (2000) Science 287 1652-1655. [DOI] [PubMed] [Google Scholar]
- 31.Thomas, D. R., Morgan, D. G. & DeRosier, D. J. (1999) Proc. Natl. Acad. Sci. USA 96 10134-10139. [DOI] [PMC free article] [PubMed] [Google Scholar]
- 32.Korobkova, E., Emonet, T., Vilar, J. M. G., Shimizu, T. S. & Cluzel, P. (2004) Nature 428 574-578. [DOI] [PubMed] [Google Scholar]