Extended Linkage Disequilibrium Surrounding the Hemoglobin E Variant Due to Malarial Selection (original) (raw)
Abstract
The hemoglobin E variant (HbE; β26Glu→Lys) is concentrated in parts of Southeast Asia where malaria is endemic, and HbE carrier status has been shown to confer some protection against Plasmodium falciparum malaria. To examine the effect of natural selection on the pattern of linkage disequilibrium (LD) and to infer the evolutionary history of the HbE variant, we analyzed biallelic markers surrounding the HbE variant in a Thai population. Pairwise LD analysis of HbE and 43 surrounding biallelic markers revealed LD of HbE extending beyond 100 kb, whereas no LD was observed between non-HbE variants and the same markers. The inferred haplotype network suggests a single origin of the HbE variant in the Thai population. Forward-in-time computer simulations under a variety of selection models indicate that the HbE variant arose 1,240–4,440 years ago. These results support the conjecture that the HbE mutation occurred recently, and the allele frequency has increased rapidly. Our study provides another clear demonstration that a high-resolution LD map across the human genome can detect recent variants that have been subjected to positive selection.
Introduction
The human population has been subjected to natural selection caused by infectious organisms, and few diseases have left as strong an imprint on our genome as malaria. Plasmodium falciparum malaria, the most deadly of the four types of the disease (the other three are P. vivax, P. ovale, and P. malariae), kills 1%–2% of infected individuals, or 2–3 million people annually. A number of genetic variants have been reported to be associated with susceptibility or resistance to malarial infection. If a genetic variant that is protective against malaria appears in a malaria-endemic area, the population frequency of the variant is expected to increase because of positive selection.
The best example is the hemoglobin S variant (HbS; β6Glu→Val), which has a single amino acid substitution in the β-globin chain (Friedman 1978; Pasvol et al. 1978). The substitution from glutamic acid to valine at residue 6 affects hemoglobin structure and warps red blood cells into a characteristic sickle shape, and individuals who are homozygous for HbS develop severe sickle-cell anemia. Despite the homozygous disadvantage, HbS has been commonly observed in populations exposed to P. falciparum malaria, such as Africa, the Middle East, and India, because of an advantage against malaria among heterozygotes. This observation is consistent with Haldane’s malaria hypothesis (Haldane 1949). Although HbS is rare in Southeast Asia, thalassemias and hemoglobinopathies, caused by genetic variants of α- and β-globins, are common in parts of Southeast Asia where P. falciparum malaria is endemic (Fucharoen and Winichagoon 1987).
The hemoglobin E variant (HbE; β26Glu→Lys) is the most frequent of these variants in Southeast Asia. The prevalence of HbE is concentrated especially at the junction of Thailand, Laos, and Cambodia, although the frequency of HbE differs among local populations (Fucharoen and Winichagoon 1987). Like HbS, HbE reduces erythrocyte plasticity and deformability, leading to reduced capillary perfusion. Thus, the carriers of HbE appear to enjoy some protection against P. falciparum malaria. This conjecture has been supported by both epidemiological (Hutagalung et al. 1999, 2000) and experimental (Bunyaratvej et al. 1986; Vernes et al. 1986; Chotivanich et al. 2002) studies and is now generally accepted.
Considering the geographical specificity and the high population frequency of HbE, a mutation causing HbE appears to have occurred in Southeast Asia, and the frequency is likely to have increased because of positive selection against malarial infection. If this scenario is true, a high degree of linkage disequilibrium (LD) between HbE and nearby polymorphic markers is expected. The geographical specificity of HbE also suggests a recent origin of this variant, although the age of HbE has never been estimated. Thus, in this study, we estimate the age of the HbE mutation by using a forward-in-time simulation.
Material and Methods
Samples and Biallelic Markers
Thai patients with mild P. falciparum malaria living in Suan Pung, Thailand, near the border with Myanmar, were recruited for this study. The diagnosis of mild malaria is described elsewhere (Ohashi et al. 2002). First, 48 patients with mild malaria (designated as the “random set”) were randomly selected from our patient samples (Ohashi et al. 2002) and their HbE genotypes were determined by PCR direct sequencing. The genotype counts were 2 HbE/HbE, 8 HbE/HbA, and 38 HbA/HbA. From the JSNP (Hirakawa et al. 2002) and Celera databases, ∼200 biallelic markers surrounding HbE were selected and then genotyped for a screening set of 15 individuals (30 chromosomes): 2 individuals with HbE/HbE, 5 individuals with HbE/HbA, and 8 individuals with HbA/HbA. In this screen, at least one heterozygous individual was detected at 121 biallelic markers. Among them, markers with minor alleles that were found in at least five chromosomes were chosen first. Then, to reduce the genotyping cost, some of markers found to be in strong LD were excluded from the further analysis. As a result, 43 markers remained (table 1) and were analyzed in the remaining 33 individuals. To avoid overestimating the degree of pairwise LD between HbE and the markers, an additional 16 patients with mild malaria and with HbE (1 homozygote and 15 heterozygotes), obtained from the further screening of HbE in our patient samples, were genotyped for the 43 markers. The position of each marker was determined on the basis of GenBank sequence entry NT_028310.8. That is, the 43 markers were genotyped in a total of 64 individuals for the calculation of pairwise D′ (Lewontin 1964). The sample set consisting of 64 individuals is called the “enriched set” in this study. This study was approved by the institutional review board of the Faculty of Tropical Medicine at Mahidol University, and informed consent was obtained from all participants.
Table 1.
Profile of HbE and 43 Surrounding Biallelic Markers in a Random Set of 48 Individuals
| No. of Markers with | Allele Frequency of | ||||||
|---|---|---|---|---|---|---|---|
| MarkerID | MarkerPosition onNT_028310.8a | AAb | Aab | aab | Major Allele (p) | Minor Allele (q) | P Value for Hardy-Weinberg Equilibrium Test |
| 1 | 1625273 | 16 | 22 | 10 | .56 | .44 | .63 |
| 2 | 1629266 | 26 | 18 | 4 | .73 | .27 | .73 |
| 3 | 1629289 | 34 | 13 | 1 | .84 | .16 | .85 |
| 4 | 1629345 | 30 | 15 | 3 | .78 | .22 | .55 |
| 5 | 1629378 | 33 | 11 | 4 | .80 | .20 | .05 |
| 6c | 1632063 | 17 | 18 | 7 | .62 | .38 | .55 |
| 7c | 1632153 | 17 | 20 | 8 | .60 | .40 | .62 |
| 8c,e | 1642690 | 22 | 24 | 2 | .71 | .29 | .15 |
| 9c,e | 1642826 | 26 | 21 | 1 | .76 | .24 | .16 |
| 10c,e | 1642851 | 26 | 21 | 1 | .76 | .24 | .16 |
| 11c,e | 1643584 | 18 | 21 | 9 | .59 | .41 | .52 |
| 12c | 1649418 | 14 | 26 | 6 | .59 | .41 | .26 |
| 13c | 1649463 | 19 | 25 | 2 | .68 | .32 | .08 |
| 14c,e | 1652161 | 17 | 25 | 6 | .61 | .39 | .49 |
| 15c | 1652374 | 17 | 22 | 4 | .65 | .35 | .41 |
| 16c | 1660282 | 17 | 27 | 3 | .65 | .35 | .07 |
| 17c | 1660383 | 20 | 25 | 2 | .69 | .31 | .09 |
| 18c,e | 1661232 | 21 | 20 | 7 | .65 | .35 | .54 |
| 19c,e | 1661388 | 22 | 24 | 2 | .71 | .29 | .15 |
| 20c,e | 1662609 | 17 | 27 | 4 | .64 | .36 | .14 |
| 21c,e | 1662667 | 21 | 25 | 2 | .70 | .30 | .10 |
| 22 (HbE)c,e | 1663049 | 38 | 8 | 2 | .88 | .13 | .10 |
| 23c,e | 1663119 | 20 | 26 | 2 | .69 | .31 | .07 |
| 24 | 1663517 | 20 | 21 | 7 | .64 | .36 | .70 |
| 25 | 1663704 | 16 | 19 | 13 | .53 | .47 | .16 |
| 26d | 1665044 | 19 | 21 | 8 | .61 | .39 | .60 |
| 27d | 1679022 | 26 | 15 | 6 | .71 | .29 | .13 |
| 28d | 1684682 | 20 | 21 | 7 | .64 | .36 | .70 |
| 29d | 1706408 | 18 | 23 | 7 | .61 | .39 | .94 |
| 30d | 1706439 | 18 | 23 | 7 | .61 | .39 | .94 |
| 31d | 1706504 | 25 | 17 | 6 | .70 | .30 | .27 |
| 32d | 1738264 | 24 | 16 | 8 | .67 | .33 | .08 |
| 33d | 1741313 | 31 | 11 | 6 | .76 | .24 | .01f |
| 34d | 1743237 | 13 | 20 | 13 | .50 | .50 | .38 |
| 35d | 1758087 | 23 | 22 | 3 | .71 | .29 | .45 |
| 36d | 1758195 | 23 | 18 | 7 | .67 | .33 | .28 |
| 37d | 1758205 | 23 | 18 | 7 | .67 | .33 | .28 |
| 38d | 1767334 | 21 | 21 | 5 | .67 | .33 | .94 |
| 39 | 1767376 | 26 | 18 | 2 | .76 | .24 | .61 |
| 40 | 1784499 | 19 | 18 | 10 | .60 | .40 | .16 |
| 41 | 1784601 | 18 | 21 | 7 | .62 | .38 | .83 |
| 42 | 1784652 | 18 | 21 | 7 | .62 | .38 | .83 |
| 43 | 1801682 | 25 | 18 | 5 | .71 | .29 | .52 |
| 44 | 1801772 | 29 | 15 | 4 | .76 | .24 | .32 |
Genotyping
All of the biallelic markers, including HbE, were analyzed by PCR direct sequencing by use of an ABI PRISM 3100 Genetic Analyzer (Perkin-Elmer Applied Biosystems). The protocol is available on request.
LD and Haplotype Frequency Estimation
LD measures between pairs of 44 biallelic polymorphic sites, including HbE, were quantified using the statistic D′ (Lewontin 1964). Pairwise |D′| was estimated from genotyping data by use of the expectation-maximization (EM) algorithm (Excoffier and Slatkin 1995) implemented in the LDfinder software developed by J.O. (Omi et al. 2003). The results of pairwise |D′| were visualized by the GOLD program (Abecasis and Cookson 2000) (GOLD Home Page). The frequency of haplotypes consisting of HbE and 11 biallelic markers in region I were estimated by the EM algorithm (Excoffier and Slatkin 1995) by use of Arlequin software (Schneider et al. 2000) (Arlequin's Home on the Web).
Hardy-Weinberg Equilibrium Test
The individuals in the random set of this study were assumed to be selected randomly with respect to the HbE genotype. If several biallelic markers reveal a significant deviation from Hardy-Weinberg equilibrium, the random set would not be suitable for the present analyses. To examine this, a χ2 test with 1 df was performed.
Computer Simulation
A Monte Carlo simulation developed in our previous studies (Ohashi and Tokunaga 2000_a_, 2000_b_) was performed for estimating the age of HbE. This method allows us to consider both random genetic drift and several forms of natural selection in the simulation process. Two linked biallelic sites (HbE site and a biallelic marker in region II) were assumed to have two alleles each. Here, H and h alleles refer to HbA and HbE, and M and m are alleles at a linked biallelic marker. No recurrent mutation was assumed at either site. Because the haplotype analysis suggested a single origin of HbE, a single copy of h was assumed to exist at the initial state in each simulation run. In addition, h was assumed to be in positive LD with m, with an allele frequency of 0.3 at the initial state, because the frequencies of minor alleles in LD with HbE were ∼0.3 at most markers in region II. Thus, initial haplotype frequencies of h-m, h-M, H-m, and H-M were 1/(2_N_), 0, 0.3–1/(2_N_), and 0.7, respectively, where N is the initial population size. Two natural-selection models were examined. In the first model, a fitness of 1-s was assumed for the HH genotype, relative to the Hh and hh genotypes (dominant selection), and, in the second model, a fitness of 1-s was assumed for the HH and hh genotypes, relative to the Hh genotype (overdominant selection), where s is the selection coefficient. Recombination was assumed to occur between two sites, with a probability of r per generation. The population size was increased at a growth rate of g. In each iteration of the simulation, values of s and r were drawn from a uniform prior distribution with the ranges s (0–0.1) and r (0–0.015). In the simulation for an individual, two genes (two haplotypes) were randomly chosen from a population with replacement, and the genotype (diplotype) was determined. According to the selection model, the fitness of this individual was compared with a random number that was generated in the range of 0–1. When the former was larger than the latter, this individual transmitted one of two haplotypes to the next generation. Each simulation run was terminated when the population frequency of h reached ⩾0.13. The rejection method was used to accept only simulation runs that resembled the present observed value of D′ when the run was terminated (i.e., D′ of accepted runs was within 20% of 0.7), and the parameter values, such as age of h, s, and r, were recorded.
Statistical Test for Detecting Reduced Haplotype Diversity
A novel method for detecting recent positive selection has been described (Sabeti et al. 2002). This method utilizes extended haplotype homozygosity (EHH) at a distance, x, from the core region; EHH is defined as the probability that two randomly chosen chromosomes from the samples carrying a tested core haplotype are homozygous at all SNPs for the entire interval from the core region to the distance x. Markers flanking a core haplotype bearing an allele that has been subjected to positive selection are expected to show higher homozygosity than those flanking other core haplotypes. Thus, if positive selection has operated, the ratio of the EHH on the tested core haplotype to that on other core haplotypes is expected to be >1. This can be tested statistically, as described in a study by Sabeti et al. (2002). However, because the gametic phases of our samples are unknown, EHH cannot be calculated properly for the present data. Although the best haplotype guess for each individual can be obtained by a statistical method (Stephens et al. 2001), the estimated haplotype or phase is not always correct. It is unknown how such an error influences the statistical test based on EHH. Thus, the method based on EHH was not applied to our study. Instead of choosing two chromosomes randomly from sampled chromosomes, we chose individuals who were homozygous for HbE and HbA (3 individuals with HbE/HbE and 38 individuals with HbA/HbA) from the enriched set and calculated the proportion of major homozygous sites among 43 biallelic markers for each individual to compare the homozygosity between HbE/HbE and HbA/HbA groups. The “major” homozygote or “major” allele at each marker was defined on the basis of the frequency in each group. Therefore, the major homozygote at a certain site for the HbE/HbE group may be different from that for the HbA/HbA group.
Results
Profile of Biallelic Markers
The β-globin gene (HBB [MIM 141900]) is located at 11p15.5 (fig. 1_A_). The allele frequency of HbE was 0.13 in a set consisting of 48 individuals randomly selected from our patients living in Thailand with mild P. falciparum malaria (table 1). From the random set, 15 individuals (2 homozygotes with HbE, 5 heterozygotes with HbE and the normal allele [HbA], and 8 homozygotes with HbA) were selected and screened for >150 biallelic markers, such as single-nucleotide polymorphisms (SNPs) and insertions/deletions found in the databases; at least one heterozygote was found at 121 biallelic markers spanning 183 kb (fig. 1_A_–1_C_). On the basis of the genotypes of the 15 individuals, 43 markers with a high-frequency minor allele were selected from the 121-marker group (fig. 1_C_). Table 1 shows the profile of these markers (the individual genotypes are provided in an online-only tab-delimited data set). One of the markers deviated from Hardy-Weinberg equilibrium at a significance level of .05, whereas other polymorphisms, including the HbE variant, conformed to Hardy-Weinberg proportions. Thus, we may say that the method for identifying the random set did not bias the sample with respect to relative proportions of HbA/HbE genotypes.
Figure 1.

Biallelic markers used in this study and profile of LD around HbE. A, Location of nine genes in the genomic region studied. B, Location of HbE and 121 biallelic markers. C, Genotypes of HbE and 121 biallelic markers in 15 individuals. D, Pairwise |D′| between HbE and 43 biallelic markers in an enriched set of 64 individuals (see the “Material and Methods” section for details). The interval between regions I and II spans 2.0 kb.
It should be noted that the frequency of HbE in the studied population may be >0.13 because only patients with malaria were analyzed here. In such a case, the degree of LD of HbE may have been overestimated and the HbE haplotype diversity may have been underestimated. Thus, the population frequency of HbE remains to be studied.
Extended LD of HbE
To assess whether natural selection against malarial infection has influenced the pattern of LD around HbE, all possible pairwise |D′| measures among 44 markers were estimated in an enriched set consisting of 64 individuals (fig. 1_D_). The use of this “enriched” set can avoid overestimating |D′| between HbE and the other markers caused by the small number of individuals with HbE in a random set. In actuality, when pairwise |D′| values were calculated from the random set, most markers showed higher |D′| with HbE than those presented in figure 1_D_. Two distinct regions (designated regions I and II) showed strong LD (fig. 1_D_). HbE lies within region I. Of particular interest, LD with HbE extended to markers in region II (the physical distance of LD was >100 kb), whereas the other markers in region I showed no LD with markers in region II. Because there is an obvious boundary spanning only 2.0 kb between regions I and II (fig. 1 and table 1), it is hypothesized that many recombination events have occurred in this narrow region (i.e., a recombination hotspot is included in this narrow region). This perspective is consistent with those from previous studies that suggested a recombination hotspot in the β-globin gene cluster (Chakravarti et al. 1984; Smith et al. 1998; Schneider et al. 2002; Wall et al. 2003).
HbE Haplotype in a Thai Population
To examine whether extant HbE alleles arose from a single mutation event, the frequencies of haplotypes consisting of HbE and 10 markers in region I were estimated, and we identified four major haplotypes (H1–H4) with a population frequency of >0.03. The haplotype network in figure 2 shows that HbE is carried only on the H1 haplotype, and this is the difference between the H1 and H2 haplotypes. Thus, the H1 haplotype appears to have arisen from the H2 haplotype by a single mutation of HbE.
Figure 2.

Haplotype network for HbE and 10 biallelic markers in region I. The four major haplotypes with an estimated population frequency of >0.03 are shown as open circles, with the estimated haplotype frequency shown at the right. Each line segment between two circles indicates a single mutation event; small closed circles represent putative intermediate haplotypes.
Estimation of Age of HbE
HbE showed similar pairwise |D′| for most of markers in region II of figure 1, suggesting that recombination has occurred only in the boundary between regions I and II since the occurrence of the HbE mutation. The pairwise |D′| values between HbE and the markers in region II were ∼0.7 in a random set (fig. 3). In addition, the result of haplotype-frequency estimation revealed that HbE was in LD with the most common haplotype consisting of biallelic markers in region II. Thus, the age of HbE can be inferred by estimating the number of generations required to decrease |D′| to 0.7 and to increase the population frequency of HbE to 0.13. A simple Monte Carlo simulation incorporating natural selection enabled us to infer the age of HbE. Here, two linked biallelic sites, each with two alleles, were assumed to represent the HbE site and one of the biallelic markers in region II. As for the mode of natural selection, two selection models, dominant selection and overdominant selection, were considered. Because it is hard to estimate the selection coefficient of HbE (s) and the recombination rate between regions I and II (r) from the observed data, s and r were drawn from a uniform prior distribution with the ranges s (0–0.1) and r (0–0.015) for each simulation run. The initial population size was set to 10,000, and two population histories were examined: (1) the population size has been constant (_g_=0), and (2) the size has increased at a growth rate of 0.001/generation (_g_=0.001).
Figure 3.

Pairwise |D′| between HbE and 43 biallelic markers in a random set of 48 individuals (see the “Material and Methods” section for details).
In each history of each selection model, >100,000 runs were performed. The rejection method allowed us to collect 2,013 and 1,367 runs for histories (1) and (2), respectively; the dominant-selection model resulted in a |D′| value of ∼0.7 when the population frequency of HbE reached 0.13. In the overdominant-selection model, 2,420 and 1,462 runs fulfilled the rejection criteria for histories (1) and (2), respectively. Figure 4 shows the frequency distributions of the age of HbE from the simulations. The means and 95% credibility intervals are presented in table 2. We can see that a population growth rate of ∼0.001 does not strongly influence the simulation results in either of the selection models. The case of _g_=0.002 also gave similar results (data not shown). In addition, there were no marked differences in the means of age, s, and r between selection models in table 2 (the reason will be discussed in the “Discussion” section). The mild hemolytic anemia and mild splenomegaly characteristics of HbE homozygotes are mostly benign. Furthermore, both HbE homozygotes and HbE heterozygotes (those with the HbE trait) display resistance to malaria (Hutagalung et al. 1999, 2000). Thus, although the mode of natural selection operating at HbE is not well understood, values obtained from the simulation assuming _g_=0.001 under dominant selection are regarded as representative in this study. If one generation corresponds to 20 years, the mean estimated age of the HbE variant was 2,006 years, with a 95% credibility interval of 1,240–4,440 years. These results strongly support the hypothesis that the HbE mutation occurred recently and that the allele frequency has increased rapidly because of the resistance to malaria.
Figure 4.

Frequency distributions of the age of HbE obtained from the simulations under dominant- and overdominant-selection methods. The population size was assumed to have been constant (_g_=0) or to have been increased by a growth rate of 0.001/generation (_g_=0.001). The means and 95% credibility intervals are presented in table 2.
Table 2.
Means and 95% Credibility Intervals of Age of HbE, Selection Coefficient (s), and Recombination Rate (r) in Dominant- and Overdominant-Selection Models[Note]
| Mean (95% Credibility Interval) for | ||||
|---|---|---|---|---|
| Dominant-Selection Model | Overdominant-Selection Model | |||
| Parameter | History 1a | History 2b | History 1a | History 2b |
| Agec | 98.9 (61–189) | 100.3 (62–222) | 103.2 (64–209) | 104.8 (64–219) |
| s | .079 (.039–.099) | .079 (.035–.099) | .079 (.037–.99) | .078 (.034–.099) |
| r | .0059 (.0013–.0126) | .0057 (.0013–.0126) | .0057 (.0012–.0122) | .0057 (.0013–.0122) |
Estimation of Recombination Rate at the Boundary between Regions I and II
A simulation analysis suggested that the recombination rate at the boundary between regions I and II was in the range of 0.0013–0.0126/generation (table 2). It is interesting to note that the mean recombination rate of 0.0057 obtained from computer simulation in this study exactly coincides with the estimated recombination rate from likelihood methods based on the patterns of LD in an African population (Wall et al. 2003). Because the boundary spans 2.0 kb, this corresponds to 65–638 cM/Mb on the basis of Haldane’s mapping function. Recently, a recombination rate for the hotspot located at the same region has been directly estimated to be ∼0.009/male meiosis from single-sperm–typing data (Schneider et al. 2002). Thus, the recombination rate estimated in our simulation is considered to be consistent with that obtained from the direct measurement.
Reduced HbE Haplotype Diversity
To examine whether haplotypes bearing HbE show low diversity compared with those bearing HbA, the proportion of major homozygous sites among 43 biallelic markers for each individual was calculated for 3 individuals with HbE/HbE and 38 individuals with HbA/HbA. The mean proportion of major homozygous sites was 0.82 (_SE_=0.06) in the group with HbE/HbE and 0.46 (_SE_=0.02) in the group with HbA/HbA. The proportion of major homozygous sites for the individuals with HbE/HbE was significantly larger than that for individuals with HbA/HbA (P<.001 by permutation test), although the number of individuals with HbE/HbE who were examined is small. It is interesting that all the individuals with HbE/HbE were homozygous at all of the markers in region I, whereas there was no such individual in the group with HbA/HbA. These results are consistent with the hypothesis of the recent origin of the HbE variant.
Discussion
The extended LD and reduced haplotype diversity of HbE were observed in a Thai population. Although the average length of LD in the Thai population has yet to be examined, classical genetic markers suggest that the Thai population is not strongly divergent from other populations in Southeast Asia. Because strong LD is hardly observed for SNPs more distant than ∼80 kb in Asians, as well as African Americans and European Americans (Clark et al. 2003), the range of LD of HbE (∼100 kb) would be larger than the average range of strong LD expected in an Asian population.
Although there is evidence for multiple origins of HbE in Southeast Asia (Antonarakis et al. 1982; Fucharoen et al. 1990), the present results provide strong evidence of a single origin of the HbE variant in our reference Thai population. Our simulation analysis showed that the 95% credibility interval of estimated age of the HbE variant was between 1,240 and 4,440 years. Without positive selection against malarial infection, the HbE variant never would have been spread so rapidly in this population. It is interesting to note that the present estimated age of HbE mutation coincides with the estimated period (<6,000 years ago) in which P. falciparum spread from its African tropical origins to other tropical and subtropical regions in the world (Rich et al. 1998). Thus, the estimated age of HbE is also supported by the recent origin hypothesis of P. falciparum populations.
It is interesting that the dominant- and overdominant-selection models gave similar results, as shown in table 2. This is because the increasing rate of h with small population frequency under dominant selection is almost equivalent to that under overdominant selection. In a large population with constant size, the mean changes in allele frequency of h per generation are given by
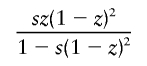
in the dominant-selection model and
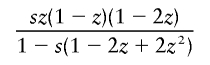
in the overdominant-selection model, where z is the population frequency of h, and they take similar values for small z. If each simulation run is terminated when the population frequency of h reaches 0.5, h would be considerably younger in the dominant-selection model than that in the overdominant-selection model.
In the computer simulation, each run was terminated when the frequency of h (HbE) reached 0.13, because the observed frequency of HbE was 0.13 in the studied population. However, only patients with malaria were investigated here. The actual population frequency might be larger than 0.13 if the HbE variant is associated with protection from infection of P. falciparum malaria. To examine how this setting influences the estimation of allele age, an additional computer simulation assuming dominant selection and _g_=0.001 was performed. The simulation run was terminated when the frequency of h reached 0.18, and the settings of the other parameter values were not changed. The mean age was 114.5 generations, which was significantly larger than 100.3 generations from the previous simulation. Although the actual population frequency does not seem to be as high as 0.18 in our study population, it should be noted that the estimated age from our computer simulation is dependent on the setting of the termination frequency of h.
There is accumulating evidence that LD in human populations is not distributed uniformly across the genome but instead shows some degree of blocklike or clustering structure (Daly et al. 2001; Goldstein 2001; Gabriel et al. 2002). Observation of single-sperm meiotic products demonstrates clearly that recombination occurs preferentially in hotspots and that these recombination hotspots may influence the pattern of LD (Jeffreys et al. 2001; Cullen et al. 2002; May et al. 2002; Kauppi et al. 2003). Although boundaries between LD blocks may occur at such recombination hotspots, block boundaries do not always correspond to strong hotspots (Phillips et al. 2003). The β-globin gene cluster has been suggested to contain a recombination hotspot on the basis of the pattern of LD (Chakravarti et al. 1984; Smith et al. 1998; Wall et al. 2003). The candidate region of the recombination hotspot from position 1663119 to position 1665044 of the NT_028310.8 (table 1) approximately coincides with that estimated on the basis of patterns of LD found in 16 unrelated individuals living in Cameroon (Wall et al. 2003). This suggests that the position of the recombination hotspot does not differ among populations. If the LD boundary has been created by other factors, such as population bottlenecks, selective sweeps, and population admixture, it is unlikely that the same LD boundaries with small length (∼2.0 kb) would be found in different populations (Omi et al. 2003; Tishkoff and Verrelli 2003). The excess of recombination events around this boundary was directly observed in single-sperm typing (Schneider et al. 2002). Also, our simulation analysis suggests a much higher recombination rate at this boundary than the genome average of ∼1 cM/Mb. Thus, there must be a recombination hotspot at the boundary spanning only 2.0 kb between regions I and II. Such a recombination hotspot is expected to erase rapidly any trace of natural selection reflected by the extended LD of the target variant. Nevertheless, the present study could detect an effect of natural selection on the pattern of LD. Recently, the HbS variant with a recent origin was reported in the Niokholo Mandenka population (Currat et al. 2002). It is therefore interesting to analyze the surrounding markers of the HbS variant to examine whether the extended LD is also detected.
Extensive LD and reduced haplotype diversity of the glucose-6-phosphate dehydrogenase (G6PD) A allele, which causes G6PD deficiency and confers resistance to malarial infection, were reported, and the G6PD A allele was estimated to have originated in the past 12,000 years (Tishkoff et al. 2001; Saunders et al. 2002). A statistical approach using long-range haplotypes also provided evidence of positive selection at G6PD and CD40 ligand genes (Sabeti et al. 2002). If patterns of LD and haplotype diversity across the human genome can be clarified, such variants will be easy to detect on the basis of the extended LD. Recombination hotspots often contribute to patterns of LD, and the degree of LD is reduced by recombination. Thus, it is generally difficult to detect extended LD caused by natural selection beyond a recombination hotspot. However, a high-resolution LD map enables us to detect at least a recent variant that has been subjected to strong positive natural selection. A denser SNP map would be useful not only for detecting disease variants (Tishkoff and Verrelli 2003; Wall and Pritchard 2003) but also for detecting the variants under natural selection.
Supplementary Material
Online-Only Tab-Delimited Data Set
Acknowledgments
We are grateful to the patients who participated in this study. We thank three anonymous reviewers for valuable comments and suggestions on a previous version of this manuscript. This study was supported by the Core University System Exchange Programme under the Japan Society for the Promotion of Science (coordinated by the University of Tokyo and Mahidol University), the National Research Council of Thailand and Mahidol University Grant, a Grant-in-Aid for Young Scientists (B) and Scientific Research on Priority Areas ([C] “Medical Science”) from the Ministry of Education, Culture, Sports, Science, and Technology of Japan, the Genetic Diversity Project (supported by the New Energy and Industrial Technology Development Organization [NEDO]), and National Institutes of Health grant D43TW00620/CFDA#93.989.
Electronic-Database Information
The accession number and URLs for data presented herein are as follows:
- Arlequin's Home on the Web, http://anthro.unige.ch/arlequin/
- Celera Discovery System, http://www.celeradiscoverysystem.com/index.cfm (for Human RefSNP)
- GenBank, http://www.ncbi.nlm.nih.gov/Genbank/ (for reference sequence information [accession number NT_028310.8])
- GOLD Home Page, http://www.sph.umich.edu/csg/abecasis/GOLD/
- JSNP, http://snp.ims.u-tokyo.ac.jp/
- Online Mendelian Inheritance of Man (OMIM), http://www.ncbi.nlm.nih.gov/Omim/ (for HBB)
References
- Abecasis GR, Cookson WO (2000) GOLD—graphical overview of linkage disequilibrium. Bioinformatics 16:182–183 10.1093/bioinformatics/16.2.182 [DOI] [PubMed] [Google Scholar]
- Antonarakis SE, Orkin SH, Kazazian HH Jr, Goff SC, Boehm CD, Waber PG, Sexton JP, Ostrer H, Fairbanks VF, Chakravarti A (1982) Evidence for multiple origins of the βE-globin gene in Southeast Asia. Proc Natl Acad Sci USA 79:6608–6611 [DOI] [PMC free article] [PubMed] [Google Scholar]
- Bunyaratvej A, Butthep P, Yuthavong Y, Fucharoen S, Khusmith S, Yoksan S, Wasi P (1986) Increased phagocytosis of _Plasmodium falciparum_-infected erythrocytes with haemoglobin E by peripheral blood monocytes. Acta Haematol 76:155–158 [DOI] [PubMed] [Google Scholar]
- Chakravarti A, Buetow KH, Antonarakis SE, Waber PG, Boehm CD, Kazazian HH (1984) Nonuniform recombination within the human β-globin gene cluster. Am J Hum Genet 36:1239–1258 [PMC free article] [PubMed] [Google Scholar]
- Chotivanich K, Udomsangpetch R, Pattanapanyasat K, Chierakul W, Simpson J, Looareesuwan S, White N (2002) Hemoglobin E: a balanced polymorphism protective against high parasitemias and thus severe P. falciparum malaria. Blood 100:1172–1176 [PubMed] [Google Scholar]
- Clark AG, Nielsen R, Signorovitch J, Matise TC, Glanowski S, Heil J, Winn-Deen ES, Holden AL, Lai E (2003) Linkage disequilibrium and inference of ancestral recombination in 538 single-nucleotide polymorphism clusters across the human genome. Am J Hum Genet 73:285–300 [DOI] [PMC free article] [PubMed] [Google Scholar]
- Cullen M, Perfetto SP, Klitz W, Nelson G, Carrington M (2002) High-resolution patterns of meiotic recombination across the human major histocompatibility complex. Am J Hum Genet 71:759–776 [DOI] [PMC free article] [PubMed] [Google Scholar]
- Currat M, Trabuchet G, Rees D, Perrin P, Harding RM, Clegg JB, Langaney A, Excoffier L (2002) Molecular analysis of the β-globin gene cluster in the Niokholo Mandenka population reveals a recent origin of the βS Senegal mutation. Am J Hum Genet 70:207–223 [DOI] [PMC free article] [PubMed] [Google Scholar]
- Daly MJ, Rioux JD, Schaffner SF, Hudson TJ, Lander ES (2001) High-resolution haplotype structure in the human genome. Nat Genet 29:229–232 10.1038/ng1001-229 [DOI] [PubMed] [Google Scholar]
- Excoffier L, Slatkin M (1995) Maximum-likelihood estimation of molecular haplotype frequencies in a diploid population. Mol Biol Evol 12:921–927 [DOI] [PubMed] [Google Scholar]
- Friedman MJ (1978) Erythrocytic mechanism of sickle cell resistance to malaria. Proc Natl Acad Sci USA 75:1994–1997 [DOI] [PMC free article] [PubMed] [Google Scholar]
- Fucharoen G, Fucharoen S, Jetsrisuparb A, Fukumaki Y (1990) Molecular basis of HbE-beta-thalassemia and the origin of HbE in northeast Thailand: identification of one novel mutation using amplified DNA from buffy coat specimens. Biochem Biophys Res Commun 170:698–704 [DOI] [PubMed] [Google Scholar]
- Fucharoen S, Winichagoon P (1987) Hemoglobinopathies in Southeast Asia. Hemoglobin 11:65–88 [DOI] [PubMed] [Google Scholar]
- Gabriel SB, Schaffner SF, Nguyen H, Moore JM, Roy J, Blumenstiel B, Higgins J, DeFelice M, Lochner A, Faggart M, Liu-Cordero SN, Rotimi C, Adeyemo A, Cooper R, Ward R, Lander ES, Daly MJ, Altshuler D (2002) The structure of haplotype blocks in the human genome. Science 296:2225–2229 10.1126/science.1069424 [DOI] [PubMed] [Google Scholar]
- Goldstein DB (2001) Islands of linkage disequilibrium. Nat Genet 29:109–111 10.1038/ng1001-109 [DOI] [PubMed] [Google Scholar]
- Haldane JBS (1949) The rate of mutation of human genes. Hereditas Suppl 35:267–273 [Google Scholar]
- Hirakawa M, Tanaka T, Hashimoto Y, Kuroda M, Takagi T, Nakamura Y (2002) JSNP: a database of common gene variations in the Japanese population. Nucleic Acids Res 30:158–162 10.1093/nar/30.1.158 [DOI] [PMC free article] [PubMed] [Google Scholar]
- Hutagalung R, Wilairatana P, Looareesuwan S, Brittenham GM, Aikawa M, Gordeuk VR (1999) Influence of hemoglobin E trait on the severity of Falciparum malaria. J Infect Dis 179:283–286 [DOI] [PubMed] [Google Scholar]
- Hutagalung R, Wilairatana P, Looareesuwan S, Brittenham GM, Gordeuk VR (2000) Influence of hemoglobin E trait on the antimalarial effect of artemisinin derivatives. J Infect Dis 181:1513–1516 [DOI] [PubMed] [Google Scholar]
- Jeffreys AJ, Kauppi L, Neumann R (2001) Intensely punctate meiotic recombination in the class II region of the major histocompatibility complex. Nat Genet 29:217–222 10.1038/ng1001-217 [DOI] [PubMed] [Google Scholar]
- Kauppi L, Sajantila A, Jeffreys AJ (2003) Recombination hotspots rather than population history dominate linkage disequilibrium in the MHC class II region. Hum Mol Genet 12:33–40 10.1093/hmg/ddg008 [DOI] [PubMed] [Google Scholar]
- Lewontin RC (1964) The interaction of selection and linkage. I. General considerations; heterotic models. Genetics 120:849–852 [DOI] [PMC free article] [PubMed] [Google Scholar]
- May CA, Shone AC, Kalaydjieva L, Sajantila A, Jeffreys AJ (2002) Crossover clustering and rapid decay of linkage disequilibrium in the Xp/Yp pseudoautosomal gene SHOX. Nat Genet 31:272–275 10.1038/ng918 [DOI] [PubMed] [Google Scholar]
- Ohashi J, Naka I, Patarapotikul J, Hananantachai H, Looareesuwan S, Tokunaga K (2002) Significant association of longer forms of CCTTT microsatellite repeat in the inducible nitric oxide synthase promoter with severe malaria in Thailand. J Infect Dis 186:578–581 [DOI] [PubMed] [Google Scholar]
- Ohashi J, Tokunaga K (2000_a_) Computer simulation analysis suggests weak balancing selection operative at the MICA locus. Hereditas 133:25–28 10.1111/j.1601-5223.2000.00025.x [DOI] [PubMed] [Google Scholar]
- ——— (2000_b_) Sojourn times and substitution rate at overdominant and linked neutral loci. Genetics 155:921–927 [DOI] [PMC free article] [PubMed] [Google Scholar]
- Omi K, Ohashi J, Patarapotikul J, Hananantachai H, Naka I, Looareesuwan S, Tokunaga K (2003) CD36 polymorphism is associated with protection from cerebral malaria. Am J Hum Genet 72:364–374 [DOI] [PMC free article] [PubMed] [Google Scholar]
- Pasvol G, Weatherall DJ, Wilson RJ (1978) Cellular mechanism for the protective effect of haemoglobin S against P. falciparum malaria. Nature 274:701–703 [DOI] [PubMed] [Google Scholar]
- Phillips MS, Lawrence R, Sachidanandam R, Morris AP, Balding DJ, Donaldson MA, Studebaker JF, et al (2003) Chromosome-wide distribution of haplotype blocks and the role of recombination hot spots. Nat Genet 33:382–387 10.1038/ng1100 [DOI] [PubMed] [Google Scholar]
- Rich SM, Licht MC, Hudson RR, Ayala FJ (1998) Malaria’s eve: evidence of a recent population bottleneck throughout the world populations of Plasmodium falciparum. Proc Natl Acad Sci USA 95:4425–4430 10.1073/pnas.95.8.4425 [DOI] [PMC free article] [PubMed] [Google Scholar]
- Sabeti PC, Reich DE, Higgins JM, Levine HZ, Richter DJ, Schaffner SF, Gabriel SB, Platko JV, Patterson NJ, McDonald GJ, Ackerman HC, Campbell SJ, Altshuler D, Cooper R, Kwiatkowski D, Ward R, Lander ES (2002) Detecting recent positive selection in the human genome from haplotype structure. Nature 419:832–837 10.1038/nature01140 [DOI] [PubMed] [Google Scholar]
- Saunders MA, Hammer MF, Nachman MW (2002) Nucleotide variability at G6pd and the signature of malarial selection in humans. Genetics 162:1849–1861 [DOI] [PMC free article] [PubMed] [Google Scholar]
- Schneider JA, Peto TE, Boone RA, Boyce AJ, Clegg JB (2002) Direct measurement of the male recombination fraction in the human β-globin hot spot. Hum Mol Genet 11:207–215 10.1093/hmg/11.3.207 [DOI] [PubMed] [Google Scholar]
- Schneider S, Roessli D, Excoffier L (2000) Arlequin version 2.000: A software for population genetic data analysis. Genetics and Biometry Laboratory, University of Geneva, Switzerland [Google Scholar]
- Smith RA, Ho PJ, Clegg JB, Kidd JR, Thein SL (1998) Recombination breakpoints in the human β-globin gene cluster. Blood 92:4415–4421 [PubMed] [Google Scholar]
- Stephens M, Smith NJ, Donnelly P (2001) A new statistical method for haplotype reconstruction from population data. Am J Hum Genet 68:978–989 [DOI] [PMC free article] [PubMed] [Google Scholar]
- Tishkoff SA, Varkonyi R, Cahinhinan N, Abbes S, Argyropoulos G, Destro-Bisol G, Drousiotou A, Dangerfield B, Lefranc G, Loiselet J, Piro A, Stoneking M, Tagarelli A, Tagarelli G, Touma EH, Williams SM, Clark AG (2001) Haplotype diversity and linkage disequilibrium at human G6PD: recent origin of alleles that confer malarial resistance. Science 293:455–462 10.1126/science.1061573 [DOI] [PubMed] [Google Scholar]
- Tishkoff SA, Verrelli BC (2003) Role of evolutionary history on haplotype block structure in the human genome: implications for disease mapping. Curr Opin Genet Dev 13:569–575 10.1016/j.gde.2003.10.010 [DOI] [PubMed] [Google Scholar]
- Vernes AJ, Haynes JD, Tang DB, Dutoit E, Diggs CL (1986) Decreased growth of Plasmodium falciparum in red cells containing haemoglobin E, a role for oxidative stress, and a sero-epidemiological correlation. Trans R Soc Trop Med Hyg 80:642–648 10.1016/0035-9203(86)90163-X [DOI] [PubMed] [Google Scholar]
- Wall JD, Frisse LA, Hudson RR, Di Rienzo A (2003) Comparative linkage-disequilibrium analysis of the β-globin hotspot in primates. Am J Hum Genet 73:1330–1340 [DOI] [PMC free article] [PubMed] [Google Scholar]
- Wall JD, Pritchard JK (2003) Assessing the performance of the haplotype block model of linkage disequilibrium. Am J Hum Genet 73:502–515 [DOI] [PMC free article] [PubMed] [Google Scholar]
Associated Data
This section collects any data citations, data availability statements, or supplementary materials included in this article.
Supplementary Materials
Online-Only Tab-Delimited Data Set