Intron presence–absence polymorphism in Drosophila driven by positive Darwinian selection (original) (raw)
Abstract
Comparisons of intron–exon structures between homologous genes in different eukaryotic species have revealed substantial variation in the number of introns. These observations imply that, in each case, an intron presence–absence polymorphism must have existed in the past. Such a polymorphism, created by a recent intron-loss mutation, is reported here in a eukaryotic organism. This gene structure, detected in the jingwei (jgw) gene, segregates at high frequency (77%) in natural populations of Drosophila teissieri and is associated with a marked change in mRNA levels. Furthermore, the intron loss does not result from a mRNA-mediated mechanism as is usually proposed, but from a partial deletion at the DNA level that also results in the addition of four new amino acids to the JGW protein. Population genetic analyses of the pattern of nucleotide variation surrounding the intron polymorphism indicate the action of positive Darwinian selection on the intron-absent variant. Forward simulations suggest that the intensity of this selection is weak to moderate, roughly equal to the selection intensity on most replacement mutations in Drosophila.
The number of spliceosomal introns is widely variable among model organisms. For instance, it ranges from 0.04 introns per gene in the yeast Saccharomyces cerevisiae to 3 in Drosophila melanogaster (1), 5 in Caenorhabdites elegans (2), and 6.8 in humans (3). This variation, detected in orthologous and paralogous members of gene families, is observed between closely as well as distantly related species, and can affect a considerable portion of the genome. For instance, genome-wide comparisons of two closely related nematodes, C. elegans and Caenorhabdites briggsae, show more than 260 introns present in one species but absent in the other, about 5% of the introns compared (4). All these examples of variable intron–exon structures in genes descended from common ancestors suggest a significant change of gene structures throughout evolutionary time (5–8). However, no intron has been reported to date in any eukaryotic organism in the intermediate state, as a polymorphism within a contemporary species (intron presence–absence polymorphism).
That introns are spliced out from gene transcripts does not imply that they cannot be subject to selection for their information or function. Some sequences can be spliced out of some transcripts but can form part of the coding region in alternatively spliced transcripts (9). Some introns play regulatory roles in transcription (10) or translation processes (11). Introns can also be involved in the maintenance of secondary structure of immature messenger RNAs (pre-mRNAs) (12–14). Moreover, the detection of a negative correlation between intron length and recombination rates both in Drosophila and in humans suggests that intron length might be under weak selective constraint, with a minimum intron size determined by strong selection (15, 16). These constraints may be associated with either transcriptional costs or the evolutionary advantage that longer introns may provide in genomic regions with reduced recombination (16, 17).
Population genetic and molecular evolution analyses and their corresponding statistical tests are usually applied to assess the relative importance of selection, mutation, and random drift in influencing the fate of different kinds of mutations. Indeed, the comparison between levels of variation observed within species (i.e., polymorphisms) and between species (i.e., fixed differences), and the study of polymorphic patterns of variation are powerful techniques to detect the action of natural selection (18–21). However, the lack of polymorphic intron-exon structures has prevented evolutionary biologists from examining in detail the evolutionary forces involved in the early stage of intron-exon structural evolution. The lack of intron presence-absence polymorphisms could thus suggest that variation of intron number may rarely be neutral. Here, we report an intron presence-absence polymorphism of the jingwei (jgw) gene in natural populations of Drosophila teissieri. This finding has allowed us to evaluate whether selection is involved in the fate of this intron gain/loss by analyzing nucleotide variation surrounding this mutation.
Materials and Methods
Drosophila Lines, DNA Isolation, and Sequencing.
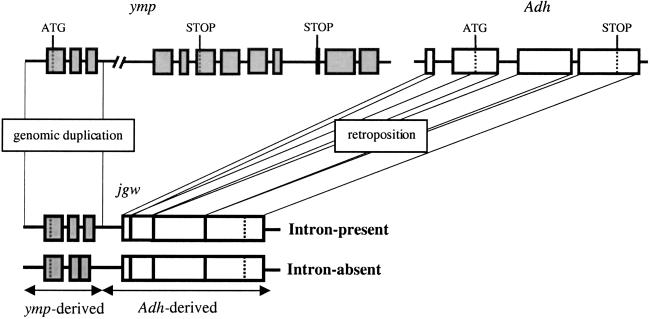
The D. teissieri isofemale lines used in this study were captured in nine different localities: three in Tanzania, three in Zimbabwe, and one each in Congo, Ivory Coast, and Guinea. The 62 Drosophila yakuba isofemale lines were captured in Ivory Coast, and kindly provided by T. C. Mackay (North Carolina State Univ., Raleigh). Genomic DNA was isolated from single fly preparations after standard procedures (22). Three overlapping fragments (see Fig. 1) encompassing the 5′ flanking, _ymp_-derived, and _Adh_-derived regions of the jgw gene were amplified by PCR and directly sequenced on both strands by using a 377 ABI PRISM automated sequencer (Applied Biosystems). In heterozygous flies, PCR products were directly sequenced and haplotypes were determined by sequencing the regions surrounding each polymorphic site in a single subcloned PCR product. An average of 2.2 kb per line were sequenced in D. teissieri. Newly reported sequences have been deposited in GenBank, EMBL, and DDBJ databases libraries under accession numbers AY102177–AY102265.
Figure 1.
Chimerical structure of jgw gene with yellow emperor (ymp)- and Alcohol dehydrogenase (Adh)-derived regions. Boxes symbolize exons and the lines between exons represent introns. Exon 2 and 3 are fused in the intron-absent copy of jingwei (jgw) in D. teissieri, because of a polymorphic genomic deletion.
Population Genetic Analyses and Computer Simulations.
Population genetic analyses were performed with the DNASP program (23) or following original references (24–26). The population recombination rate, C = 4N_e_c (where _N_e is the effective population size and c is the rate of recombination per nucleotide per generation), was estimated from the polymorphism data (27) of the 5′ flanking and _Adh_-derived regions of jgw combined (38 segregating mutations, C = 0.034/bp). The estimated C in the jgw region in D. teissieri is very similar to the average estimated for D. melanogaster (28). Because recombination estimates have large variances, we also calculated the most conservative estimate of recombination, _C_min (_C_min = 0.003/bp), compatible with the data (at 5% level) based on the observed minimum number of recombination events (_R_m) (29). The significance of the estimated statistics under neutrality was obtained by computer simulations (10,000 replicates) based on Hudson's coalescent algorithm (30) conditioning on the sample size, number of segregating mutations, and recombination. Analyses conditioned on the observed frequency of the intron-absent allele were performed by a posteriori choosing only those neutral genealogies with a derived mutation segregating at 77% ± 2.5% and by studying the subpopulation typified by those sequences sharing this mutation.
Forward simulations of a Wright–Fisher population, allowing mutation, selection, partial linkage, and drift, were performed (31–33) to estimate the effect of a single semidominant favorable mutation (e.g., the intron-loss mutation) on adjacent nucleotide variation (see refs. 17 and 33 for details). The number of simulated diploid individuals (N) was 1,000, the neutral mutation rate (μ) was μ = 0.01/N, and the recombination rate was that estimated from the 5′ flanking and _Adh_-derived regions (C and C_min, see above). One favorable mutation was added to a population under mutation-drift equilibrium. Samples of 39 sequences with a favorable mutation segregating at 77% ± 2.5% (the observed frequency of the intron-loss mutation) were randomly chosen for further analysis. The effect of favorable mutations on population parameters at adjacent sites was analyzed as a function of the scaled selection coefficient (σ; σ = 2_Ns, where N represents the number of individuals and s the favorable selection coefficient) across a range of σ from 0 to 100.
Gene Expression.
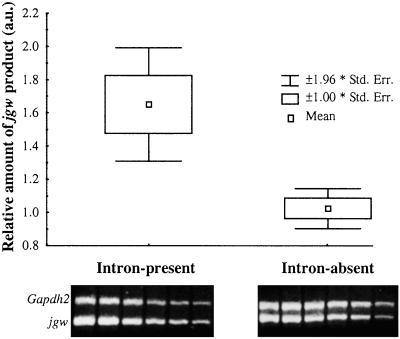
Total RNA was extracted from adult male flies (approximately 30 mg) isolated from an intron-present and an intron-absent line by using the RNeasy minikit (Qiagen, Valencia, CA). Reverse transcription (RT)-PCR reactions were performed with 25 ng of total RNA, and the obtained products, different in size from PCR products amplified from genomic DNA, were directly sequenced. Quantitative RT-PCR reactions (25 cycles) were performed with dilutions of the total RNA ranging from 100 to 1 ng, and only those dilutions whose products linearly reflected the initial amount of template were used. The Gapdh2 product was coamplified in the same reactions as jgw products, as an internal control. The relative amount of jgw products was inferred from band intensities (arbitrary units) in ethidium bromide-containing agarose gels, normalized relative to Gapdh2 band intensities. The concentration of the primers corresponding to the Gapdh2 gene was adjusted to obtain equivalent PCR amplification yields for the internal control and jgw (intron-absent line), to compensate for differences in expression levels. For each intron-present/absent line we obtained five independent measures of the relative amount of the jgw product by using two different RNA extractions. The average relative amount of jgw mRNA produced by intron-present and intron-absent lines is 1.65 and 1.02 arbitrary units, respectively.
Results and Discussion
Polymophic Intron Presence–Absence in D. teissieri.
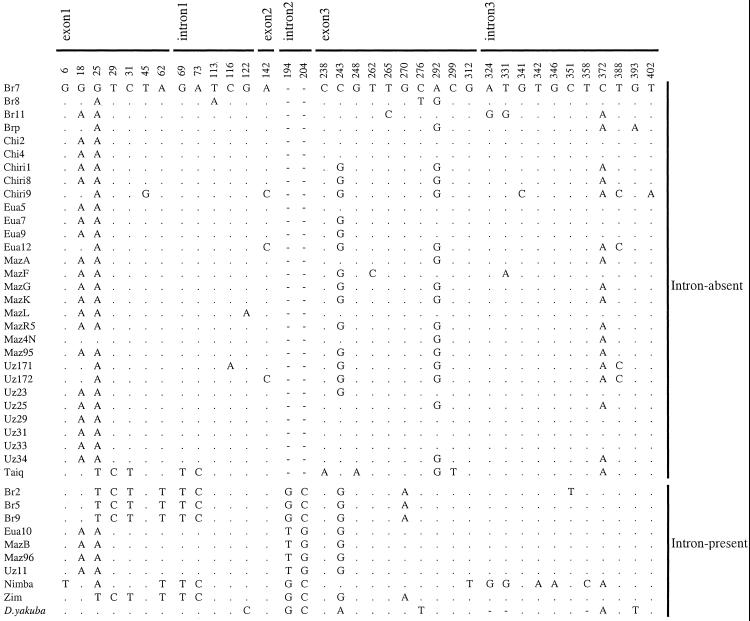
We studied the intron–exon structure of jingwei (jgw) (34), a young chimerical gene found only in the closely related species D. yakuba and D. teissieri. The first three exons of jgw originate as a partial duplication of the yellow emperor (ymp) gene (35) and form the _ymp_-derived region of jgw (see Fig. 1). The fourth exon was created by retroposition of an Alcohol dehydrogenase (Adh) mRNA and it constitutes the _Adh_-derived portion (34) (see Fig. 1). We first sequenced and analyzed the _ymp_-derived region of the jgw gene in 39 different chromosomes of a widely distributed sampling from African populations of D. teissieri (Fig. 2). Thirty (77%) of the analyzed chromosomes show a deletion of 54 bp corresponding to almost the entire second intron (66-bp-long) of jgw. The intronic nature of the 66-bp-long sequence extending between the second and third exons of jgw was confirmed by comparing the sequences corresponding to genomic DNA to the complementary copy (cDNA) of the mRNA. Genomic DNA and cDNA sequences are homosequential in the intron-absent class. The intron-absent variant is found in D. teissieri in all localities except for two localities from which only a single individual was sampled.
Figure 2.
Nucleotide polymorphisms in the _ymp_-derived region of jgw in D. teissieri. The name of each line is given in the first column. The dots indicate nucleotides that are identical to those of the first sequence, and deletions are represented as dashes. For each polymorphic site, the nucleotide variant present in D. yakuba is indicated.
The study of 62 alleles of the homologous jgw gene in D. yakuba reveals the same gene structure as the intron-present alleles of jgw in D. teissieri, with no evidence of intron presence–absence polymorphism in this species. Moreover, the parental ymp gene shares the same gene structure as the intron-present alleles of jgw in all analyzed Drosophila species: D. teissieri, D. yakuba, and the more distant D. melanogaster (36). Altogether, these results indicate that the intron presence–absence polymorphism of the D. teissieri jgw gene originated from a very recent intron-loss mutation, most likely after the split between D. teissieri and D. yakuba lineages.
Intron-Loss Mechanism.
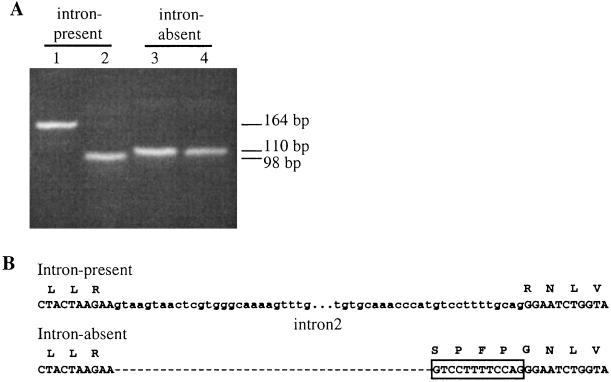
The sequence comparison of the intron-present and intron-absent alleles reveals a previously undetected mechanism for intron loss. The second exon of the intron-absent alleles is fused to the third exon by an intercalated sequence of 12 nucleotides that were originally at the 3′ end of the second intron; no nucleotide from the 5′ end of the intron was recruited (Fig. 3). Therefore, we can rule out the possibility of intron loss through a mRNA intermediate mechanism, because that would have deleted the entire second intron (37). Thus, the intron loss was most likely due to a genomic deletion, at the DNA level, that left behind a 12-bp-long intronic fragment too short to be spliced out properly by the spliceosome. Consequently, the intron-absent JGW protein has recruited four new amino acids internally compared with the intron-present JGW (Fig. 3).
Figure 3.
Genomic and RT-PCR products derived from D. teissieri jgw gene in an intron-present and an intron-absent line. (A) PCR reactions were performed from gDNA (lanes 1 and 3) and cDNA (lanes 2 and 4) with primers surrounding intron 2 in the _ymp_-derived region after a first round of amplification with a _jgw_-specific primer. The size of the products in base pairs (bp) is indicated on the right. (B) Genomic sequence of the region surrounding intron 2. Coding and intronic sequences are displayed as capital and small letters, respectively. Amino acids are presented above the second position of each codon. The nucleotide sequence corresponding to the four new amino acids acquired by exon 2 is displayed inside the open box.
Evolutionary Forces Governing the Intron-Loss Mutation.
Although most mutations detected in natural populations are expected to segregate at low frequency (38, 39), the observation that a newly arisen mutation is at high frequency is not on its own evidence for positive selection acting on this mutation. For instance, for our sample size (n = 39), newly arisen neutral mutations segregating at 77% or higher are expected in 6.25% of cases (5.93% when _C_min is used) as shown by coalescent simulations. However, population genetic theory forecasts at least four qualitative predictions associated with directional selection, which can be tested by studying neutral variation surrounding the selected site. First, the frequency distribution of variants observed in chromosomes carrying favorable mutations will be skewed toward rare variants (at lower frequencies than expected under neutrality) (40–42). Second, the frequency distribution of variants in chromosomes that do not carry favorable mutations will be skewed in the opposite direction (i.e., toward an excess of intermediate frequency mutations), because this class has undergone a reduction of the effective population size. Third, the effects on the frequency spectrum are expected to be greatest in regions adjacent to the selected mutation and to decline with genetic distance as a consequence of recombination. Fourth, the complete sample will contain an excess of variants segregating at high frequency, hitchhiked by the adaptive mutation.
We first studied nucleotide polymorphism in the _ymp_-derived region of jgw in D. teissieri. The skew in the frequency distribution of segregating mutations can be quantified by summary statistics such as Tajima's D (24) and Fu and Li's F (25). Tajima's D statistic is based on the difference between two estimators of the amount of DNA variation, the average number of nucleotide differences, and the scaled number of polymorphisms (24). Fu and Li's F statistic tests the neutral model on the basis of the difference between the average number of nucleotide differences and the number of mutations in the external branches of a genealogy. In our case, we use the sequence of D. yakuba as an outgroup to estimate F. Under neutrality, panmixia, and equilibrium, D and F should be close to 0 and values significantly different from 0 indicate departures from the neutral model.
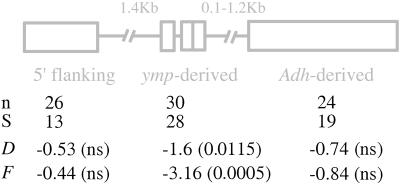
Analysis of nucleotide variation among the 30 intron-absent alleles in the _ymp_-derived region shows a skew in the frequency spectrum toward rare variants. In natural populations, however, a neutral mutation segregating at high frequency defines a subpopulation that may not conform to a standard neutral topology (30, 43). Therefore, we explored the statistical significance of the observed patterns of variation by investigating the neutral expectation of D and F statistics in a subpopulation defined by a mutation (i.e., intron-loss mutation) at high frequency (i.e., 77% ± 2.5%). Standard neutral topologies were simulated by using Hudson's coalescent algorithm (44) conditioning on the sample size, number of segregating mutations, and recombination. Only those neutral genealogies with a derived mutation segregating at 77% ± 2.5% were chosen a posteriori, and the D and F values were calculated for the subpopulation typified by the mutation. Under this most appropriate model, the observed excess of rare mutations is significant both for D (D = −1.60, P = 0.0115) and F (F = −3.16, P = 0.0005) tests even when _C_min is used (P = 0.0395 and P = 0.0088, for D and F, respectively) (Fig. 4).
Figure 4.
Neutrality tests on the intron-absent sequences. Sample size (n), number of mutations (S), estimated Tajima's D and Fu and Li's F statistics, and probabilities associated (in parentheses) are presented below a schematic representation of the three regions analyzed. ns, not significant.
The analysis of nucleotide variation among the sample of intron-present sequences shows, although not significantly, variants segregating at intermediate frequency (D = +0.28, P > 0.30; F = +0.28, P > 0.30). A more detailed study of the distribution pattern of mutations among the intron-present alleles uncovered a highly diverged sequence with an excess (P = 0.042) of singletons compared with the neutral expectation; this sequence was from the single fly sampled from Mount Nimba, Guinea. When we exclude this highly diverged sequence, likely corresponding to a genetically differentiated population, we observe a significant excess of mutations at intermediate frequency among the intron-present alleles (D = +2.03, P = 0.002; F = +1.80, P = 0.014). None of the intron-absent alleles shows a significant accumulation of singletons. The opposite behavior of mutations among the intron-present and intron-absent allele classes, and the excess of rare mutations among the intron-absent alleles indicate that this variant of jgw is expanding through the population faster than expected by random drift, suggesting selection for the intron-loss mutation. The fact that no excess of rare mutations occurs among the intron-present alleles allows us to rule out a recent demographic expansion of the species population size to explain the variation pattern among the intron-absent sequences.
These results strongly indicate that selection is affecting the region surrounding the jgw intron 2. However, these results are also compatible with natural selection acting at a closely linked genomic position. To investigate this hypothesis further, we studied polymorphism patterns in two regions adjacent to the _ymp_-derived portion: one located 5′ to the jgw gene (5′ flanking region), and the other, the _Adh_-derived region, located 3′ to intron 2 (Fig. 4). Previous studies on the _Adh_-derived region of jgw indicated a significant excess of fixed amino acid replacements between D. teissieri and D. yakuba, in agreement with a role for positive selection in the evolution of this part of the protein. Several lines of evidence are against the possibility that the observed pattern of mutations in the _ymp_-derived region is caused by selection acting on the _Adh_-derived portion of jgw. First, only 6 of 21 fixed amino acid replacements in the _Adh_-derived region appeared in the D. teissieri lineage, suggesting that after the split between D. yakuba and D. teissieri no signals of positive selection are detectable in this region in the latter lineage. To test specifically for positive selection on amino acid replacements, we used the McDonald and Kreitman test (45). This test compares the number of amino acid replacements and synonymous substitutions between and within species. When applied to the _Adh_-derived region of jgw only in the D. teissieri lineage, a nonsignificant result was obtained (G = 0.59, P = 0.44) (34). Second, variants in the _Adh_-derived portion of jgw are not in significant linkage disequilibrium with the intron loss (Fisher's exact test, P ≥ 0.128).
We have studied the distribution pattern of polymorphisms in the _Adh_-derived part of jgw in 30 lines. Similarly, we have also analyzed the 5′ flanking region of the jgw gene in 34 lines. No significant excess of rare mutations is detected among the intron-absent variants either in the _Adh_-derived region (D = −0.74, P > 0.13; F = −0.84, P > 0.16) (separated from the end of exon 3 by 0.4 kb on average) or in the 5′ flanking region (D = −0.53, P > 0.33; F = −0.44, P > 0.35) (separated from the first codon by 1.4 kb) (Fig. 4). We further investigated whether the different number of polymorphisms under study in the _Adh_-derived region and in the _ymp_-derived region of jgw might cause their observed difference in D and F values. To test this possibility, 1,000 random subsamples with 19 polymorphisms (the number of polymorphism observed in the _Adh_-derived region of jgw) were obtained from the 30 sequences of the _ymp_-derived region, and D and F values were estimated. The results show that even with 19 polymorphisms the D and F values obtained for the _ymp_-derived region (D = −1.55, F = −2.95) are very similar to those estimated from the total number of polymorphisms present in the _ymp_-derived region (Fig. 4). Thus, it is unlikely that the nonsignificant results obtained for the _Adh_-derived region are attributable to reduced power. The fact that the significant excess of mutations at low frequency is restricted to the three _ymp_-derived exons, and is detected only in the intron-absent sequences, strongly suggests that the target of natural selection is located in the _ymp_-derived region of the D. teissieri jgw gene. Overall, this result confirms that genome-wide features (e.g., population structure or demographic effects) are not determining the patterns observed in the _ymp_-derived portion.
Finally, another consequence of rapid increase in the frequency of the intron-loss mutation throughout the population would be the hitchhiking of adjacent variants that would also reach high frequency in the population. Fay and Wu have proposed a specific test (H) to detect the footprint of recent positive selection (26). Results from this test applied to the global sample of 39 sequences (intron-present and intron-absent), with the D. yakuba sequence as outgroup, indicate that a significant excess of high-frequency derived mutations exists in the _ymp_-derived region of jgw (H = 7.02, P = 0.026; P = 0.047 when the conservative _C_min is used). If we condition this same test on the presence of a particular mutation at a frequency of 77% ± 2.5%, the result remains significant (P = 0.036), but P = 0.06 for the most conservative value of recombination (_C_min). Altogether, these results suggest the action of positive Darwinian selection on the intron-absent variant (46). The presence of this unusual mutation in all populations with more than one sampled individual, in a species with possible geographical differentiation (47), is consistent with the selective scenario.
Weak Positive Selection.
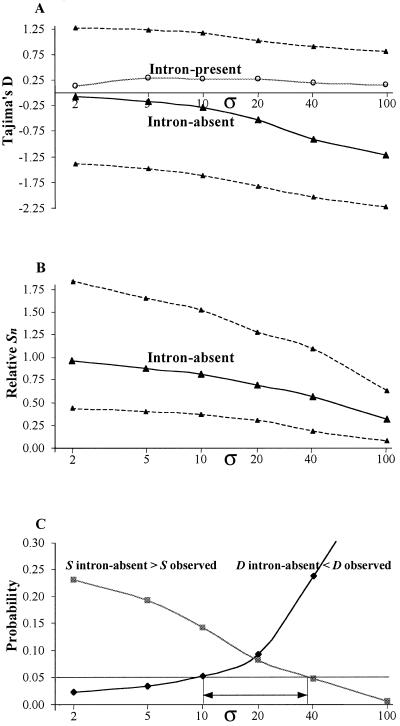
Darwinian selection has been proposed qualitatively, as the driving force in the evolution of several genes in Drosophila (34, 45, 48, 49). The fact that the intron-loss mutation is still segregating in the populations is in agreement with weak-moderate positive selection, and is consistent with the longer sojourn times associated with weakly rather than strongly selected mutations. The fate of weakly selected mutations in a population is influenced, to different degrees, by random drift. Here, we investigate the magnitude of the selection coefficient associated with the intron-loss mutation by studying the quantitative consequences of a single selected mutation on adjacent variability by forward simulations for a wide range of selection coefficients (see Materials and Methods for details). These simulations take into account all population parameters specific to our study, including the condition of observing the arisen selected mutation at 77%. Previous studies have shown that the power to detect the consequences of weak selection on adjacent sites is very low, even in the extreme case of total linkage (32, 50, 51). Our results show that, although an excess of rare mutations is expected among the alleles with the favorable mutation (favorable alleles), the remaining alleles do not show a strong skew in the opposite direction (Fig. 5A). Another interesting result is that a strong reduction in the number of segregating sites among alleles sharing the favorable mutation compared with the remaining alleles is not expected under weak/moderate selection (Fig. 5B). For instance, a 50% relative reduction among the favorable alleles is detected only when σ is larger than 50. These two results are remarkably congruent with the jgw data, where intron-absent alleles (i.e., favorable alleles) display a significant skew in the frequencies of segregating mutations toward excess of low-frequency variants, but the level of nucleotide variation, θ (52), is approximately the same among intron-absent alleles and among intron-present alleles (θ intron-absent/θ intron-present = 1.11).
Figure 5.
Population consequences of a single favorable mutation under weak/moderate selection on adjacent neutral variation. (A) Relationship between σ and the Tajima's D statistic among alleles carrying the favorable mutation (intron-absent) and the remaining alleles (intron-present). Dashed lines indicate 90% confidence intervals for Tajima's D statistic among the intron-absent alleles. (B) Relationship between σ and nucleotide variation (Sn) among intron-absent alleles relative to Sn among intron-present alleles. Sn is the number of segregating sites corrected for the sample size. Dashed lines indicate 90% confidence intervals. (C) Relationship between σ on the selected mutation and the probability of observing a pattern [Tajima's D and number of segregating sites (S)] equal or more extreme than that observed in the data for intron-absent alleles. All analyses are conditional on the observation of a favorable mutation segregating at 77% ± 2.5% in a sample of 39 sequences. The horizontal arrow indicates the interval of σ compatible with the polymorphism data among intron-absent alleles (see text for details).
We can take advantage of two consequences of positive selection on adjacent polymorphism to bound the scaled selection coefficient associated with the intron-loss mutation (Fig. 5C). Simulation results suggest that the minimum σ compatible at the 5% level with the observed frequency spectrum of adjacent mutations (e.g., Tajima's D in intron-absent sequences) is 10. On the other hand, the observed relative level of polymorphism in the intron-absent alleles suggests a maximum value of σ ≈ 40. This study reveals that the intensity of selection on the mutation studied (10 < σ < 40) is roughly equal to the intensity estimated for replacement mutations in Drosophila (Fig. 5C) (18).
On the basis of our simulations, the mean age of the intron-loss mutation is 1.3 _N_e generations or younger. By using a molecular clock approach, with noncoding/synonymous variation per base pair for our combined flanking regions (5′ flanking and _Adh_-derived) θ = 0.018, and assuming 10 generations per year and a mutation rate of 3 × 10⁻⁹ substitutions per base pair and generation estimated from Drosophila divergence data (28), the intron-loss mutation is estimated to be 0.2 million years old or younger. This time is shorter than the 2.2 _N_e generations expected under neutrality (first arrival time) (53).
Gene Expression.
How might natural selection act on the intron-absent variant of jgw? Four new amino acids were acquired by the JGW protein of the intron-absent alleles, possibly affecting the activity or structural stability of this new protein. Selection might alternatively act by targeting the stability of the jgw pre-mRNA molecules. Previous investigations indicated that some intronic sequences play a regulatory role in the transcription process (see refs. 54 and 55). It is then possible that the deletion of the jgw intron removed one of these regulatory signals, causing a change in the levels of jgw mRNA. We have studied this last possibility and detected significantly less (Mann–Whitney test, P = 0.008; see Materials and Methods and Fig. 6) jgw mRNA produced by the intron-absent line than by the intron-present line, suggesting a down-regulation effect of the intron-loss mutation. Although this association between the intron deletion with a halved mRNA level is consistent with positive selection, as revealed by the population genetic analysis, further studies of protein activity are needed to obtain a more complete picture.
Figure 6.
Expression of the intron-present and intron-absent alleles of jgw in D. teissieri. The relative amount of jgw product (arbitrary units in the y axis) obtained in the quantitative RT-PCR reactions was normalized by the amount of Gapdh2 product. Quantitative RT-PCR conditions were adjusted to obtain both templates in the linear phase. jgw and Gapdh2 products from one of the five quantitative RT-PCR replicates performed (Lower).
Acknowledgments
We thank T. Mackay for providing the D. yakuba strains and R. Hudson, C. Langley, and S. Mount for helpful discussions and suggestions. We are also grateful to E. Betran, B. Charlesworth, D. Charlesworth, J. Spofford, W. Stephan, K. Thornton, and two anonymous reviewers for useful comments on the manuscript. Thanks also to all members of the M. Long laboratory for valuable discussions. A National Science Foundation grant and a Packard Fellowship in Science and Engineering (to M.L.) supported this work.
Abbreviation
RT
reverse transcription
Footnotes
This paper was submitted directly (Track II) to the PNAS office.
References
- 1.Adams M D, Celniker S E, Holt R A, Evans C A, Gocayne J D, Amanatides P G, Scherer S E, Li P W, Hoskins R A, Galle R F, et al. Science. 2000;287:2185–2195. doi: 10.1126/science.287.5461.2185. [DOI] [PubMed] [Google Scholar]
- 2.The C. elegans Sequencing Consortium. Science. 1998;282:2012–2018. doi: 10.1126/science.282.5396.2012. [DOI] [PubMed] [Google Scholar]
- 3.Venter J C, Adams M D, Myers E W, Li P W, Mural R J, Sutton G G, Smith H O, Yandell M, Evans C A, Holt R A, et al. Science. 2001;291:1304–1354. [Google Scholar]
- 4.Kent W J, Zahler A M. Genome Res. 2000;10:1115–1125. doi: 10.1101/gr.10.8.1115. [DOI] [PubMed] [Google Scholar]
- 5.Kirchgessner T G, Chuat J C, Heinzmann C, Etienne J, Guilhot S, Svenson K, Ameis D, Pilon C, d'Auriol L, Andalibi A, et al. Proc Natl Acad Sci USA. 1989;86:9647–9651. doi: 10.1073/pnas.86.24.9647. [DOI] [PMC free article] [PubMed] [Google Scholar]
- 6.Gilbert W, de Souza S J, Long M. Proc Natl Acad Sci USA. 1997;94:7698–7703. doi: 10.1073/pnas.94.15.7698. [DOI] [PMC free article] [PubMed] [Google Scholar]
- 7.Logsdon J M., Jr Curr Opin Genet Dev. 1998;8:637–648. doi: 10.1016/s0959-437x(98)80031-2. [DOI] [PubMed] [Google Scholar]
- 8.Charlesworth D, Liu F-L, Zhang L. Mol Biol Evol. 1998;15:552–559. doi: 10.1093/oxfordjournals.molbev.a025955. [DOI] [PubMed] [Google Scholar]
- 9.Cohen J B, Levinson A D. Nature (London) 1988;334:119–124. doi: 10.1038/334119a0. [DOI] [PubMed] [Google Scholar]
- 10.Cohen J B, Broz S D, Levinson A D. Cell. 1989;58:461–472. doi: 10.1016/0092-8674(89)90427-3. [DOI] [PubMed] [Google Scholar]
- 11.Chapman R E, Walter P. Curr Biol. 1997;7:850–859. doi: 10.1016/s0960-9822(06)00373-3. [DOI] [PubMed] [Google Scholar]
- 12.Schaeffer S W, Miller E L. Genetics. 1993;135:541–552. doi: 10.1093/genetics/135.2.541. [DOI] [PMC free article] [PubMed] [Google Scholar]
- 13.Stephan W, Kirby D A. Genetics. 1993;135:97–103. doi: 10.1093/genetics/135.1.97. [DOI] [PMC free article] [PubMed] [Google Scholar]
- 14.Kirby D A, Muse S V, Stephan W. Proc Natl Acad Sci USA. 1995;92:9047–9051. doi: 10.1073/pnas.92.20.9047. [DOI] [PMC free article] [PubMed] [Google Scholar]
- 15.Carvalho A B, Clark A G. Nature (London) 1999;401:344. doi: 10.1038/43827. [DOI] [PubMed] [Google Scholar]
- 16.Comeron J M, Kreitman M. Genetics. 2000;156:1175–1190. doi: 10.1093/genetics/156.3.1175. [DOI] [PMC free article] [PubMed] [Google Scholar]
- Comeron, J. M. & Kreitman, M. (2002) Genetics161, in press. [DOI] [PMC free article] [PubMed]
- 18.Sawyer S A, Hartl D L. Genetics. 1992;132:1161–1176. doi: 10.1093/genetics/132.4.1161. [DOI] [PMC free article] [PubMed] [Google Scholar]
- 19.Hudson R R. Proc Natl Acad Sci USA. 1993;90:7425–7426. doi: 10.1073/pnas.90.16.7425. [DOI] [PMC free article] [PubMed] [Google Scholar]
- 20.Akashi H, Kreitman M. Annu Rev Ecol Syst. 1995;26:403–422. [Google Scholar]
- 21.Aquadro C F. Curr Opin Genet Dev. 1997;7:835–840. doi: 10.1016/s0959-437x(97)80048-2. [DOI] [PubMed] [Google Scholar]
- 22.Ashburner M. Drosophila: A Laboratory Handbook. Plainview, NY: Cold Spring Harbor Lab. Press; 1989. [Google Scholar]
- 23.Rozas J, Rozas R. Bioinformatics. 1999;15:174–175. doi: 10.1093/bioinformatics/15.2.174. [DOI] [PubMed] [Google Scholar]
- 24.Tajima F. Genetics. 1989;123:585–595. doi: 10.1093/genetics/123.3.585. [DOI] [PMC free article] [PubMed] [Google Scholar]
- 25.Fu Y-X, Li W-H. Genetics. 1993;133:693–709. doi: 10.1093/genetics/133.3.693. [DOI] [PMC free article] [PubMed] [Google Scholar]
- 26.Fay J C, Wu C-I. Genetics. 2000;155:1405–1413. doi: 10.1093/genetics/155.3.1405. [DOI] [PMC free article] [PubMed] [Google Scholar]
- 27.Hudson R R. Genet Res. 1987;50:245–250. doi: 10.1017/s0016672300023776. [DOI] [PubMed] [Google Scholar]
- 28.Andolfatto P, Przeworski M. Genetics. 2000;156:257–268. doi: 10.1093/genetics/156.1.257. [DOI] [PMC free article] [PubMed] [Google Scholar]
- 29.Hudson R R, Kaplan N L. Genetics. 1985;111:147–164. doi: 10.1093/genetics/111.1.147. [DOI] [PMC free article] [PubMed] [Google Scholar]
- 30.Hudson R R. Oxford Surv Evol Biol. 1990;7:1–44. [Google Scholar]
- 31.Li W-H. J Mol Evol. 1987;24:337–345. doi: 10.1007/BF02134132. [DOI] [PubMed] [Google Scholar]
- 32.Golding G B. In: Progress in Population Genetics and Human Evolution. Donnelly P, Tavare S, editors. New York: Springer; 1997. pp. 271–285. [Google Scholar]
- 33.Comeron J M, Aguadé M, Kreitman M. Genetics. 1999;151:239–249. doi: 10.1093/genetics/151.1.239. [DOI] [PMC free article] [PubMed] [Google Scholar]
- 34.Long M, Langley C H. Science. 1993;260:91–95. doi: 10.1126/science.7682012. [DOI] [PubMed] [Google Scholar]
- 35.Long M, Wang W, Zhang J. Gene. 1999;238:135–141. doi: 10.1016/s0378-1119(99)00229-2. [DOI] [PubMed] [Google Scholar]
- 36.Wang W, Zhang J, Alvarez C, Llopart A, Long M. Mol Biol Evol. 2000;17:1294–1301. doi: 10.1093/oxfordjournals.molbev.a026413. [DOI] [PubMed] [Google Scholar]
- 37.Fink G R. Cell. 1987;49:5–6. doi: 10.1016/0092-8674(87)90746-x. [DOI] [PubMed] [Google Scholar]
- 38.Crow J F, Kimura M. An Introduction to Population Genetics Theory. New York: Harper and Row; 1970. pp. 367–478. [Google Scholar]
- 39.Wright S. Genetics. 1931;16:97–159. doi: 10.1093/genetics/16.2.97. [DOI] [PMC free article] [PubMed] [Google Scholar]
- 40.Maynard-Smith J, Haigh J. Genet Res Camb. 1974;23:23–35. [PubMed] [Google Scholar]
- 41.Braverman J M, Hudson R R, Kaplan N L, Langley C H, Stephan W. Genetics. 1995;140:783–96. doi: 10.1093/genetics/140.2.783. [DOI] [PMC free article] [PubMed] [Google Scholar]
- 42.Simonsen K L, Churchill G A, Aquadro C F. Genetics. 1995;141:413–429. doi: 10.1093/genetics/141.1.413. [DOI] [PMC free article] [PubMed] [Google Scholar]
- 43.Wiuf C, Donnelly P. Theor Popul Biol. 1999;56:183–201. doi: 10.1006/tpbi.1998.1411. [DOI] [PubMed] [Google Scholar]
- 44.Hudson R R. Bioinformatics. 2002;18:337–338. doi: 10.1093/bioinformatics/18.2.337. [DOI] [PubMed] [Google Scholar]
- 45.McDonald J H, Kreitman M. Nature (London) 1991;351:652–654. doi: 10.1038/351652a0. [DOI] [PubMed] [Google Scholar]
- 46.Otto S P. Trends Genet. 2000;16:526–529. doi: 10.1016/s0168-9525(00)02141-7. [DOI] [PubMed] [Google Scholar]
- 47.Cobb M, Huet M, Lachaise D, Veuille M. Mol Ecol. 2000;9:1591–1597. doi: 10.1046/j.1365-294x.2000.01064.x. [DOI] [PubMed] [Google Scholar]
- 48.Nurminsky D I, Nurminskaya M V, DeAguiar D, Hartl D L. Nature (London) 1998;396:572–575. doi: 10.1038/25126. [DOI] [PubMed] [Google Scholar]
- 49.Ting C-T, Tsaur S-C, Wu M-L, Wu C-I. Science. 1998;282:1501–1504. doi: 10.1126/science.282.5393.1501. [DOI] [PubMed] [Google Scholar]
- 50.Neuhauser C, Krone S M. Genetics. 1997;145:519–534. doi: 10.1093/genetics/145.2.519. [DOI] [PMC free article] [PubMed] [Google Scholar]
- 51.Przeworski M, Charlesworth B, Wall J D. Mol Biol Evol. 1999;16:246–252. doi: 10.1093/oxfordjournals.molbev.a026106. [DOI] [PubMed] [Google Scholar]
- 52.Watterson G A. Theor Popul Biol. 1975;7:256–276. doi: 10.1016/0040-5809(75)90020-9. [DOI] [PubMed] [Google Scholar]
- 53.Kimura M, Ohta T. Genetics. 1973;75:199–212. doi: 10.1093/genetics/75.1.199. [DOI] [PMC free article] [PubMed] [Google Scholar]
- 54.Liu X, Mertz J E. Nucleic Acids Res. 1996;9:1765–1773. doi: 10.1093/nar/24.9.1765. [DOI] [PMC free article] [PubMed] [Google Scholar]
- 55.Zhang J, Sun X, Qian Y, LaDuca J P, Maquat L E. Mol Cell Biol. 1998;9:5272–5283. doi: 10.1128/mcb.18.9.5272. [DOI] [PMC free article] [PubMed] [Google Scholar]
