Efficiency of Estimation of Haplotype Frequencies: Use of Marker Phenotypes of Unrelated Individuals versus Counting of Phase-Known Gametes (original) (raw)
To the Editor:
Tishkoff et al. (2000) compare two-locus haplotype-frequency estimates based on marker phenotypes with estimates based on counting of phase-known gametes. They conclude that marker phenotypes of unrelated individuals are adequate for estimation of the frequencies of common haplotypes but that counting of phase-known gametes is preferable when estimates of the frequency of rare haplotypes are required.
As Tishkoff et al. note, the choice between these two strategies for estimation of haplotype frequencies is of practical importance in various situations. It is therefore of interest to examine the statistical efficiency of haplotype-frequency estimation based on marker phenotypes, compared with that based on counting of phase-known gametes. We can derive this by comparing the observed information (curvature of the log-likelihood function) at the maximum-likelihood value of the haplotype frequency with the complete information (information that we would have if phase were known for all gametes in the sample). We consider a sample of unrelated individuals typed at two loci, A and B. Without loss of generality when estimating the frequency of a single haplotype, we number the allelic states that constitute the haplotype under study, as “A1” and “B1,” grouping together all other allelic states at locus A as “A2” and all other allelic states at locus B as “B2.” We use p ij for the population frequency of the haplotype, A_i_B_j_. We define the efficiency of haplotype-frequency estimation based on marker phenotypes as the ratio of the expected observed information to the expected complete information. For a two-locus haplotype, this is given by the following expression (derived in the Appendix):
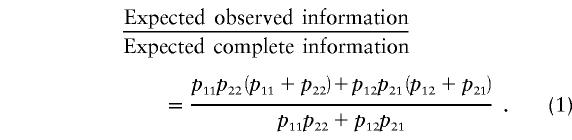
If there is no allelic association, then _p_11_p_22=_p_12_p_21, and haplotype-frequency estimation based on marker phenotypes is 50% efficient. If there is allelic association and all four haplotypes have frequency ⩾1%, then the efficiency of estimation based on marker phenotypes can be in the range 39%–98%, depending on the allele frequencies and the strength of allelic association. It remains to be determined how far these conclusions can be generalized to estimation of haplotype frequencies at three or more loci.
This relationship provides a theoretical basis for some of the empirical results reported by Tishkoff et al. (2000): when allelic association is weak or absent, as in the African populations that they studied, two-locus haplotype–frequency estimates based on marker phenotypes will have approximately twice the variance of estimates based on counting of phase-known gametes; when allelic association is strong, as in the non-African populations that they studied, determination of phase will not necessarily add much extra information about haplotype frequencies. However, Tishkoff et al.'s conclusion that haplotype-frequency estimation based on marker phenotypes performs less well for rare haplotypes than for common haplotypes should be qualified. When the frequency of the haplotype under study (A1B1) is 1%, the efficiency of haplotype-frequency estimation based on marker phenotypes can be either as low as 39% (when the frequencies of alleles A1 and B1 are both .16 and these alleles are inversely associated) or close to 100% (when haplotypes A1B2 and A2B1 predominate in the population). It is true that, even when haplotype A1B1 is absent in the sample of individuals studied, estimation based on marker phenotypes can maximize the likelihood at a nonzero value for the population haplotype frequency _p_11. However, one would not simply rely on the point estimate  to infer that the true value of _p_11 is >0.
The efficiency of haplotype-frequency estimation based on marker phenotypes has practical implications for the design of genetic-association studies in which haplotype frequencies will be compared between cases and controls. We may ask whether it is worth typing the parents or offspring of cases and controls in order to be able to assign gametic phase. From equation (1) we can infer that the information about two-locus haplotype frequencies from a sample of 100 unrelated individuals with no missing marker phenotypes will be equivalent to that obtained from a sample of 78–200 phase-known gametes, depending on the allele frequencies and allelic association in the population. To obtain a sample of 150 phase-known gametes by typing the parent-offspring pairs, it would be necessary to type >50 parent-offspring pairs, because, even when parent-offspring pairs are typed, not all haplotypes can be unambiguously inferred. Thus, for estimation of two-locus haplotype frequencies in controls, the two strategies do not differ much in terms of the information obtained for a given genotyping workload. For haplotype-frequency estimation in cases, typing a parent or offspring of each case in order to determine phase does not contribute extra gametes to the sample on the basis of which haplotype frequencies in cases are estimated, and it is therefore more economical to type a sample of unrelated cases than to type a sample of case-offspring or case-parent pairs. However, haplotype-frequency estimation based on marker phenotypes relies on the assumption that the haplotypes are in Hardy-Weinberg equilibrium. For cases, this assumption will hold only if the haplotype risk ratios fit a multiplicative model (Clayton 1999).
Appendix
Suppose that we type a sample of N individuals at two diallelic loci, A and B, where the allele frequencies are (_p_A,_q_A) and (_p_B,q_B). If we observe only the marker phenotypes, then the observed data vector consists of the number n of double heterozygotes and the counts y ij of haplotypes A_i_B_j in other marker phenotypes. The missing data vector consists of the number x of double heterozygotes whose alleles are in coupling phase. When allele frequencies are held at their maximum-likelihood values, estimation of the haplotype frequencies is equivalent to estimation of the disequilibrium coefficient D. The complete-data log-likelihood is

The score (gradient of the complete-data log-likelihood as a function of D) is

The complete information (curvature of the complete-data log-likelihood) is

For simplicity of notation, the haplotype frequencies [p A p B+D,p A q _B_-D,q A p _B_-D,q A q B+_D_] are written below as [_p_11,_p_12,_p_21,_p_22].
The variance of the score over the posterior distribution of the missing data, given the observed data, is the missing information (Little and Rubin 1987). This is equal to
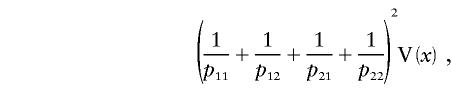
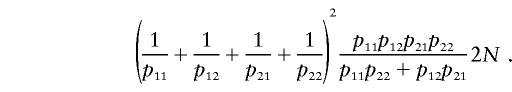
where V(x) is the variance of x over its posterior distribution, given by n(1-), where =_p_11_p_22/(_p_11_p_22+_p_12_p_21). The expectation of n is (2_p_11_p_22+2_p_12_p_21)N, and therefore the expected missing information is
The expected complete information is
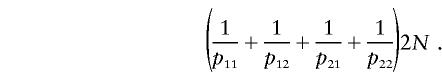
The observed information is calculated by subtracting the missing information from the complete information (Louis 1982). Dividing the expected observed information by the expected complete information yields equation (1).
References
- Clayton D (1999) A generalization of the transmission/disequilibrium test for uncertain-haplotype transmission. Am J Hum Genet 65:1170–1177 [DOI] [PMC free article] [PubMed] [Google Scholar]
- Little RJA, Rubin DB (1987) Statistical analysis with missing data. John Wiley & Sons, New York [Google Scholar]
- Louis TA (1982) Finding the observed information matrix when using the EM algorithm. J R Stat Soc Series B 44:226–232 [Google Scholar]
- Tishkoff SA, Pakstis AJ, Ruano G, Kidd KK (2000) The accuracy of statistical methods for estimation of haplotype frequencies: an example from the CD4 locus. Am J Hum Genet 67:518–522 [DOI] [PMC free article] [PubMed] [Google Scholar]