Transmission/Disequilibrium Tests for Extended Marker Haplotypes (original) (raw)
Summary
A generalization of the transmission/disequilibrium test to detect association between polymorphic markers and discrete or quantitative traits is discussed, with particular emphasis on marker haplotypes formed by several adjacent loci. Furthermore, strategies for testing haplotype association, using methods from spatial statistics, are developed. This approach compares the “similarity” of transmitted and untransmitted haplotypes, with the aim of determining the regions where there is greater similarity within the transmitted set. This arises from the fact that, although the original haplotypes carrying the mutation will be broken down by recombination, there may be a subset of markers near the mutation that are common to many of the recombinant haplotypes. Thus, by examination of each marker in turn and by measurement of the average size of the region shared identically by state in the transmitted and untransmitted haplotypes, it may be possible to detect regions of linkage disequilibrium that encompass the susceptibility gene.
Introduction
Association studies look for specific alleles at a marker locus that are more frequent in affected individuals (cases) than in the unaffected population (controls). Population-based studies compare allele frequencies in cases and controls, but this methodology has been criticized as prone to false positives due to population admixture. An alternative method is based on cases and both their parents and uses nontransmitted alleles as family-based controls (Falk and Rubinstein 1987; Terwilliger and Ott 1992; Spielman et al. 1993).
In order for association to be detectable between a marker and a disease, the marker must be sufficiently close to the susceptibility locus to be in linkage disequilibrium with it. Furthermore, the causal mutation must appear in combination with a relatively infrequent marker allele, since, otherwise, the increased risk associated with the marker allele will be modest. To maximize the chances of these conditions being met, many closely spaced markers must be used. Typically, such studies have considered each marker locus separately, making some correction for multiple testing. However, an attractive feature of the use of family data in the transmission/disequilibrium test (TDT) is that it permits study of the transmission of haplotypes that extend over several adjacent markers. Descriptive analyses have shown that such data may produce more-convincing evidence of association, by identifying ancestral marker haplotypes (Degli-Esposti et al. 1992). The present report is a preliminary attempt to put such analyses on a more formal quantitative basis.
In the next section, the parameterization of statistical models for allelic association is reviewed. Here and in the subsequent section the TDT is presented as a score test against parametric models for allelic association with qualitative and quantitative traits, respectively. It is then shown that these simple methods are no longer adequate for extended haplotypes, and an alternative approach based on score tests in a hierarchical probability model is described. Finally, a case study is presented, and its implications for further work are discussed.
Generalizations of the TDT
At a particular locus, the genotype g consists of a pair of haplotypes, (i,j). There is genetic association when, at the population level, the risk of disease depends on the genotype. If π_g_ is the disease risk conditional on genotype g_=(i,j), then the genotype relative risk (GRR) φ_g is defined by π_g_=π0φ_g_. For identifiability, an arbitrary linear constraint must be imposed on the GRRs. If there are H distinct haplotypes, then there are G_=H(H+1)/2 distinct genotypes, and, even for moderate values of H, many GRR parameters are required in order to model the association. Considerable simplification may be achieved by adopting the multiplicative model log_φ(i,j)=β_i+β_j, the parameters e_β_i being haplotype relative risks (HRR) (again, it will be convenient to take the first haplotype as reference, so that β1=0,_e_β1=1). With this model, the (i,j) heterozygote genotype carries a relative risk equal to the geometric mean of the relative risks for the homozygote genotypes. In this model, marker-disease association is represented in terms of _H_-1 parameters.
It might be argued that the multiplicative model represents a rather strong assumption. A less restrictive model, which includes the multiplicative model as a special case, is the generalized haplotype risk model:
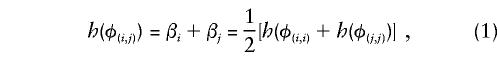
where h() is an (unspecified) monotone increasing function. In this more general model, the parameters β_i_ and β_j_ will be referred to as haplotype “effects.” As in the multiplicative case, the model predicts that φ(i,j) is intermediate between φ(i,i) and φ(j,j), but its precise placement in this range depends on which h() is chosen. The tests discussed in this report have optimal properties against this wider class of alternatives. Note that the model does not include pure dominant or pure recessive scenarios in which φ(i,j) is equal to φ(i,i) or φ(j,j). However, even if this pattern holds at the disease locus, it will not, in general, hold at a marker locus in disequilibrium with it. In simulation studies, not reported here, it has been shown that association due to linkage disequilibrium with a causal locus can, when the appropriate h() is chosen, be closely approximated by the generalized HRR (GHRR) model (eq. [1]).
The reduction of the number of parameters to _H_-1 allows the construction of tests with reasonable power for single-locus markers, even with microsatellite markers. Association may be demonstrated either by use of population-based case-control studies or by transmission/disequilibrium studies based on cases and their parents (Falk and Rubinstein 1987; Terwilliger and Ott 1992; Spielman et al. 1993; Bickeböller and Clerget-Darpoux 1995). Although there is the potential that the ideas developed here can be applied in population-based case-control studies, haplotype phase is difficult to assign in such studies, and this report will concentrate on the transmission/disequilibrium approach. In the remainder of this section, these methods are briefly reviewed and some notation is introduced.
The TDT can be derived as a score test of the hypothesis of no association against the GHRR model (eq. [1]), by use of a likelihood constructed by arguing conditionally on parental genotypes and the presence of disease in the offspring (Self et al. 1991; Schaid 1996). If the mother and father of the case have genotypes (p,q) and (r,s), respectively, then the set of possible offspring genotypes is  . The contribution of the family to the conditional likelihood for the GRR parameters is the conditional probability that the offspring has genotype c, conditional on parental genotypes and on having developed disease: φ_c_/Σ_g_∈𝒢φ_g_, so that the contribution to the log likelihood is
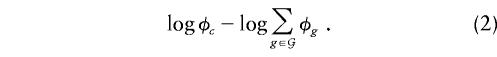
Since φ(i,j)=h_-1(β_i+β_j_), the log likelihood may be written as a function of the haplotype effects β.
The first stage of the derivation of the score test involves the calculation of the vector of the first derivatives of the log-likelihood function, evaluated at the null hypothesis. The contribution of a single parent-offspring trio to the i_th element of this vector is obtained by differentiation of formula (eq. [2]) with respect to β_i, yielding
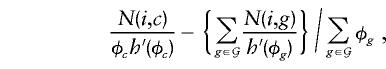
where N(i,g) counts the occurrence of haplotype i in genotype g (taking values 0, 1, or 2), and _h_′(φ) is the first derivative of the function h(φ). At the null hypothesis, φ_g_=1 for all g, and the expression simplifies to

Note that N(i,c) counts the transmissions of haplotype i to the affected offspring in this family, whereas 1/4Σ_g_∈𝒢N(i,g) counts the expected number of such transmissions under simple Mendelian inheritance. It follows that the total score vector is _U_= 1/_h_′(1)(_t_-e), where t is the vector of counts of observed transmissions of haplotypes to affected offspring, and e is the vector of expected transmissions under Mendelian inheritance.
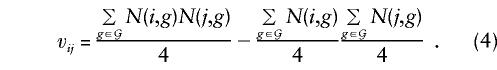
The next step in the derivation of the score test is to calculate the variance-covariance matrix of the score vector in repetitions of the study, _V_=Var(U). Standard likelihood theory (e.g., see Cox and Hinkley 1974) shows that this is given by minus the expected value of the second derivative matrix of the log likelihood, again evaluated at the null hypothesis. Some calculus shows that each parent-offspring trio makes a contribution, to Vij , of v ij/[_h_′(1)]2, where v ij is the covariance between N(i,g) and N(j,g), over the possible values for g:
A z_-test for the effect of a specific haplotype, i (i.e., a test of H:β_i_=00 ) is obtained by dividing the corresponding element of the score vector, U i,_ by its SD,  . Equivalently, (U i)2/V ii can be compared with the χ2 distribution and 1 df. Note that the constant _h_′(1) is eliminated from these statistics. This test is identical to the TDT as described by Spielman et al. (1993).
When there are several haplotypes, testing each one in turn presents a multiple-testing problem. Correction for multiple testing in these circumstances has been discussed by Morris et al. (1997), but it can be expected to be an optimal test only when only one haplotype has a increased risk. An alternative approach is to use the score test that tests the global null hypothesis that all the haplotype effects are 0. This generalizes the (U i)2/V ii test to the matrix expression

where V − denotes a generalized inverse of the matrix V. Asymptotically, the log-likelihood function approaches a quadratic function of the parameters, β, and statistic ([5]) approaches twice the difference, in log likelihood, between its value at the null hypothesis and its value after maximization with respect to all the HRR parameters. The statistic is asymptotically distributed as χ2 with df equal to the rank of _V_—usually _H_-1. Again the constant _h_′(1) cancels, and, without loss of generality, it will be assumed that _h_′(1)=1 in the subsequent discussion. This test is closely related to the Stuart-Maxwell test of marginal homogeneity (Stuart 1955; Maxwell 1970).
When H is large in comparison with the sample size, this asymptotic test will not generally be reliable, since the elements of U will be calculated from small observed and expected frequencies (Sham and Curtis 1995). However, the exact distribution of the test statistic under the null hypothesis can be evaluated by simulation. To simulate the outcome of the study under the null hypothesis and conditioning on the observed parental genotypes, each offspring genotype is chosen at random, treating all four possibilities as equally probable. Each simulation yields a vector of transmission counts, t*, and a corresponding score vector U*=(t*-e). When this simulation is repeated many times and the observed value of U T _V_-U is compared with its simulation distribution, an accurate P value may be calculated.
It should be noted that, although U has the form of a difference between observed and expected frequencies of transmitted haplotypes, test statistic ([5]) is not equal to a conventional  χ2 test statistic. However, such a test is obtained if the argument of Falk and Rubinstein (1987) is adopted and the untransmitted haplotypes are treated as an unmatched “control” sample for the “cases”—that is, the transmitted haplotypes. This test replaces V − by a diagonal matrix with elements equal to the reciprocals of the expected frequencies, e. This consistently estimates the correct value only if Hardy-Weinberg equilibrium exists in the parents, and the asymptotic distribution of the Terwilliger-Ott test statistic will be χ2 (_H_-1) only under these circumstances. This form of the test avoids a matrix inversion, and, for this reason, Bickeböller and Clerget-Darpoux (1995) advocated its use, pointing out that, when its assumptions are not met, the asymptotic χ2 approximation is conservative. However, if the exact distribution of the statistic is calculated by simulation, this inaccuracy is corrected, and, for large values of H, the simpler computation of this statistic makes it the more natural choice.
In the foregoing discussion, no real distinction has been made between the problem of a multiallelic marker at a single locus and the problem of a multilocus haplotype; both are simply polymorphic markers. In practice, however, the global statistic is much less useful in the latter case, since H is so large that the test has little power. The lack of power is a consequence of the lack of specificity in the alternative hypothesis, which simply states that the haplotype effects are different from one another. This ignores the fact that, when multilocus haplotypes are considered, it is likely that haplotypes that derive from common ancestral haplotypes may have similar risks. Below, it is shown that better tests can be devised under such circumstances and that these tests also have the form of quadratic functions of the score vector of differences between observed and expected transmissions. First, a further extension to the TDT, dealing with associations with quantitative traits, is described.
Quantitative Traits
The TDT method can also be used to detect associations between markers and quantitative traits (Allison 1997). A convenient model for association between a marker genotype, g, and a quantitative trait, z, is the normal model z_∼_N(μ_g_,σ2). Tests could be constructed on the basis of standard-normal theory, treating z as the response variable. However, this approach would not allow for designs that select study subjects from extremes of the trait distribution, and it is generally preferable to condition on offspring trait value, z, and parental genotypes and to treat transmission as the random response. In the absence of knowledge of z, the four genotypes _g_∈𝒢 are equally probable, so that the posterior probability that the genotype c is transmitted, given z, is
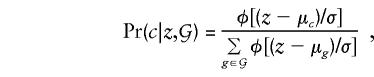
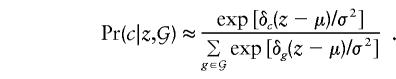
where φ[] represents the standard-normal density function and, as before, 𝒢 is the set of four possible offspring genotypes, given the parental genotypes. When the deviations of the genotype-specific means from the overall population trait mean are written as δ_g_=μ_g_-μ and δ_g_ are assumed to be small (so that terms in δ2_g_ can be ignored), this conditional probability can be approximated by
Note that, for the purpose of construction of score tests of the null hypothesis, it is the behavior of the log-likelihood function around δ_g_=0 that is of concern, so that the assumption of small δ_g_ is legitimate here.
Analogously to the GHRR model (eq. [1]), it is further assumed that, on some arbitrary scale, the genotype effects on the trait mean may be decomposed into sums of haplotype effects: h(μ(i,j))=h(μ)+β_i_+β_j_. This model predicts that h(μ(i,j))=[h(μ(i,i))+h(μ(j,j))]/2, so that the mean for heterozygotes is intermediate between the two homozygote means, its precise location depending on which h() is chosen. With this model, the contribution of each family to the _i_th element of the score vector is
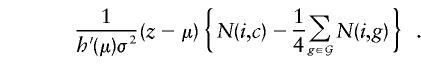
The first term is a constant that cancels in subsequent calculations, and, again with no loss of generality, it can be set to 1. When the remainder of the expression is compared with the equivalent contribution in the discrete-trait case (eq. [3]), it can be seen that the terms delimited by curly braces {} are identical, being equal to the difference between observed and expected numbers of transmissions of haplotype i to the offspring. In the quantitative-trait case, this contribution is weighted by (z_-μ). Thus, offspring with extreme values of the trait z receive more weight in the score vector, those with high values receiving positive weight and those with low values receiving negative weight. The corresponding contribution of a trio to V ij,, after the value of h_′(μ)σ2 is set to 1, is  , where v ij is given by equation (4). An asymptotic χ2 test on H_-1 df is similarly provided by U T V − U,_ but a more accurate test can be calculated by simulation. As above, simplified computation can be achieved by replacing V by its expectation under the assumption of Hardy-Weinberg equilibrium in the parents. In this case, V − is replaced by a diagonal matrix with elements
  , where n is the number of trios.
Structured Alternatives
The move from a single-marker locus to a marker haplotype involving several loci results, first, in a considerable increase in polymorphism and in a commensurate increase in the number of association parameters. However, it also brings the need to consider rather more carefully the space of alternative hypotheses, since the global test for association will usually lack power against plausible, more restricted alternatives.
The measurement of one subject in a TDT study represents assignment to one cell of a multidimensional contingency table. Thus, a natural starting point for the discussion of association structure is the log-linear model (Chiano and Clayton 1998). For disease phenotype D and marker loci A, B, and C in known order, the possible tests for association form a hierarchy:
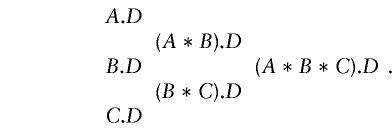
In this notation, now conventional in generalized linear modeling, the term (A*B).D expands to A.D+B.D+A.B.D , representing first-order associations between marker and disease plus the second-order association. The test against this class of alternatives is calculated as described in previous sections, by counting the transmissions of A|B haplotypes.
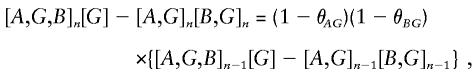
For the most part, analyses involving a series of adjacent markers have been concerned with the problem of disequilibrium mapping—estimating the location of the causal locus. Most analyses consider tests of first-order disease-marker associations (A.D, B.D, etc.), although it must be noted that the most informative marker is not necessarily the marker that is physically closest. Lazzeroni (1998) has addressed this problem by combining evidence from surrounding markers with appropriate weighting for informativeness, but that work still concentrates on first-order marker-disease association, and tests based on such association will not always be optimal. In a given population, the mutations that are causal in disease etiology will have arisen on one or more ancestral haplotypes (Degli-Esposti et al. 1992) and thereafter will have spread to other haplotypes by recombination. Early on in this process, very-high-order association will exist, and the most powerful test for association will be a very-high-order association test, since the strength of the high-order effect more than outweighs the large number of df. However, this advantage will not survive in perpetuity, since the high-order effect will be rapidly diluted by recombination. This can be demonstrated by consideration of a disease gene G lying between markers A and B, with recombination probabilities θ_AG_ and θ_BG_ in the intervals AG and BG, respectively. If joint distributions at generation n are denoted by [·,·]n and the marginal distributions of alleles at each locus are assumed to remain constant, it is easily shown that

so that the first-order association between A and disease phenotype D will be attenuated by a factor 1-θ_AG_ at each successive generation (Lange 1997). Similarly, the first-order B.D association falls away at a rate of 1-θ_BG_. Similar arguments show that higher-order associations fall away more rapidly; for example,
so that the second-order A.B.D association falls away at the rate (1-θ_AG_)(1-θ_BG_). Higher-order associations fall away at progressively more rapid rates. It follows that the best level at which to seek association will vary from one situation to another. There would seem to be no alternative to searching the hierarchy of tests, although this will lead to a multiple-testing problem.
An alternative approach may be borrowed from spatial statistics. Tests for association between some response variable and spatial location commonly suffer from the same problems that are faced here; the large number of spatial locations that must be considered leads to tests on many df, which lack power against more-specific alternatives. In that setting, the problem is addressed by making use of additional information concerning spatial contiguity of the locations. It is argued that, if the response variable tends to be high in one location, then it also will tend to be high in nearby locations. Such tests were proposed by Moran (1948) and Geary (1954). For a full discussion of such tests in spatial statistics, see the work of Cliff and Ord (1973) and Cressie (1993). In the present report, analogous statistics based on measures of haplotype similarity are proposed. The rationale is that haplotypes that have a common ancestor are likely to have more-similar relative risks than do two unrelated haplotypes, since they are more likely to carry the same allele of the susceptibility locus. In particular, all haplotypes derived from the haplotype carrying the original mutation by recombination between flanking markers will have similar or identical relative risks.
Geary-Moran tests may be derived as score tests against random-effects alternatives, if it is assumed that the haplotype effects, β, are random effects generated by a stochastic model that has the property that “similar” haplotypes tend to have similar β's. Although it is possible to conceive of population-genetic models that would have such a property, such models are complex and speculative. Instead, an empirical approach is adopted, in which β is generated by a multivariate normal “prior” distribution with variance-covariance matrix υS, where S is a known matrix expressing haplotype “similarity” and ν is a single “hyperparameter” determining the extent of association. The possible use of a model of this form for Bayesian estimation of haplotype effects has been suggested by Thomas et al. (1995). With this model, the null hypothesis is expressed as _H_0:ν=0, and a score-test statistic based on differentiation of the log likelihood with respect to ν is U T SU. Some understanding of the nature of this statistic is given by consideration of the situation in which haplotypes are classed either as similar (S _ij_=1) or dissimilar (S _ij_=0). In these circumstances, the statistic given above sums the differences U _i_=t _i_-e i over groups of similar haplotypes before squaring them.
The expectation of this statistic under the null hypothesis is Trace(VS), but higher moments depend strongly on asymptotic multivariate normality of U. Since many elements of U may be calculated from very small observed and expected transmission frequencies, this cannot usually be assumed. As before, the distribution of this statistic under the null hypothesis is best evaluated by simulation.
A natural measure of the similarity between two haplotypes is the length of the contiguous region over which they are identical by state (IBS). Since there may be more than one such region and since interest will generally focus not only on the existence of association but also on the likely location of a causal locus, it is also natural to further restrict the definition of similarity, to require IBS at one “focal” locus. This is illustrated in figure 1. With this similarity metric, there are parallels between this test for association in TDT studies and tests based on haplotype sharing by seemingly unrelated cases in the general population (te Meerman et al. 1995; de Vries et al. 1996).
Figure 1.

Calculation of similarity matrix for the haplotypes. When a specific locus is considered to be the “focus,” the similarity between any two haplotypes is taken as the length of the region shared IBS around this focus.
Although the length of the haplotype shared IBS around a focal locus is an obvious measure of haplotype similarity, any monotone function of this distance could be used in its place. For example, use of the square of the distance shared IBS will generate a test that gives more weight to longer shared haplotypes, whereas use of the square root of the length will give less weight to longer shared haplotypes. This will, in turn, make the test more or less sensitive to high-order association in the log-linear hierarchy. The choice of focal locus and of similarity metric thus provide ways of “tuning” the test that are directly analogous to searching the test hierarchy. As in that case, this introduces a multiple-testing problem. Analytical expressions for the correlations between tests with different similarity matrices can be derived and would allow an approximate correction for multiple testing, but this will not be pursued further here.
Type I Diabetes and Chromosome 18q21
As an example of the method, data from a large study of IDDM6, comprising of 10 highly polymorphic markers on chromosome 18q21, was examined (Merriman et al. 1997). In 1,160 parent-offspring trios, phase could be assigned unequivocally in 861, providing 1,712 informative transmissions. There were a total of 1,719 distinct haplotypes observed in the families. Although linkage studies implicate a causal locus in this region, its existence is not universally accepted. Nevertheless, these data serve to demonstrate some of the problems outlined and to demonstrate the methods proposed.
The P values for the hierarchy of association tests are shown in table 1. The P values are for global tests of association, equivalent to a multiple-df χ2 test, although the exact P values have been estimated by Monte Carlo methods. In single-locus (first-order association) analyses, only one marker (marker 3) achieves conventional levels of statistical significance. Nevertheless, the results are, at least informally, suggestive of association in the region: of the 55 tests shown, 18 have P<.1, 13 have P<.05, and 3 have P<.01.
Table 1.
P Values, Each Based on 5,000 Monte Carlo Simulations, for the Hierarchy of Association Tests
| P for Order of Associationa | ||||||||||
|---|---|---|---|---|---|---|---|---|---|---|
| Marker or Separation | 1 | 2 | 3 | 4 | 5 | 6 | 7 | 8 | 9 | 10 |
| 1 | .162 | |||||||||
| 50 kb | .108 | |||||||||
| 2 | .793 | .012 | ||||||||
| 40 kb | .029 | .002 | ||||||||
| 3 | .044 | .132 | .030 | |||||||
| 70 kb | .083 | .068 | .260 | |||||||
| 4 | .112 | .283 | .234 | .200 | ||||||
| 60 kb | .461 | .108 | .160 | .540 | ||||||
| 5 | .365 | .238 | .187 | .394 | .593 | |||||
| 20 kb | .016 | .423 | .579 | .416 | .667 | |||||
| 6 | .718 | .037 | .513 | .494 | .405 | |||||
| 70 kb | .341 | .160 | .478 | .392 | ||||||
| 7 | .153 | .087 | .062 | .272 | ||||||
| 45 kb | .148 | .065 | .029 | |||||||
| 8 | .150 | .005 | .023 | |||||||
| 60 kb | .033 | <.001 | ||||||||
| 9 | .899 | .033 | ||||||||
| 135 kb | .658 | |||||||||
| 10 | .475 |
The strongest findings are associations with haplotypes for markers 1–4 and with haplotypes for markers 7–10. If genuine, these results, which point to opposite ends of the region, seem puzzling. However, such findings are not necessarily contradictory; there may be a number of ancestral haplotypes with anomalous risks (both high and low), and different parts of these haplotypes may be maximally informative. As an example, consider a problem in which the ancestral mutation has occurred midway between the second and third of four markers, on the haplotype 4-8-6-3. If “normal” _x_-8-6-x haplotypes are common, then the observed associations of disease with haplotypes based on loci 1 and 2 or with haplotypes based on loci 3 and 4 could be stronger than the association with haplotypes based on loci 2 and 3, which bracket the causal locus. In effect, this is the same difficulty that arises when first-order associations are interpreted. It should also be noted that the dilution of high-order associations when the lower-order margins are examined will not usually occur symmetrically. For example, if the association is limited to a single high-risk A|B haplotype that falls on a common A allele but on a rare B allele, then, if A and B are in linkage equilibrium in the general population, the first-order association with A suffers more attenuation than does the association with B.
The results of the various Geary-Moran tests are shown in table 2. The similarity metric used is a power of the length of the IBS region measured from midway between the last shared and first unshared locus on either side of the focal marker locus. Three power transformations are investigated. Here the use of a similarity metric that gives increased weight to long haplotypes obscures the association. This may reflect the fact that the association observed is of a rather low order. For any choice of similarity metric, there is a suggestion of significant association only if “similarity” of haplotypes requires sharing IBS at locus 4.
Table 2.
Geary-Moran Tests for Association
| P Value, for Power Transformationa | |||
|---|---|---|---|
| Focal Locus | Square Root | Linear | Square |
| 1 | .742 | .595 | .512 |
| 2 | .662 | .519 | .477 |
| 3 | .017 | .044 | .246 |
| 4 | .007 | .010 | .068 |
| 5 | .248 | .136 | .139 |
| 6 | .620 | .373 | .228 |
| 7 | .208 | .169 | .128 |
| 8 | .237 | .201 | .172 |
| 9 | .739 | .511 | .258 |
| 10 | .237 | .200 | .139 |
Discussion
Testing for association with clusters of closely linked markers presents a variety of statistical problems, and the methods outlined here represent only some of the possible approaches. It is clear that there is a long way to go, but some general principles emerge. First, disease-marker associations may not be detectable as first-order associations between single markers and disease but may require consideration of extended marker haplotypes. Second, for multiple markers, the rapid increase in the number of haplotypes, H, with an increasing number of markers means that the statistical power of conventional tests will be low. It is therefore necessary to consider statistical methods that take account of between-haplotype similarities arising out of their common ancestry. Whether the Geary-Moran statistics proposed here are optimal is open to debate, but something very much like them will be necessary. Important questions remain as to both the choice of similarity metric and the relative weight given to transmitted-transmitted and untransmitted-untransmitted comparisons. Even within the class of similarity metrics proposed, the problem of multiple testing has not been directly addressed when a number of different focal loci and power transformations have been examined. This will be necessary in practice, since it seems unlikely that there would be sufficient a priori knowledge to make a guided choice. There are strong dependencies between the multiple tests, and a simple Bonferroni correction is not appropriate, but the Monte Carlo method proposed could be extended to allow for a multiple testing. It will be particularly important to allow for multiplicity in the context of whole-genome TDT screening, as discussed by Risch and Merikangas (1996). In addition to the calculation of the appropriate measure of statistical significance, it will be important to know the power of such tests. Determining the power of these statistics in such a context is extremely difficult, because of lack of knowledge of the history of the population being studied. The power will depend on a variety of factors, including the age of the mutation, the frequency of recombination, the mutation rate, the strength of linkage disequilibrium, and the density and polymorphism of the markers used in the study. Only as more information available about the history of a particular disease mutation becomes will it be possible to calculate meaningful estimates of statistical power.
A further problem arises from the fact that, because of their different allele frequencies, different markers (and haplotypes) have different informativeness. This variation in the information across the haplotype can confound attempts to locate the disease gene by high-order tests, in the same way that it does for standard first-order tests. To try and alleviate this problem, it will be necessary to address the problem of estimation of the HRRs. This would allow both the identification of high-risk ancestral haplotypes and the study of the HRR in their recombinants. This will be of particular importance for estimation of the precise location of causal mutations. The multiplicity of parameters means that maximum-likelihood estimates of the haplotype effects, β, will usually be unstable, and a more attractive possibility is to use Bayes or empirical Bayes estimates. Thomas et al. (1995) discussed the computation of such estimates, using Markov-chain Monte Carlo methods with random-effects log-linear models. They considered (a) models with first-order associations only, (b) models with exchangeable effects at the highest order of association, and (c) a combined model. They also indicated the possibility of random-effects models based on a prior “similarity” matrix, S, a model very similar to that used here to motivate the generalized Geary-Moran test statistics. This is a promising approach, but further work is necessary on the construction of appropriate “prior” models for haplotype effects.
Throughout this report, it has been assumed that the information available allows unequivocal assignment of haplotypes to study subjects. This is a fairly safe assumption if, as in the example given here, families are complete and haplotypes are based on highly polymorphic markers, so that few phase uncertainties remain. More usually, phase uncertainties and missing data present a considerable practical problem and will present increasing difficulty as the likely trend toward the use of larger numbers of less polymorphic markers takes effect. It is possible to use standard theory for likelihoods in missing-data problems (Little and Rubin 1987), to obtain extended expressions for U and V.
However, in order to apply this approach it is necessary to introduce a large number of nuisance parameters representing the haplotype frequencies in the population of parents. In such circumstances, asymptotic approximations may be poor, and no obvious simulation approach to the computation of exact tests suggests itself. The Markov-chain Monte Carlo approach to estimation of haplotype effects that was proposed by Thomas et al. (1995) could be extended to allow for phase uncertainty, but, again, the population haplotype frequencies would enter as unknown nuisance parameters. After specification of an appropriate prior distribution, these can be integrated out of the likelihood by the Monte Carlo method, but it is not clear whether the prior distribution for haplotype frequencies should take account of haplotype similarity arising out of their ancestral history.
Implementation by Computer
The method described above has been implemented in a computer program available from the corresponding author. It is written in a mixture of C and the S language for statistical computation (Becker et al. 1988). Computation is often quite laborious, since the quadratic form U T SU must be calculated for each of a large number of simulations under the null hypothesis, with the matrix S usually being large. Computation can be speeded by noting that many elements of S are zero and by storing S as a linked list of its nonzero elements.
Acknowledgments
H.J. is supported by Wellcome Trust grant 050309.
References
- Allison D (1997) Transmission-disequilibrium tests for quantitative traits. Am J Hum Genet 60:676–690 [PMC free article] [PubMed]
- Becker R, Chambers J, Wilks A (1988) The new S language: a programming environment for data analysis and graphics. Wadsworth & Brooks/Cole, Pacific Grove, CA [Google Scholar]
- Bickeböller H, Clerget-Darpoux F (1995) Statistical properties of the allelic and genotypic transmission disequilibrium test for multiallelic markers. Genet Epidemiol 12:865–870 [DOI] [PubMed]
- Chiano M, Clayton D (1998) Fine genetic mapping using haplotypes and the missing data problem. Ann Hum Genet 62:55–60 [DOI] [PubMed]
- Cliff A, Ord J (1973) Spatial autocorrelation. Pion, London [Google Scholar]
- Cox D, Hinkley D (1974) Theoretical statistics. Chapman & Hall, London [Google Scholar]
- Cressie N (1993) Statistics for spatial data. John Wiley & Sons, New York [Google Scholar]
- Degli-Esposti M, Andreas A, Christiansen F, Schalke B, Albert E (1992) An approach to the localization of the susceptibility genes for generalized myasthenia gravis by mapping recombinant ancestral haplotypes. Immunogenetics 35:355–364 [DOI] [PubMed]
- de Vries HG, van der Meulen M, Rozen R, Halley DJ, Scheffer H, ten Kate LP, Buys CH, et al (1996) Haplotype identity between individuals who share a CFTR mutation allele “identical by descent”: demonstration of the usefulness of the haplotype-sharing concept for gene mapping in real populations. Hum Genet 98:304–309 [DOI] [PubMed]
- Falk C, Rubinstein P (1987) Haplotype relative risks: an easy and reliable way to construct a proper control sample for risk calculations. Ann Hum Genet 51:227–233 [DOI] [PubMed]
- Geary R (1954) The contiguity ratio and statistical mapping. Incorporated Statistician 5:115–145 [Google Scholar]
- Lange K (1997) Mathematical and statistical methods in genetic analysis. Springer-Verlag, New York [Google Scholar]
- Lazzeroni LC (1998) Linkage disequilibrium and gene mapping: an empirical least-squares approach. Am J Hum Genet 62:159–170 [DOI] [PMC free article] [PubMed]
- Little R, Rubin D (1987) Statistical analysis with missing data. John Wiley & Sons, New York [Google Scholar]
- Maxwell A (1970) Comparing the classification of subjects by two independent judges. Br J Psychiatry 116:651–655 [DOI] [PubMed]
- Merriman T, Twells R, Merriman M, Eaves I, Cox R, Cucca F, McKinney P, et al (1997) Evidence by allelic association-dependent methods for a type 1 diabetes polygene (IDDM6) on chromosome 18q21. Hum Mol Genet 6:1003–1010 [DOI] [PubMed]
- Moran P (1948) The interpretation of statistical maps. J R Stat Soc B 10:243–251 [Google Scholar]
- Morris A, Curnow R, Whittaker J (1997) Randomization tests of disease-marker associations. Ann Hum Genet 61:49–60 [DOI] [PubMed]
- Risch N, Merikangas K (1996) The future of genetic studies of complex human diseases. Science 273:1516–1517 [DOI] [PubMed]
- Schaid DJ (1996) General score tests for associations of genetic markers with disease using cases and their parents. Genet Epidemiol 13:423–449 [DOI] [PubMed]
- Self S, Longton G, Kopecky K, Liang K (1991) On estimating HLA-disease association with application to a study of aplastic anemia. Biometrics 47:53–61 [PubMed]
- Sham P, Curtis D (1995) Monte Carlo tests for associations between disease and alleles at highly polymorphic loci. Ann Hum Genet 59:97–105 [DOI] [PubMed]
- Spielman RS, McGinnis RE, Ewens WJ (1993) Transmission test for linkage disequilibrium: the insulin gene region and insulin-dependent diabetes mellitus. Am J Hum Genet 52:506–516 [PMC free article] [PubMed]
- Stuart A (1955) A test for the homogeneity of the marginal distributions in a two-way classification. Biometrika 32:412–415 [Google Scholar]
- te Meerman GJ, van der Meulen MA, Sandkuijl LA (1995) Perspectives of identity by descent (IBD) mapping in founder populations. Clin Exp Allergy Suppl 25:97–102 [DOI] [PubMed]
- Terwilliger J, Ott J (1992) A haplotype based `haplotype relative risk' approach to detecting allelic associations. Hum Hered 42:337–346 [DOI] [PubMed]
- Thomas D, Pitkaniemi J, Langholz B, Tuomilehto-Wolf E, Tuomilehto J, DiMe Study Group (1995) Variation in HLA-associated risks of childhood insulin-dependent diabetes. II. Haplotype effects. Genet Epidemiol 12:455–466 [DOI] [PubMed]