A New Mechanism of Model Membrane Fusion Determined from Monte Carlo Simulation (original) (raw)
Abstract
We have carried out extensive Monte Carlo simulations of the fusion of tense apposed bilayers formed by amphiphilic molecules within the framework of a coarse-grained lattice model. The fusion pathway differs from the usual stalk mechanism. Stalks do form between the apposed bilayers, but rather than expand radially to form an axial-symmetric hemifusion diaphragm of the trans leaves of both bilayers, they promote in their vicinity the nucleation of small holes in the bilayers. Two subsequent paths are observed. 1), The stalk encircles a hole in one bilayer creating a diaphragm comprised of both leaves of the other intact bilayer, which ruptures to complete the fusion pore. 2), Before the stalk can encircle a hole in one bilayer, a second hole forms in the other bilayer, and the stalk aligns and encircles them both to complete the fusion pore. Both pathways give rise to mixing between the cis and trans leaves of the bilayer and allow for transient leakage.
INTRODUCTION
Although membrane fusion is a fundamental biological process of importance in fertilization, synaptic release, intracellular traffic, and viral infection, its basic mechanism is not well understood. Much of the literature has focused on fusion proteins whose function is, inter alia, to overcome the energetic cost of bringing the bilayers to be fused to within a small distance of one another, a step which places the membranes under tension (Chen and Scheller, 2001). There is accumulating evidence, however, that the subsequent stages in the fusion pathway, the interruption of the integrity of the bilayers, and the molecular rearrangements that lead to the formation of the fusion pore itself, are essentially lipidic in nature (Lentz et al., 2000; Zimmerberg and Chernomordik, 1999). A consequence of this view is that the fusion process can be studied, both experimentally and theoretically, utilizing simple model membrane systems. Knowledge of the fusion mechanism in these simpler systems would illuminate additional roles that the proteins need to play in biological fusion.
The theoretical treatment of membrane fusion has, almost without exception, been restricted to phenomenological models which describe the bilayer, not in terms of the microscopic architecture of its components, but rather in terms of the macroscopic elastic properties of its monolayers. The common assumption is that these elastic moduli are uniform and independent of membrane deformations (Safran, 1994). Although attractive mathematically, this approach has its limitations. For instance, it is not clear whether the expansion of the membrane free energy to second order in deformations is sufficient to describe the highly curved intermediate structures that may be involved in fusion. Additional approximations must be introduced to calculate the properties of junctions of bilayers, which are not well described by simple bending deformations. The energy of these structures has proven to be particularly sensitive to the approximation used in their description (Kozlovsky and Kozlov, 2002; Kuzmin et al., 2001; Markin and Albanesi, 2002; Siegel, 1993). Importantly, application of these approaches requires one to assume a particular fusion pathway. The only pathways considered to date have been limited to variants of one hypothesis (Chernomordik et al., 1985; Kozlov and Markin, 1983; Markin and Kozlov, 1983). One starts with two bilayers in close apposition. Lipids in the facing, or cis, layers rearrange locally and bridge the aqueous gap between the bilayers. This results in the formation of an axially symmetric stalk. In most versions, the stalk then expands radially and the cis layers recede. The trans layers make contact and produce an axially symmetric hemifusion diaphragm. Nucleation of a hole in this diaphragm completes the formation of an axially symmetric fusion pore. Because of the evolution of the stalk into a hemifusion diaphragm in this model, we shall refer to it as the hemifusion mechanism. Because only variants of the hemifusion mechanism have been examined, and because the theory is phenomenological, one does not know, a priori, in what systems this pathway may be the most favored, or under what conditions. Some insight is gained by comparison with experiment which shows this hypothesized mechanism to be consistent with a wide range of experimental observations of biological lipids (Jahn and Grubmüller, 2002; Monck and Fernandez, 1996; Zimmerberg and Chernomordik, 1999). However, there is no direct evidence to confirm that this particular pathway is that taken either by biological or laboratory-prepared model membranes.
In light of the above, it would certainly be desirable to examine the fusion pathway in a system whose components are described by a microscopic model. Such examination has begun recently. A minimal model, consisting of rigid amphiphiles of one hydrophilic and two hydrophobic segments, and with no explicit solvent, was studied with Brownian dynamics simulations (Noguchi and Takasu, 2001). At the same time, a model of more complex, flexible chain molecules, widely employed in the polymer community, was used by us to study bilayers composed of amphiphilic, diblock copolymers in a hydrophilic solvent (Müller et al., 2002). Such copolymers are known, in fact, to form bilayer vesicles which can undergo fusion (Discher et al., 1999). This system was studied by means of Monte Carlo simulations. Both theoretical studies observed the formation of the initial stalk, but found that the subsequent fusion pathway was not the usual hemifusion mechanism, but involved intermediates that broke the axial symmetry. In particular, off to the side of the initial stalk, the formation of small pores in each of the fusing bilayers was clearly seen. (We shall refer to these small pores which span one bilayer only as holes, to avoid confusion with fusion pores, which span both bilayers.) It is intriguing that the two studies observed the same fusion pathway even though the architecture of the constituents of the two systems differed considerably, sharing little other than the generic property of being amphiphilic and capable of bilayer self-assembly.
The two investigations gave a first glimpse of a fusion pathway which differs from the hemifusion mechanism, but did not provide a great deal of quantitative detail. In this article we present an extensive study of the same microscopic model we employed previously, and offer sufficient quantitative evidence to substantiate our earlier observations.
Naturally we are concerned with the question of whether the fusion pathway we observe in our model system is relevant to membrane fusion in biological systems. The architecture of the components in our system obviously differs greatly from those of biological lipids, and it is not clear how one should compare the systems. We make such an attempt by calculating several dimensionless ratios which can be formed from membrane parameters and comparing those in our system with ratios characteristic of vesicles formed of block copolymers, and of liposomes. (See Table 1 below.) Ultimately we cannot be sure of the systems to which our results apply and under what conditions, save the very particular ones that we have simulated for the particular case of block copolymers. In this sense, our results must be evaluated in the same way as those from the phenomenological theories; they must be compared to experiment. We do so in the Discussion. In particular we note that our mechanism predicts that the fusion rate depends on lipid architecture and membrane tension, that there is mixing of lipids in the cis leaves before mixing of contents, and that there is also mixing of lipids between cis and trans layers. Of most interest, our mechanism predicts that transient leakage is causally linked to the process of membrane fusion.
TABLE 1.
Structural and elastic properties of bilayer membranes
| Polymersomes | Liposomes | Simulation | |
|---|---|---|---|
| _d_c | 80 Å | 30 Å (DOPE)*, 25 Å(DOPC)† | 21 units |
| f | 0.39 | 0.35 ± 0.10 | 0.34375 |
| _C_0_d_c | No data | −1.1 (DOPE)§, −0.29 (DOPC)‡ | −0.68 |
| Δ_A_/_A_0 | 0.19 | 0.05 | 0.19 |
| _κ_a/_γ_0 | 2.4 | 4.4 (DOPE)†, 2.9 (DOPC)† | 4.1 |
_κ_b/_γ_0/ |
0.044 | 0.10 (DOPE)‡, 0.12 (DOPC)§ | 0.048 |
SIMULATION DETAILS
Simulation of membrane fusion in a fully chemically realistic model would be most valuable, because it could provide information about specific structural changes on the atomic level. This would be particularly important if changes in molecular conformations entailed a qualitative spatial redistribution of hydrophilic and hydrophobic segments. Unfortunately, the simulation of atomistically faithful models can only follow the time evolution of a few hundreds of lipid molecules over a few nanoseconds even on state-of-the-art supercomputers. Given that the timescale of membrane fusion is on the order of milliseconds and involves lengths on the order of a few tens of nanometers, an atomistic simulation of the fusion process is not yet feasible and one has to resort to coarse-grained models.
Coarse-grained models of amphiphilic chain molecules have been used with great success to investigate common features of self-assembly. Such models retain only those molecular properties that are necessary for self-assembly, such as the connectivity of hydrophilic and hydrophobic portions along the amphiphilic molecule, and the mutual repulsion between these different kinds of segments, and ignore specific chemical or electrostatic interactions. The usefulness of this approach rests on the observation that chemically very different systems, such as biological lipids in aqueous environment and block copolymers in a homopolymer environment, exhibit a common phase behavior and similar structural patterns on length scales comparable or larger, than the molecular size. The self-assembly of amphiphiles into bilayer membranes itself is an example of a universal behavior, i.e., one which does not depend on fine details of the underlying architecture. It has been successfully studied by coarse-grained models (Shillcock and Lipowsky, 2002). We expect that all membranes can be caused to fuse; however, there may be several different pathways which are taken by different systems under different conditions. Our purpose here is to demonstrate one path which is taken in a system modeled microscopically.
We employ the bond fluctuation model (Carmesin and Kremer, 1988) of a polymer chain, which has been used previously to study pore nucleation in a symmetric bilayer membrane under tension (Müller and Schick, 1996). Much is known about the structure and thermodynamics of this model, and the parameters can be mapped onto the standard Gaussian chain model of a dense mixture of extended molecules. In this three-dimensional lattice model, each segment occupies a lattice cube. No two occupied cubes can share any corner, a rule that mimics hard-core repulsion interaction. Furthermore this ensures that the lattice spacing is sufficiently smaller than the width of interfaces so that the effect of the discretization of space is minimal. To ensure that the chain of segments cannot intersect itself, the segments are connected by bond lengths that cannot be too large. In particular, neighboring segments along the chain can be connected by one of 108 bond vectors of lengths 2,  ,
,  3, or
3, or  measured in units of the lattice spacing u. The angles between adjacent monomers can take on any of 87 values. The large number of bond vectors and the extended segment shape allow a rather faithful approximation of continuous space, while retaining the computational advantages of lattice models. The amphiphilic molecules consist of 11 hydrophilic segments and 21 hydrophobic segments. This asymmetry mimics the ratio of head and tail size in biologically relevant lipid molecules, and is slightly smaller than employed by us previously (Müller et al., 2002). We reduced, in this study, the asymmetry of the molecules so that a solvent-free system not only would be in a lamellar phase (L α), but would also be further than in our previous study from the boundary separating the lamellar and inverted-hexagonal (_H_II) phases. The solvent in our system is represented by chains of 32 hydrophilic segments, i.e., we conceive a hydrophilic chain as a small cluster of solvent molecules, just as in other coarse-grained modeling (Shelley et al., 2001) The mean head-to-tail distance of the amphiphiles and solvent molecules is 17 u. Like segments attract each other and unlike segments repel each other via a square well potential which comprises the nearest 54 lattice sites. Each contact changes the energy by an amount ε = 0.17689 k_B_T. This corresponds to an intermediate segregation χN ≈ 30 in terms of the Flory-Huggins parameter χ. If we increased the incompatibility much more, we would reduce the interfacial width between hydrophilic and hydrophobic segments to the order of the lattice spacing and the local structure of the lattice model would become important. If we decreased the incompatibility, we would reduce the clear segregation between hydrophilic and hydrophobic regions. Similarly if we replaced the solvent homopolymers by monomers, we would effectively reduce the incompatibility (Matsen, 1995), and again reduce the segregation between the diblock and solvent hydrophilic segments and the diblock hydrophobic segments. Were we to increase the incompatibility to restore the desired degree of segregation, we would again reduce the interfacial width of the membrane to an extent that lattice effects would become important.
Monte Carlo simulations are performed in the canonical ensemble, except for some runs described in the next section. The segment number density, i.e., the fraction of lattice cubes occupied by segments, is fixed at ρ = 1/16. The conformations are updated by local segments displacements and slithering-snake-like movements. The different moves are applied with a ratio 1:3. We count one attempted local displacement per segment and three slithering-snake-like attempts per molecule as four Monte Carlo steps (MCS). This scheme relaxes the molecular conformation rather efficiently. The latter moves do not mimic a realistic dynamics of lipid molecules and we cannot identify straightforwardly the number of Monte Carlo steps with time. The density of hydrophilic and hydrophobic segments, however, is conserved so that the molecules move diffusively. Moreover, the molecules cannot cross each other during their diffusive motion. In this sense we have a slightly more realistic time evolution on local length scales than in dissipative particle dynamics simulations (Shillcock and Lipowsky, 2002), but Monte Carlo simulations cannot include hydrodynamic flows, which might become important on large length scales. At any rate, we do not expect the time sequence to differ qualitatively from that of a simulation with more realistic dynamics on timescales much larger than a single Monte Carlo step. Most importantly, fusion is thought to be an activated process, therefore the details of the dynamics only set the absolute timescale, but the rate of fusion is dominated by free energy barriers encountered along the fusion pathway, which are independent of the actual dynamics used.
PREPARATION AND PROPERTIES OF A SINGLE BILAYER
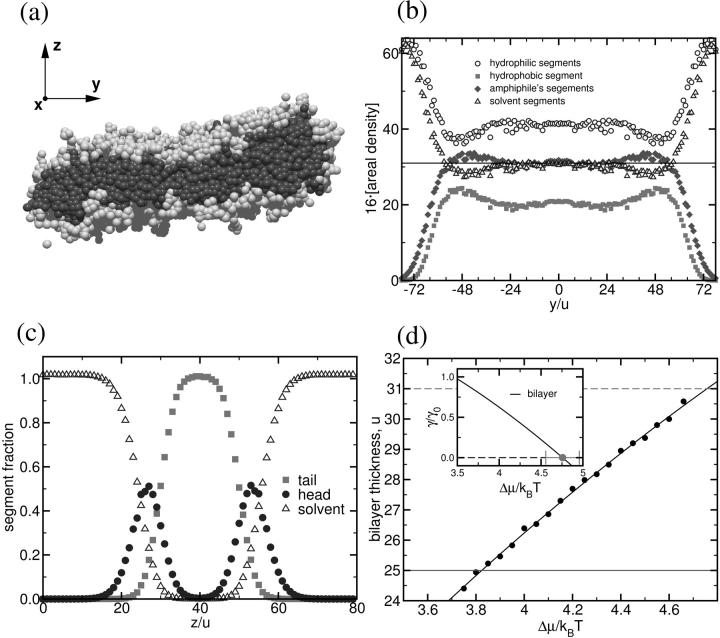
It seems clear that bilayers that are under no stress will not undergo fusion, as there is no free energy to be gained by doing so. So to promote fusion, we have subjected the studied bilayers to lateral tension. This has been done by providing the system with fewer molecules than are needed to span the given area of our sample cell with bilayers that are tensionless. Of course we need to know just how many molecules are needed to make a tensionless bilayer that spans the cell. To determine properties of the tensionless bilayer, we made use of the definition of the tension in this liquidlike bilayer as the derivative of the free energy with respect to the bilayer area at constant temperature and particle number. We therefore investigated an isolated bilayer with a straight, free edge. A simulation cell of size 64 u × 200 u × 64 u with periodic boundary conditions in all dimensions was used. The bilayer, oriented in the x_–_y plane, spanned the system in the short, x, direction, but did not span the system in the long, y, direction. Its extension in this direction adjusted itself until it neither grew nor shrank. Thus the surface tension, γ, of the bilayer was zero. This vanishing value includes, of course, the contributions from the fluctuations of the bilayer. Even though the tension vanished, these fluctuations of the mid-plane were not very large due to the stiffness of the rather small patch of membrane considered. A typical snapshot of the bilayer configuration is shown in Fig. 1 a. Rearrangement of amphiphiles at the bilayer free edges is clear. The average profile along the _y_-axis, the long axis of the bilayer, is presented in Fig. 1 b. To obtain it, we have averaged the profiles along the _x_- and _z_-direction and estimated the instantaneous angle the bilayer makes with the _z_-direction (to correct for the difference between projected and true area). We observe for these laterally averaged profiles that the edge of the bilayer is slightly thicker than the middle; the increase is ∼7% for the amphiphilic segment density, and ∼16% for the density of hydrophobic segments. Away from the edge, the densities decay exponentially to those of the uniform bilayer (i.e., without an edge), and we estimate the thickness of the tensionless bilayer from that in the middle, finding it to be _d_0 = 31 u.
FIGURE 1.
(a) Snapshot of an isolated bilayer in the tensionless state. Hydrophobic and hydrophilic segments of amphiphiles are shown as dark and light gray spheres. For clarity, solvent segments are not shown. (b) Density profiles along the y_-axis. The edge of the bilayer is thicker than its middle. (c) Profiles across the bilayer for a lateral patch of size 40 u × 40 u. (d) Dependence of the bilayer thickness on the exchange chemical potential Δ_μ between amphiphiles and solvent. The inset displays the tension γ of the bilayer as a function of exchange potential.
The profiles across a single bilayer of thickness _d_0 = 31 u are shown in Fig. 1 c. They were obtained by simulation in a cell 40 u × 40 u × 80 u in which the bilayer spanned both short directions. One sees that hydrophobic and hydrophilic regions are clearly separated, but there is some interdigitation of the hydrophobic tails emerging from the opposing monolayers.
Knowing the thickness of the tensionless bilayer, we know the number of molecules needed to span the simulation cell with such a bilayer, and can control tension by varying the number of molecules introduced into the cell. We cannot determine this tension, as one might in a molecular dynamics simulation, from the excess tangential stress in the interfacial zone because we employ a lattice model. Nevertheless, we can determine the tension purely from thermodynamic relations. To do so, we assembled a single bilayer in a system of size 156 u × 156 u × 64 u, where the bilayer spanned the system in the x_–_y plane. Using semigrand canonical identity switches between amphiphiles and solvent, we controlled the exchange potential Δ_μ_ between the species and monitored the thickness of the bilayer (measured by the areal density of amphiphiles). The dependence of the bilayer tension on the chemical potentials of the amphiphile, _μ_C, and solvent, _μ_A, is given by the Gibbs absorption isotherm (Davis, 1996):
 |
(1) |
|---|
where _δn_C and _δn_A are the excess number of molecules in the bilayer. In the last approximation we have assumed that the liquid is incompressible—i.e., _δn_A ≈ −_δn_C, and the solubility of the amphiphile in the solvent is vanishingly small. Results of the simulation for the number of amphiphiles _δn_C as a function of the exchange potential Δμ = μC − μA are shown in Fig. 1 d. Using the thickness of the tensionless bilayer, we can estimate the tension of an arbitrary bilayer as a function of exchange potential or of thickness by integrating Eq. 1. The results, in reduced units of bare A-B homopolymer interfacial tension _γ_0 = 0.068 k_B_T/_u_2, are shown in the inset of Fig. 1 d. Dashed lines in Fig. 1 d and the inset correspond to the tensionless bilayer. Comparison of the relevant structural and elastic properties of the polymersomes, liposomes, and simulated membranes is provided in Table 1.
We are now in a position to simulate bilayers under a given tension in the canonical ensemble. Knowing the area of our simulation cell, and the segment density, we add the number of amphiphiles which will produce a bilayer of a given thickness. From Fig. 1 d, we know what tension is placed on this bilayer. For our study of two bilayers under tension, we have chosen their thickness to be d = 25 u, smaller than the thickness _d_0 = 31 u of the tensionless bilayer. This corresponds to a tension of the order of γ/γ_0 ≈ 0.75 and an area expansion, Δ_A/_A_0 ≈ 0.19. We know from our simulations that a single bilayer of the thickness chosen, d = 25 u, is metastable on the timescale of fusion, i.e., the small holes, which appear transiently, do not grow past their critical size on the timescale of fusion in our simulations.
PREPARATION OF A SYSTEM OF TWO BILAYERS
We begin with a system containing only amphiphiles. It is 156 u × 156 u × 25 u with periodic boundary conditions in the long directions, and hard, impenetrable walls in the short direction. They attract the hydrophilic portion of the amphiphile and repel the hydrophobic portion. These interactions extend over two layers nearest to the wall, and each contact changes the energy by 0.6 k_B_T. The amphiphiles assemble into a bilayer structure which is free of defects.
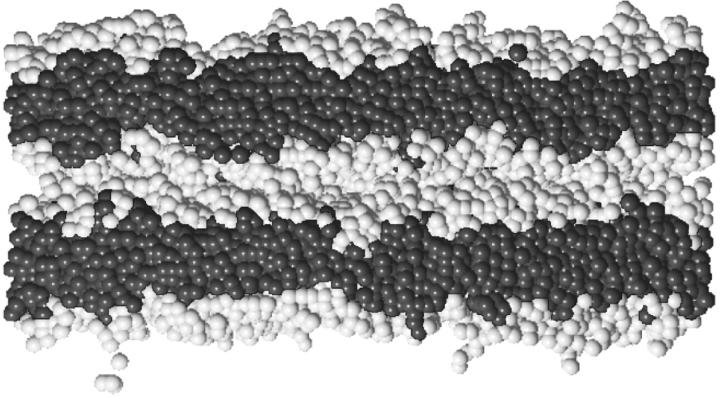
Two of these flat bilayers are then stacked on top of each other with a distance of Δ between them, and are embedded into a simulation cell with geometry 156 u × 156 u × 126 u. There are no walls at this point, and periodic boundary conditions are utilized in all three dimensions. The conditions of flat bilayers mimic the approach of two vesicles whose radii of curvature are much larger than the patch of membrane needed for fusion. The solvent of homopolymers is then inserted into the simulation cell via grand canonical, configurational-bias Monte Carlo moves at infinitely large chemical potential of the homopolymer until the segment number density of ρ = 1/16 is reached. The initial distance Δ between the bilayers translates into the thickness of the residual solvent layer between the two membranes. We have carried out the most extensive series of runs with Δ = 10 u and unless specified otherwise, all our results are for that separation. Because the solvent homopolymers are flexible coils, and each represents a cluster of solvent molecules, many layers of solvent segments are represented between the bilayers at this separation. In our previous simulations (Müller et al., 2002), we set Δ = 0 and observed qualitatively similar behavior as we do with this larger separation. We increased the separation for this extensive study because, as expected, the rate of fusion events decreased (see next section), and this allowed us to observe the sequence of structural rearrangements more clearly than in our previous work. The separation chosen, a bit less than half the thickness of one bilayer, is comparable to the separation at which fusion occurs when mediated by hemagglutinin (Flint et al., 2000). A snapshot of the two bilayers is shown in Fig. 2. Hydrophobic and hydrophilic segments of amphiphiles are shown as dark and light gray spheres. For clarity, solvent segments, which are present in the simulation, are not shown.
FIGURE 2.
Snapshot of the initial configuration in the two-bilayer system. Hydrophobic and hydrophilic segments of amphiphiles are shown as dark and light gray spheres. For clarity, solvent segments are not shown.
Thirty-two independent starting configurations were prepared, each containing 194,688 segments corresponding to ∼3613 amphiphiles and 3708 solvent molecules. After every 25,000 Monte Carlo steps, a configuration was stored for further analysis. Ten thousand hours of CPU time were utilized in the course of this investigation, with 32 processors running for about two weeks.
THE PROCESS OF FUSION
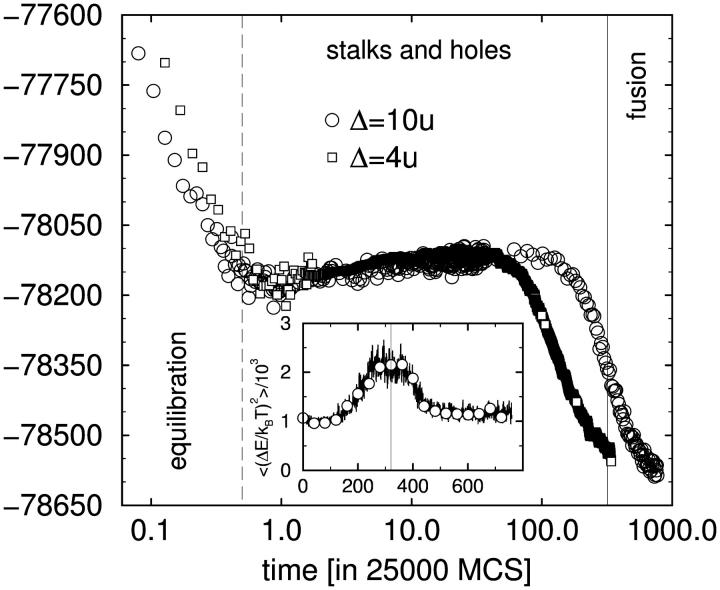
It is straightforward to monitor the internal energy of the system during the simulation because this energy arises solely from contacts between segments, and the locations of all segments are known. (In contrast, the free energy cannot be obtained directly.) We show in Fig. 3 the behavior of the internal energy of two systems, one separated by a distance Δ = 4 u (squares), and the other with Δ = 10 u (circles). The energy is plotted in units of k_B_T, as a function of time, in units of 25,000 Monte Carlo steps. The energy initially decays, which reflects the equilibration of the system. During this initial relaxation of the starting configuration the interface between the bilayer and the solvent adjusts locally. The timescale of this initial relaxation (<25,000 MCS) is independent of the distance between the bilayers, and is approximately two orders-of-magnitude smaller than the timescale on which the fusion pore forms. Due to this separation of timescales between initial relaxation and fusion we do not expect the preparation of the starting configuration to affect the fusion process. Similarly we do not expect our results to depend on our particular choice of relaxation moves, as other choices would also lead to relaxation of the bilayers which takes place on a much shorter timescale than does fusion.
FIGURE 3.
Evolution of internal energy in fusion simulations. The two curves correspond to initial bilayer separations Δ = 4 u (squares) and Δ = 10 u (circles). To reduce fluctuations, the data are averaged over all 32 configurations at equal time and additionally over small time windows. The large negative value of the energy mirrors the attractive interactions in the solvent. The inset shows the sample-to-sample energy fluctuations as a function of time. Large fluctuations identify the onset of fusion.
After the initial relaxation, two subsequent time regimes can be identified. First the energy rises slowly. Two mechanisms contribute to this increase of the energy. On the one hand, capillary waves of the hydrophilic/hydrophobic interfaces become thermally excited. They increase the effective interface area and thereby lead to a slow increase of the energy. Additionally, undulations result in the formation of stalks and holes. We shall discuss the details of this process in the next subsection. Later, ∼320 × 25,000 MCS, the energy decreases rapidly. This final decrease of the energy results from the fusion of the membranes which releases some of the tension stored in them. As noted above, the fusion occurs more rapidly the closer the bilayers, as expected. The increase in energy preceding fusion reflects the formation of fusion intermediates, the focus of our study.
The inset of Fig. 3 shows the fluctuations in the energy, i.e., the fluctuations between the 32 different runs at equal time. Strong fluctuations indicate energy differences between the independent runs. The peak at t ≈ 320 indicates that some systems have already formed a fusion pore (and therefore have a lower energy) whereas other systems have only stalks and holes (and therefore have a higher energy). The vertical bar indicates the time we have chosen to indicate on several figures as the onset of fusion. The width of the peak provides an estimate for the spread of the time at which a fusion pore appears.
The stalk and associated hole formation
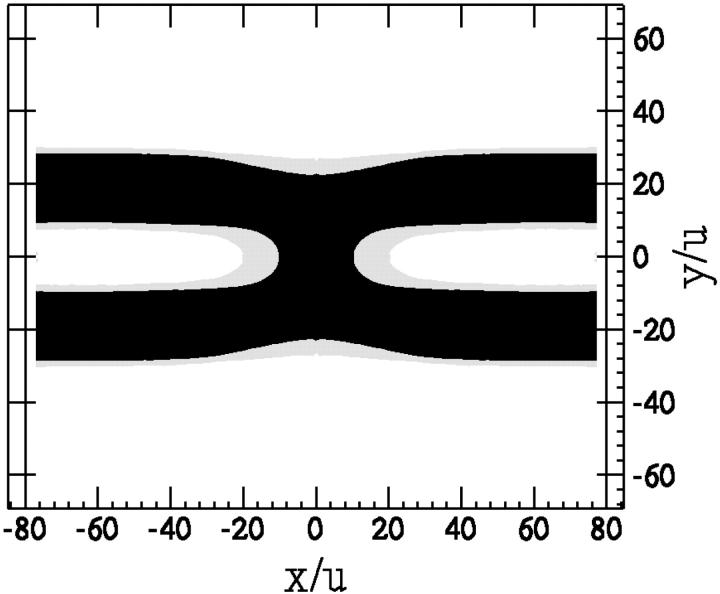
During the initial stage of simulations the fluctuating bilayers collide with one another frequently and sometimes form small local interconnections. For the most part, these contacts are fleeting. Occasionally we observe sufficient rearrangement of the amphiphiles in each bilayer to form a configuration, i.e., the stalk, which connects the two bilayers (see Fig. 4 a), and which is not as transient. Such a stalk was hypothesized long ago to be involved in the initial stages of fusion (Kozlov and Markin, 1983; Markin and Kozlov, 1983). In contrast to stable arrays of stalks which have been observed in block copolymer melts (Disko et al., 1993) and in lipid systems (Yang and Huang, 2002), those we see are isolated, and increase the free energy of the system. We infer the latter from two observations: that the appearance of stalks is correlated with the increase in the internal energy of the system as a function of time shown in Fig. 3; that some stalks vanish without proceeding further to a fusion pore. Thus it appears that the stalk represents a local minimum along the fusion pathway. Density profiles of the hydrophilic and hydrophobic parts of the amphiphiles in the presence of the stalk, and obtained by averaging over configurations, are shown in Fig. 5. The dimples in the membranes at each end of the stalk axis are notable. What can barely be seen is a slight thinning of each bilayer a short distance from the axis of the stalk.
FIGURE 4.
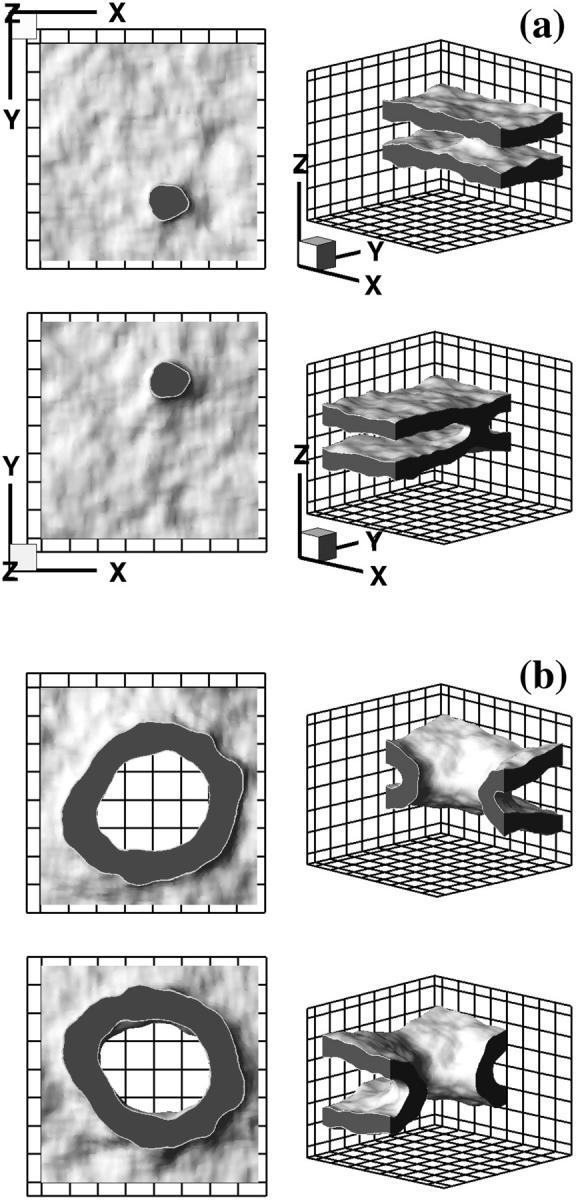
Representative snapshots. (a) Stalk intermediate. (b) Complete fusion pore from one of the simulation runs. Each configuration is shown from four different viewpoints. Hydrophobic core is shown as dark gray, the hydrophilic-hydrophobic interface (defined as a surface on which densities of hydrophilic and hydrophobic segments are equal) is light gray. For clarity, hydrophilic segments are not shown. _Top_- and bottom-left subpanels have been generated by cutting the system along the middle x_–_y plane; the top and bottom halves are viewed in the positive (up) and negative (down) _z_-direction, correspondingly. _Top_- and bottom-right subpanels are side views with cuts made by x_–_z and y_–_z planes, correspondingly. Grid spacing is 20 u. Three-dimensional orientation axis is the same for all snapshots, and shown in a.
FIGURE 5.
Density distribution of segments in the stalk, averaged over all simulation runs. At each point only the majority component is shown: solvent as white, hydrophobic and hydrophilic segments of amphiphiles as black, and gray, respectively.
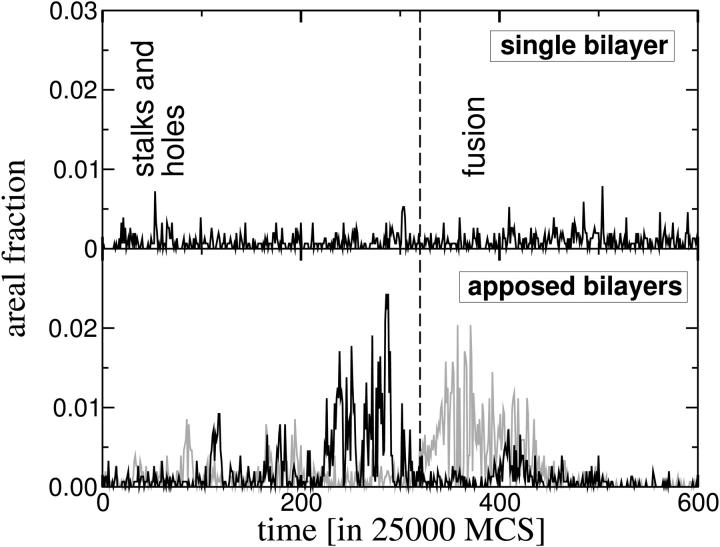
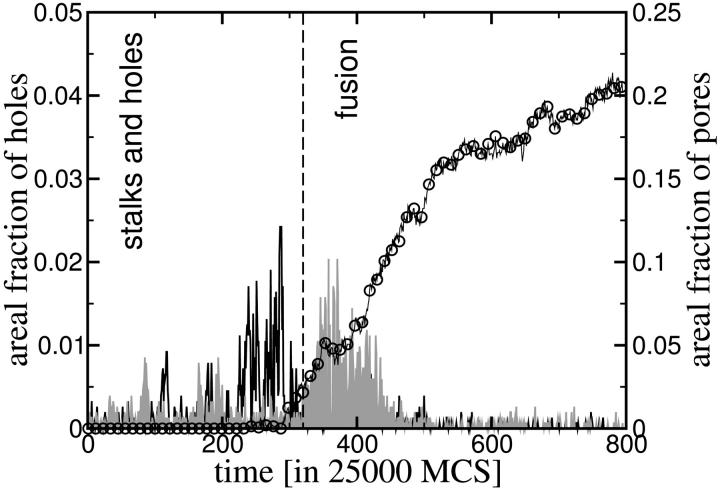
After stalks are formed, the rate of formation of holes in either of the two bilayers goes up markedly. This can be seen in Fig. 6, in which we plot the fractional area of holes as a function of time for the system of two apposed bilayers, and compare it to the rate of hole formation in an isolated bilayer. In contrast to the large increase in the area of holes formed in the apposed bilayers at time t = 200 × 25,000 MCS, the fractional area in single bilayers fluctuates somewhat about an average value which is rather constant over time at a value of ∼0.004. Comparison with Fig. 3 shows that the increase in the rate of hole production in the apposed bilayers in this system with bilayer spacing Δ = 10 u is correlated in time with the decrease in the energy of the system, and it is reasonable to infer that the decrease in energy is caused by the production of holes and, later, the fusion pore. Similarly, during the time before this increase in hole production, stalks are forming, and it is also reasonable to infer that the increase in energy is due to their formation.
FIGURE 6.
Area of holes vs. time in the system of two apposed bilayers (gray for one bilayer and black for the other on the bottom panel) and in an isolated bilayer (top panel).
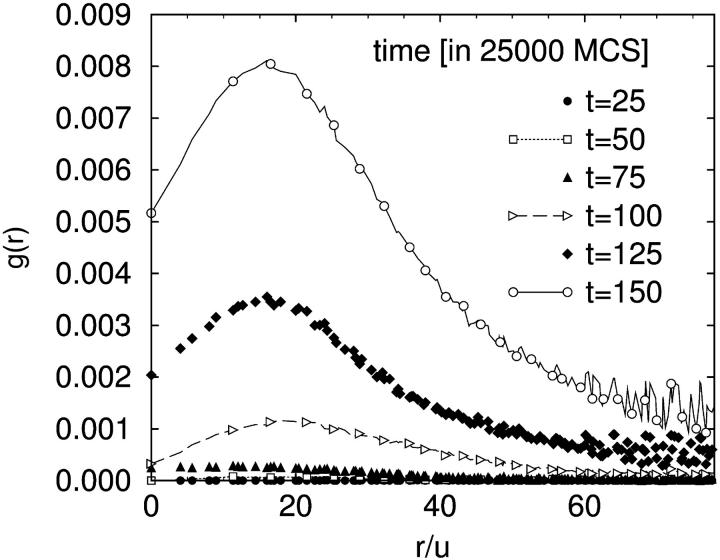
The locations of stalks and holes are correlated; holes form close to the stalks, and the stalk elongates and moves to surround the hole. A snapshot of this is shown in Fig. 7 a and d. In both snapshots an elongated stalk is seen and a small hole is formed in the upper bilayer next to the stalk. The extent to which holes are, on average, found close to a stalk can be determined from the hole-stalk correlation function
 |
(2) |
|---|
where _P_sh(rs, rh) is the joint probability that the lateral position rs is part of a stalk and rh is part of a hole, and δ(r) is the Dirac delta function. The value of g(r) at large distances r is proportional to the product of the areal fraction of holes and stalks. This correlation function is shown in Fig. 8. The scale of g(r) increases with time, indicating the simultaneous formation of stalks and holes. The figure shows that the correlation peaks at a distance of ∼16 u, and falls rapidly at larger distances. (Recall that each bilayer has an average thickness of 25 u.)
FIGURE 7.
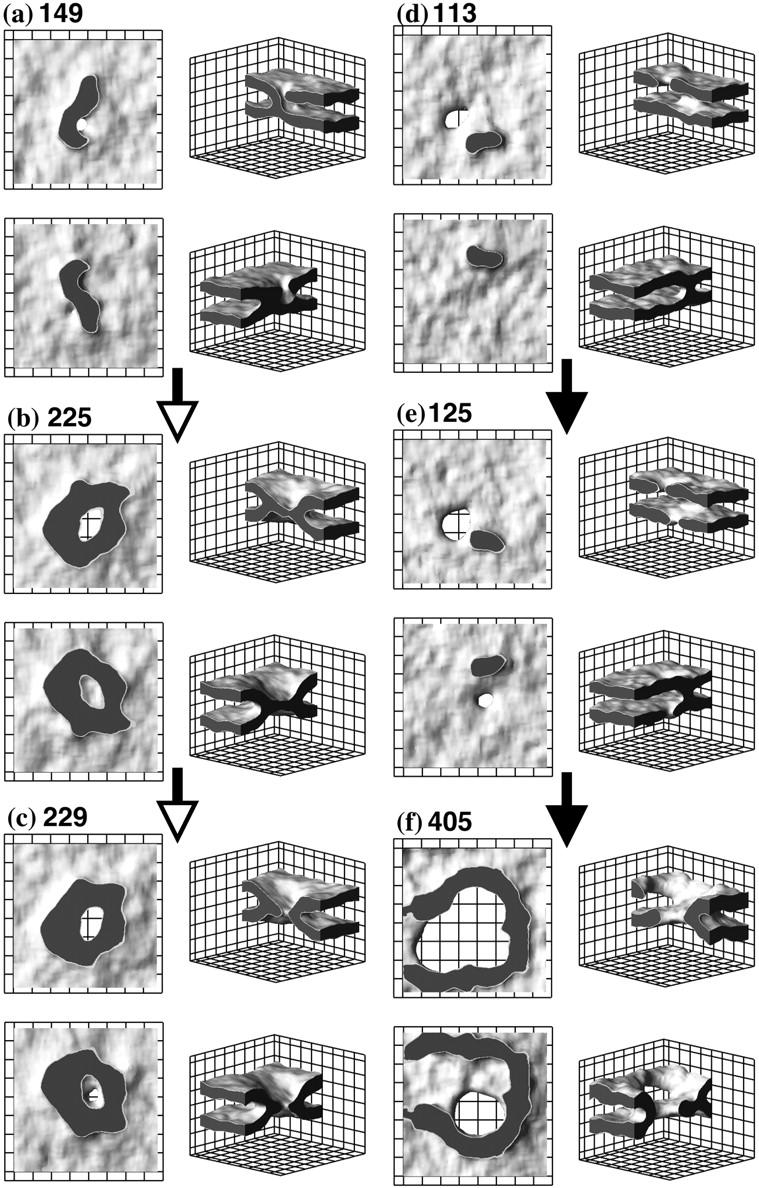
Two observed pathways of fusion process. The snapshots are taken from two representative simulation runs. Each configuration is numbered by the time (in multiples of 25,000 MCS) at which it was observed. See Fig. 4 for explanation of the graphics shown. For discussion of the mechanism see text.
FIGURE 8.
The hole-stalk correlation function at early times.
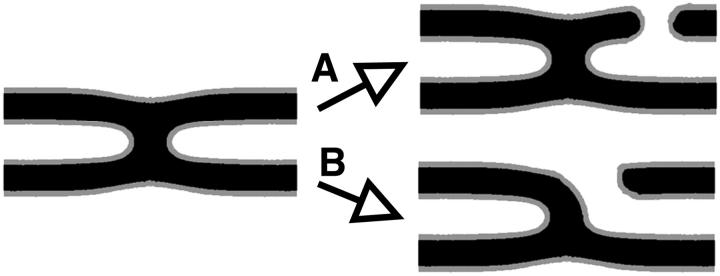
It is not difficult to understand why the presence of a stalk promotes hole formation. First, if the hole forms close to a stalk, then the line tension, or energy per unit length λ, of that part of the hole near the stalk is significantly reduced. This can be seen from the schematic in Fig. 9. In the upper part of the figure, we show a hole which has formed far from a stalk, while in the lower, we show a hole which has formed close to one. It seems clear that the line tension in the latter is reduced simply due to the reduction of curvature of the hydrophobic-hydrophilic interface. The second reason that the stalk formation encourages the appearance of holes is due to the slight thinning of the membrane in the vicinity of the stalk to which we alluded earlier. Further, it has been suggested recently that the local surface tension in the neighborhood of a defect, such as a stalk, is increased significantly (Kozlovsky et al., 2002), making such a location the likely site of hole formation.
FIGURE 9.
Schematic explanation of the line tension reduction near the stalk.
Now that one hole has formed next to the stalk, and the stalk has begun to surround it, two other events occur to complete the formation of the fusion pore. They are 1), a second hole forms in the other bilayer; and 2), the stalk surrounds the hole(s) to form the rim of the fusion pore. We have observed these steps to occur in either order, and will briefly discuss them separately.
Pathway 1: Rim formation followed by appearance of a second hole
In this scenario, a hole appears in one bilayer and the stalk completely surrounds it rather rapidly. A snapshot of the system in this configuration is shown in Fig. 7 b. This looks very much like a hemifusion diaphragm which has been suggested by many authors as an intermediate stage in fusion (Chernomordik et al., 1985; Markin and Kozlov, 1983; Siegel, 1993). However, this diaphragm is quite different from the usual hemifusion one that consists of two trans monolayers of the fusing membranes. In contrast, the diaphragm we observe is made of one of the pre-existing bilayers; that is, it is made of cis and trans leaves. The appearance of a hole in this diaphragm, as shown in Fig. 7 c, and its expansion completes the formation of the fusion pore.
Pathway 2: Appearance of second hole followed by rim formation
In this scenario, a hole appears in one bilayer and, before the stalk completely surrounds it, a second hole appears in the other bilayer. The stalk tries to surround them both, and aligns them in doing so. In Fig. 7 e we show one stage in this process. One sees a large hole in the upper bilayer. A small hole is formed in the lower bilayer next to the stalk. Eventually, the stalk aligns and completely encircles the holes (see Fig. 7 f) to form the final fusion pore shown in Fig. 4 b. Again, the driving force for the stalk to surround the two holes is the reduction in their (bare) line tension. Because the stalk aligns and surrounds two holes, we observe this pathway to be somewhat slower than that of pathway 1, in which the stalk need only surround one hole.
Once the fusion pore has formed, by either of the above mechanisms, it expands, driven by the reduction in surface tension. The growth of the fusion pore eventually slows and ends as the pore reaches its optimum size determined by the finite size of our cell.
DISCUSSION
We have carried out extensive Monte Carlo simulations on the fusion of two bilayer membranes comprised of amphiphilic molecules immersed in solvent. The amphiphiles and solvent are modeled by copolymers and homopolymers, respectively. The membranes are under tension. The mechanism of fusion that we see begins with a stalk, as posited years ago, and incorporated in almost all fusion scenarios. However, what follows after stalk formation is different from all other mechanisms which have been proposed save that presented independently by Noguchi and Takasu (2001). In particular, the fusion intermediates we see break the axial symmetry which has been assumed in almost all previous calculations. We observed that the stalk destabilizes the bilayers by catalyzing the creation of small holes in them. We argued that the mechanism behind this is quite simple: the energy per unit length of the edge of a hole is reduced when the edge is adjacent to a stalk. For the same reason, the stalk will try to surround the hole formed in one bilayer once the hole has appeared. Two slightly different pathways to the final fusion pore were observed differing only on whether the hole in the second bilayer, which is necessary for complete fusion, appears before or after the stalk completely surrounds the first hole.
The question now arises as to whether the pathway we see in the model system is that which occurs in biological fusion. There are many differences between the model studied and a biological system. Perhaps the most obvious is that we have modeled flexible, single chain block copolymers, not lipids with two semiflexible tails and a rigid head. How is one to determine whether these architectural differences are significant? It is useful to recall that phenomenological theories completely ignore the architecture of the membrane constituents and encapsulate their effects in a small number of parameters which enter the theory, such as the monolayer spontaneous curvature and bending modulus. In that same spirit, we can extract from our simulation those same parameters and compare dimensionless ratios of them to those of other systems. We have done that, and presented the results in Table 1. One sees that the values we obtain are reasonable. The ratio of the bilayer compressibility modulus to the hydrophilic/hydrophobic interface tension, _κ_a/γ_0, is closer to that of liposomes than of polymersomes. The reverse is true for the ratio of the monolayer bending modulus to the product of surface tension and the square of the hydrophobic thickness  . One line in the table deserves comment—that for the experimental values of the bilayer area expansion, Δ_A/_A_0, quoted at rupture (the critical values). That for liposomes is smaller than that for polymersomes at rupture, which is equal to the bilayer area expansion we utilized. However, the values quoted at rupture have no thermodynamic meaning, because any membrane under tension is inherently unstable and will be observed to rupture if the timescale of observation is sufficiently long. The experimental values quoted apply over some, unspecified, laboratory timescale. On this point we add that, as in experiment, we found many of our bilayers to rupture over the time we observed them, but the timescale for this to happen was significantly greater than that for fusion. If the bilayer area expansion, or equivalently, its tension were reduced, either in experiment or in our simulation, the timescales for the bilayers to fuse and later to rupture would both increase, perhaps to the extent of making impossible the observation of fusion. Indeed we chose the value of tension in the simulation such that fusion could be observed conveniently. One could still ask whether, in addition to increasing the timescale for fusion, a significant reduction in bilayer tension would favor an alternative fusion pathway. To attempt to answer this question, one could contemplate even longer Monte Carlo runs on membranes under less tension.
There are other physical parameters which might affect the fusion pathway but which are not encompassed by the quantities in Table 1. For example, one might ask whether the fusion pathway is expected to be the same for large virus-encapsulating endosomes as it is for small synaptic vesicles. Thus one would consider the dimensionless ratio of the membrane's hydrophobic thickness to the radius of the vesicle in question. We have considered the simplest case of planar membranes for which this ratio is zero. For endosomes encapsulating influenza viruses with an average diameter of 100 nm, the ratio is small—≤0.03, but for synaptic vesicles of 50-nm typical diameter, it is at least twice this. It is not difficult to imagine that for a sufficiently large value of this ratio, which implies a small area of contact between the fusing vesicles, there might be insufficient room for the growth and movement of the stalk we have observed, so that our mechanism would be supplanted by another. But we do not know this.
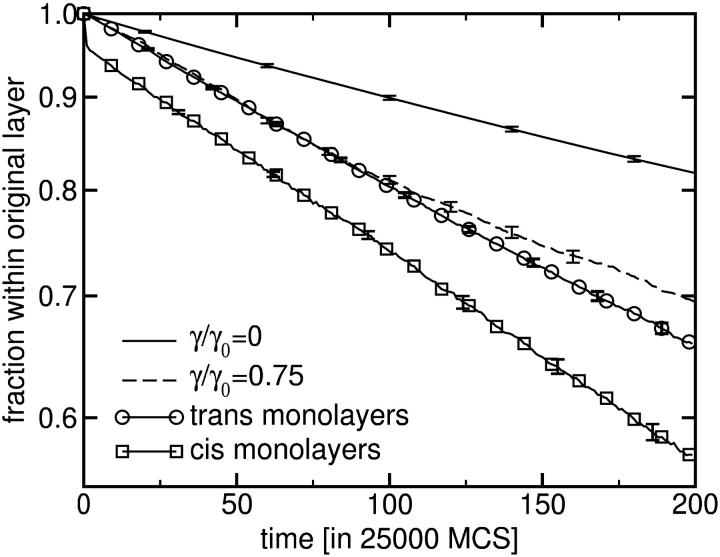
Ultimately the most meaningful test of the applicability of our mechanism to biological fusion is comparison to experiment, and our scenario does have testable consequences. First, because of the initial stalk formation, one expects to see the mixing of lipids in the two proximal layers before the fusion pore opens, if it forms at all—a result which is in accord with experiment (Evans and Lentz, 2002; Lee and Lentz, 1997; Melikyan et al., 1995). Second, due to the formation of holes in each bilayer near a stalk, our scenario allows for the mixing of those lipids in the cis and trans leaves of one bilayer and also of lipids in the cis leaf of one bilayer with those in the trans leaf of the other. The standard hemifusion mechanism does not permit either process. Note that this movement is different from lipid flip-flop which is known to be very slow. Mixing of lipids between the cis and trans monolayers has been observed in fusion (Evans and Lentz, 2002; Lentz et al., 1997), but it has not yet been determined from which membrane they originate and in which membrane they terminate. We have monitored the amphiphiles to see whether they remain in the leaf in which they were situated at the beginning of the Monte Carlo run, or mix with amphiphiles in other leaves. Instantaneous assignment of amphiphiles to a respective monolayer was determined by the center of mass of their hydrophilic part. The results are shown in Fig. 10. They share with experiment the fact that the membrane of origin is not distinguished nor is the membrane of final residence. To evaluate the results for the apposed bilayers under tension, we have also included those for the single isolated bilayer under zero tension and under the same tension (γ/_γ_0 = 0.75) as in the simulations of fusion. Lateral tension greatly enhances the flip-flop rate in the single bilayer system. This effect can be explained by an overall thinning of the membrane, which lowers the translocation barrier, as well as by the diffusion of amphiphiles through the transient holes formed under tension. In the simulations of the apposed bilayers, translocation of amphiphiles from the trans leaves initially follows the same dynamics as in the single bilayer system, but eventually deviates from it, apparently due to the formation of holes facilitated by the appearance of the stalks, as discussed in the previous section. Amphiphiles from the cis leaves undergo mixing to the largest extent, as would be expected due to stalk formation. Third, our mechanism allows for transient leakage during fusion. As noted earlier, there will be greater leakage if fusion occurs via pathway 2, in which the stalk aligns and surrounds two holes, than if it occurs via pathway 1, in which the stalk rapidly surrounds one hole before the second appears. Clearly the amount of leakage depends on the size of the transient holes formed in the bilayer, the time between the formation of the initial stalk and the completion of the fusion pore, and the diffusion constant of the molecules which leak. This constant introduces another timescale whose magnitude, relative to that of fusion pore formation, determines whether the fusion process is observed to be leaky or tight.
FIGURE 10.
Probability of finding an amphiphilic molecule in its original monolayer after time t. The solid and dashed lines refer to simulations of a single bilayer under tension, γ/_γ_0 = 0 and γ/_γ_0 = 0.75, respectively. Lines with symbols present the results obtained in the simulations of fusing bilayers. Squares and circles refer to cis and trans monolayers, respectively. The time period corresponds to the formation of stalks and holes. Error bars show standard deviations obtained from 32 runs.
It is clear that within our mechanism, leakage via transient holes and fusion via pore formation are correlated in space and time. The latter is shown in Fig. 11 which presents, as a function of time, the area of holes and that of fusion pores from one of the simulation runs. One sees in this figure, as in the Monte Carlo snapshots, that the rate at which holes appear, and therefore the rate at which leakage should occur, increases significantly before, and is correlated with, the formation of fusion pores. Once the fusion pore has formed, the creation of other holes decreases due to release of tension initially stored in the membranes.
FIGURE 11.
Area of pore (symbols) and of holes (lines) vs. time for one simulation run (identical to Fig. 6). Note the different scale for pore and hole areas.
The question of whether transient leakage is characteristic of membrane fusion is an open one. On the one hand, some experiments detect no leakage (Smit et al., 2002; Spruce et al., 1991; Tse et al., 1993), while on the other there is a great deal of evidence that fusion of biological membranes is, indeed, a leaky process (Bonnafous and Stegmann, 2000; Dunina-Barkovskaya et al., 2000; Haque and Lentz, 2002; Shangguan et al., 1996; Smit et al., 2002). It could be argued that observed leakage is due to the presence, in these experiments, of fusion proteins, such as hemagglutinin, which are certainly present in the vicinity of fusion, and which are known to undergo conformational changes in which part of the protein inserts itself into the target vesicle. In support of this view, one could cite the well-known ability of fusion peptides to initiate erythrocyte hemolysis (Niles et al., 1990). Such peptides are not included in our model. This argument is vitiated, however, by the observation that leakage is also detected in the fusion of model membranes without such peptides (Cevc and Richardsen, 1999; Evans and Lentz, 2002; Lentz et al., 1997). In these experiments, large molecules, such as polyethyleneglycol, are used to bring the fusing vesicles together. It would be difficult to argue that these molecules, which undergo no conformational change, are responsible for the leakage as they generate an attractive osmotic force between the vesicles precisely because their large size makes it difficult for them to enter the region where the vesicles are closely apposed.
One test that might distinguish whether leakage simply accompanies fusion or is causally related to it is provided by the observation above that in our mechanism transient leakage is correlated in time and space with fusion. Just such an experiment to measure these correlations has been carried out recently (Frolov et al., 2003), and is reported in the companion article to this manuscript. They observe that leakage is, in fact, correlated spatially and temporally with the process of fusion. Indeed, their results comparing the time sequence of the electrical conductance arising from leakage with that arising from fusion (shown in their Fig. 5), display a remarkable similarity to our results, comparing the time sequence of the areal fraction taken up by holes with that taken up by fusion pores (our Fig. 11).
While the congruence between the predictions of our model and experiment are very encouraging, there are further tests we should like to apply to it. Foremost among these is to determine the free energy barriers for the various steps along the fusion pathway. As noted above, it is relatively simple to determine the internal energy during the course of the simulation as one need only monitor the interactions between all segments. But the simulations cannot easily evaluate the entropy changes along the fusion pathway or, therefore, the free energy barrier. To determine the actual value for the free energy barrier, calculations using self-consistent field theory, which have been extremely successful in describing the phase behavior of amphiphiles (Matsen and Bates, 1996; Matsen and Schick, 1994) are currently being pursued by us. Also, elastic constants of the simulated amphiphilic monolayers, e.g., calculated in Müller and Gompper (2002), could be employed in the simpler phenomenological theories, which have proved to be so useful. Comparison with the full self-consistent field calculations would permit determination of the accuracy of these elastic models in describing the highly curved intermediates involved in the fusion reaction. Furthermore, there is an extensive experimental evidence on the effect of lipids of differing architecture on fusion (Chernomordik, 1996; Zimmerberg and Chernomordik, 1999). The self-consistent field theory is able to describe such differences (Li and Schick, 2000; Matsen, 1995) and to determine both the spatial distribution of different amphiphiles in inhomogeneous structures such as the stalk, the holes, and the fusion pore, as well as the change in the free energy of these structures. Results of these investigations will be published separately.
It would be of great interest to repeat our simulations under different membrane tension, as this would help to clarify the importance of fusion peptides in bringing about such tension. Finally, it would be desirable to carry out simulations in which fusion peptides are included explicitly. One could investigate whether the membrane perturbations associated with such inclusions provide sites for the nucleation of the small holes that are necessary for the formation of the fusion pore. If this were so, one could test the further inference that, by providing nucleation sites in close proximity, one in each membrane, such peptides facilitate successful and rapid fusion thereby reducing leakage.
Acknowledgments
We acknowledge very useful conversations with L. Chernomordik, F. Cohen, M. Kozlov, B. Lentz, D. Siegel, and J. Zimmerberg. We are particularly grateful to V. Frolov for sharing his knowledge and expertise with us.
Financial support was provided by the National Science Foundation under grants DMR 9876864 and DMR 0140500 and the Deutsche Forschungsgemeinschaft (DFG) Bi 314/17. Computer time at the NIC Jülich, the HLR Stuttgart, and the computing center in Mainz is also gratefully acknowledged. M.M. thanks the DFG for a Heisenberg stipend.
References
- Bonnafous, P., and T. Stegmann. 2000. Membrane perturbation and fusion pore formation in influenza hemagglutinin-mediated membrane fusion. J. Biol. Chem. 275:6160–6166. [DOI] [PubMed] [Google Scholar]
- Carmesin, I., and K. Kremer. 1988. The bond fluctuation method: a new effective algorithm for the dynamics of polymers in all spatial dimensions. Macromolecules. 21:819–823. [Google Scholar]
- Cevc, G., and H. Richardsen. 1999. Lipid vesicles and membrane fusion. Adv. Drug. Deliv. 38:207–232. [DOI] [PubMed] [Google Scholar]
- Chen, Y. A., and R. H. Scheller. 2001. Snare-mediated membrane fusion. Nat. Rev. Mol. Cell Biol. 2:98–106. [DOI] [PubMed] [Google Scholar]
- Chen, Z., and R. P. Rand. 1997. The influence of cholesterol on phospholipid membrane curvature and bending elasticity. Biophys. J. 73:267–276. [DOI] [PMC free article] [PubMed] [Google Scholar]
- Chernomordik, L. 1996. Non-bilayer lipids and biological fusion intermediates. Chem. Phys. Lipids. 81:203–213. [DOI] [PubMed] [Google Scholar]
- Chernomordik, L. V., M. M. Kozlov, G. B. Melikyan, I. G. Abidor, V. S. Markin, and Y. A. Chizmadzhev. 1985. The shape of lipid molecules and monolayer membrane fusion. Biochim. Biophys. Acta. 812:643–655. [Google Scholar]
- Davis, H. 1996. Statistical Mechanics of Phases, Interfaces, and Thin Films. Wiley-VCH, New York, NY.
- Discher, B. D., Y. Y. Won, D. S. Ege, J. C. M. Lee, F. S. Bates, D. E. Discher, and D. A. Hammer. 1999. Polymersomes: tough vesicles made from diblock copolymers. Science. 284:1143–1146. [DOI] [PubMed] [Google Scholar]
- Disko, M. M., K. S. Liang, S. K. Behal, R. J. Roe, and K. J. Jeon. 1993. Catenoid-lamellar phase in blends of styrene-butadiene diblock copolymer and homopolymer. Macromolecules. 26:2983–2986. [Google Scholar]
- Dunina-Barkovskaya, A. Y., A. V. Samsonov, V. S. Pivovarov, and V. A. Frolov. 2000. Hemagglutinin-induced fusion of hab2 and plc cells: dynamics of fusion pore conductance. Membr. Cell Biol. 13:567–580. [PubMed] [Google Scholar]
- Evans, K. O., and B. R. Lentz. 2002. Kinetics of lipid rearrangements during poly(ethylene glycol)-mediated fusion of highly curved unilamellar vesicles. Biochemistry. 41:1241–1249. [DOI] [PubMed] [Google Scholar]
- Flint, S., V. Racaniello, L. Enquist, A. Skalka, and R. Krug. 2000. Virology: Molecular Biology, Pathogenesis, and Control. ASM Press, Washington, DC. p136.
- Frolov, V. A., A. Y. Dunina-Barkovskaya, A. V. Samsonov, and J. Zimmerberg. 2003. Membrane permeability changes at early stages of influenza hemagglutinin-mediated fusion. Biophys. J. 85:1726–1734. [DOI] [PMC free article] [PubMed] [Google Scholar]
- Haque, M. E., and B. R. Lentz. 2002. Influence of gp41 fusion peptide on the kinetics of poly(ethylene glycol)-mediated model membrane fusion. Biochemistry. 41:10866–10876. [DOI] [PubMed] [Google Scholar]
- Jahn, R., and H. Grubmüller. 2002. Membrane fusion. Curr. Opin. Cell Biol. 14:488–495. [DOI] [PubMed] [Google Scholar]
- Kozlov, M. M., and V. S. Markin. 1983. Possible mechanism of membrane fusion. Biofizika. 28:255–261. [PubMed] [Google Scholar]
- Kozlovsky, Y., L. V. Chernomordik, and M. M. Kozlov. 2002. Lipid intermediates in membrane fusion: formation, structure, and decay of hemifusion diaphragm. Biophys. J. 83:2634–2651. [DOI] [PMC free article] [PubMed] [Google Scholar]
- Kozlovsky, Y., and M. M. Kozlov. 2002. Stalk model of membrane fusion: solution of energy crisis. Biophys. J. 82:882–895. [DOI] [PMC free article] [PubMed] [Google Scholar]
- Kuzmin, P. I., J. Zimmerberg, Y. A. Chizmadzhev, and F. S. Cohen. 2001. A quantitative model for membrane fusion based on low-energy intermediates. Proc. Natl. Acad. Sci. USA. 98:7235–7240. [DOI] [PMC free article] [PubMed] [Google Scholar]
- Lee, J., and B. R. Lentz. 1997. Evolution of lipidic structures during model membrane fusion and the relation of this process to cell membrane fusion. Biochemistry. 36:6251–6259. [DOI] [PubMed] [Google Scholar]
- Leikin, S., M. M. Kozlov, N. L. Fuller, and R. P. Rand. 1996. Measured effects of dyacilglycerol on structural and elastic properties of phospholipid membrane. Biophys. J. 71:2623–2632. [DOI] [PMC free article] [PubMed] [Google Scholar]
- Lentz, B. R., V. Malinin, M. E. Haque, and K. Evans. 2000. Protein machines and lipid assemblies: current views of cell membrane fusion. Curr. Opin. Struct. Biol. 10:607–615. [DOI] [PubMed] [Google Scholar]
- Lentz, B. R., W. Talbot, J. Lee, and L. X. Zheng. 1997. Transbilayer lipid redistribution accompanies poly(ethylene glycol) treatment of model membranes but is not induced by fusion. Biochemistry. 36:2076–2083. [DOI] [PubMed] [Google Scholar]
- Li, X.-J., and M. Schick. 2000. Distribution of lipids in nonlamellar phases of their mixtures. J. Chem. Phys. 112:6063–6072. [Google Scholar]
- Markin, V. S., and J. P. Albanesi. 2002. Membrane fusion: stalk model revisited. Biophys. J. 82:693–712. [DOI] [PMC free article] [PubMed] [Google Scholar]
- Markin, V. S., and M. M. Kozlov. 1983. Primary act in the process of membrane fusion. Biofizika. 28:73–78. [PubMed] [Google Scholar]
- Matsen, M. W. 1995. Phase behavior of block copolymer/homopolymer blends. Macromolecules. 28:5765–5773. [Google Scholar]
- Matsen, M. W., and F. S. Bates. 1996. Origins of complex self-assembly in block copolymers. Macromolecules. 29:7641–7644. [Google Scholar]
- Matsen, M. W., and M. Schick. 1994. Stable and unstable phases of a diblock copolymer melt. Phys. Rev. Lett. 72:2660–2663. [DOI] [PubMed] [Google Scholar]
- Melikyan, G. B., J. M. White, and F. S. Cohen. 1995. Gpi-anchored influenza hemagglutinin induces hemifusion to both red blood cells and planar bilayer membranes. J. Cell Biol. 131:679–691. [DOI] [PMC free article] [PubMed] [Google Scholar]
- Monck, J. R., and J. M. Fernandez. 1996. The fusion pore and mechanisms of biological membrane fusion. Curr. Opin. Cell Biol. 8:524–533. [DOI] [PubMed] [Google Scholar]
- Müller, M., and G. Gompper. 2002. Elastic properties of polymer interfaces: aggregation of pure diblock, mixed diblock, and triblock copolymers. Phys. Rev. E. 66:041805–041813. [DOI] [PubMed] [Google Scholar]
- Müller, M., K. Katsov, and M. Schick. 2002. New mechanism of membrane fusion. J. Chem. Phys. 116:2342–2345. [Google Scholar]
- Müller, M., and M. Schick. 1996. Structure and nucleation of pores in polymeric bilayers: a Monte Carlo simulation. J. Chem. Phys. 105:8282–8292. [Google Scholar]
- Niles, W., M. Peeples, and F. Cohen. 1990. Kinetics of virus-induced hemolysis measured for single erythrocytes. Virology. 174:593–598. [DOI] [PubMed] [Google Scholar]
- Noguchi, H., and M. Takasu. 2001. Fusion pathways of vesicles: a Brownian dynamics simulation. J. Chem. Phys. 115:9547–9551. [Google Scholar]
- Rand, R. P., N. L. Fuller, S. M. Gruner, and V. A. Parsegian. 1990. Membrane curvature, lipid segregation, and structural transitions for phospholipids under dual-solvent stress. Biochemistry. 29:76–87. [DOI] [PubMed] [Google Scholar]
- Rand, R. P., and V. A. Parsegian. 1989. Hydration forces between phospholipid bilayers. Biochim. Biophys. Acta. 988:351–376. [Google Scholar]
- Safran, S. A. 1994. Statistical Thermodynamics of Surfaces, Interfaces and Membranes. Addison Wesley, Reading, MA.
- Shangguan, T., D. Alford, and J. Bentz. 1996. Influenza virus-liposome lipid mixing is leaky and largely insensitive to the material properties of the target membranes. Biochemistry. 25:4956–4965. [DOI] [PubMed] [Google Scholar]
- Shelley, J. C., M. Shelley, R. Reeder, S. Bandyopadhay, and M. Klein. 2001. A coarse grain model for phospholipid simulations. J. Phys. Chem. B. 105:4464–4470. [Google Scholar]
- Shillcock, J. C., and R. Lipowsky. 2002. Equilibrium structure and lateral stress distribution of amphiphilic bilayers from dissipative particle dynamics simulations. J. Chem. Phys. 117:5048–5061. [Google Scholar]
- Siegel, D. P. 1993. Energetics of intermediates in membrane fusion: comparison of stalk and inverted micellar intermediate mechanisms. Biophys. J. 65:2124–2140. [DOI] [PMC free article] [PubMed] [Google Scholar]
- Smit, J. M., G. Li, P. Schoen, J. Corver, R. Bittman, K. C. Lin, and J. Wilschut. 2002. Fusion of alphaviruses with liposomes is a non-leaky process. FEBS Lett. 421:62–66. [DOI] [PubMed] [Google Scholar]
- Spruce, A., A. Iwata, and W. Almers. 1991. The first milliseconds of the pore formed by a fusogenic viral envelope protein during membrane fusion. Proc. Natl. Acad. Sci. USA. 88:3623–3627. [DOI] [PMC free article] [PubMed] [Google Scholar]
- Tse, F., A. Iwata, and W. Almers. 1993. Membrane flux through the pore formed by a fusogenic viral envelope protein during cell fusion. J. Cell Biol. 121:543–552. [DOI] [PMC free article] [PubMed] [Google Scholar]
- Yang, L., and H. W. Huang. 2002. Observation of a membrane fusion intermediate structure. Science. 297:1877–1879. [DOI] [PubMed] [Google Scholar]
- Zimmerberg, J., and L. V. Chernomordik. 1999. Membrane fusion. Adv. Drug Deliv. Rev. 38:197–205. [DOI] [PubMed] [Google Scholar]
