Genome-wide definitive haplotypes determined using a collection of complete hydatidiform moles (original) (raw)
Abstract
We present genome-wide definitive haplotypes, determined using a collection of 74 Japanese complete hydatidiform moles, each carrying a genome derived from a single sperm. The haplotypes incorporate 281,439 common SNPs, genotyped with a high throughput array-based oligonucleotide hybridization technique. Comparison of haplotypes inferred from pseudoindividuals (constructed from randomized mole pairs) with those of moles showed some switch errors in resolution of phases by the computational inference method. The effects of these errors on local haplotype structure and selection of tag SNPs are discussed. We also show that definitive haplotypes of moles may be useful for elucidation of long-range haplotype structure, and should be more effective for detecting extended haplotype homozygosity indicative of positive selection.
Recent studies have shown that patterns of linkage disequilibrium (LD) vary across the human genome, with regions of high LD interspersed with regions of low LD (Patil et al. 2001; Gabriel et al. 2002). In high-LD regions, the diversity of haplotype structure is low and a small number of SNPs are sufficient to capture most of the common haplotypes (Johnson et al. 2001; Patil et al. 2001). Therefore, it is believed that sets of informative SNPs (tag SNPs) chosen based on LD and/or haplotype block structure can be used as markers in genome-wide association studies without much loss of power (Zhang et al. 2002a).
Several computational methods for large-scale haplotype block partitioning have been developed (Patil et al. 2001; Gabriel et al. 2002; Zhang et al. 2002b; Phillips et al. 2003). Despite differences in concepts for haplotype partitioning, most of these methods rely on computational inference of haplotypes using genotypes obtained from diploid materials as starting data. Although various algorithms have been developed to estimate haplotypes from diploid genotype data, errors in haplotype inference remain unresolved (Stephens and Scheet 2005), and it is not clearly understood how errors in haplotype inference affect the definition of haplotype block partitioning and the detection of disease associations in case-control studies. In the HapMap Project (The International HapMap Consortium 2003; http://www.hapmap.org), haplotypes for samples of Asian ancestry are inferred without family data and are less accurate than those for samples of European or African ancestry, which are determined using trio data.
The complete hydatidiform mole (CHM) is a benign tumor, mostly with a karyotype of 46, XX, formed by the fertilization of an empty ovum by a single haploid sperm, that later duplicates its chromosomes to give a diploid (duplicated haploid) cell mass. CHMs offer a unique opportunity for determining long-range definitive haplotypes at a genome-wide level (Taillon-Miller et al. 1997; Fan et al. 2002), as opposed to the inferred haplotypes that are commonly adopted in various genome-wide studies, including the HapMap Project.
We genotyped 74 CHM samples that were collected throughout Japan using 281,439 common SNPs to obtain genome-wide definitive haplotypes. Using this data, whole genome haplotype block maps were constructed. We also used the haplotype data to create diploid “pseudoindividuals” from pairs of randomized moles, to determine the frequency of phasing errors and to assess the effects of these errors in haplotype block estimations. In addition, we examined extended shared haplotypes using the CHM data, and results were compared with those constructed from HapMap project genotype data. We found that the latter may fail to capture some extended haplotypes, some of which are expected to be indicative of positive selection.
Results
SNPs genotyped in this study
The CHM samples were genotyped using two sets of high-density oligonucleotide arrays. The first set contained 266,722 tag SNPs chosen to cover LD “bins” observed in a population of European ancestry (Hinds et al. 2005). While these SNPs were preferentially selected to be polymorphic in a European population, most were also polymorphic in other populations. We found that 36% of these SNPs were monomorphic in the CHM samples. The second set contained 91,828 SNPs chosen to maximize coverage of LD bins for a Han Chinese population when combined with the first set (Hinds et al. 2005). From these two SNP sets, 281,561 SNPs were successfully genotyped and polymorphic (minor alleles observed in at least 2 CHMs). The genotyping quality filters are described in the Methods section. Of these SNPs, 281,439 have been mapped in the NCBI human genome map of Build 35, and were used for the following analyses.
Of the 75 CHMs, one was not included in most of the analysis, since it had a low call rate of 71.6%. For the remaining 74 CHMs, the call rates were >92%, as summarized in Supplemental data S1.
We evaluated the quality of the genotype data using an independent platform, the Affymetrix 100K array, which contained 18,782 SNPs in common with the SNPs described above. We genotyped 10 CHMs using this array, and the concordance rate for the 178,304 genotypes called in both sets was 99.91%, far better than the accuracy required for the analysis of multi-marker haplotypes (Gabriel et al. 2002).
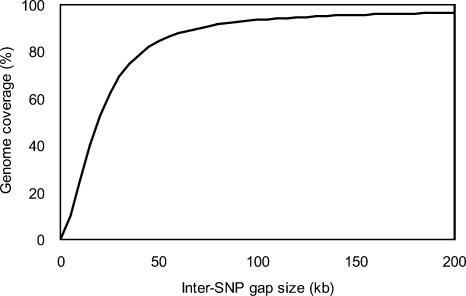
The median physical distance between genotyped SNPs is 5.5 kb and the average distance between SNPs is 10.0 kb, excluding centromeric gaps. More than 90% of the genome is within inter-SNP intervals of ≤70 kb, and >50% is covered by inter-SNP intervals of ≤20 kb, considering just the intervals between the first and last SNPs on each chromosome arm (Fig. 1).
Figure 1.
Summary of SNPs used in this study. The relationship between inter-SNP gap size and genome coverage is shown. A genome size of 2.82 Gb was assumed, which is the sum of intervals between the first and last SNPs on each chromosomal arm of Build 35. The gaps spanning centromeres are not considered.
Allele frequencies and linkage disequilibrium
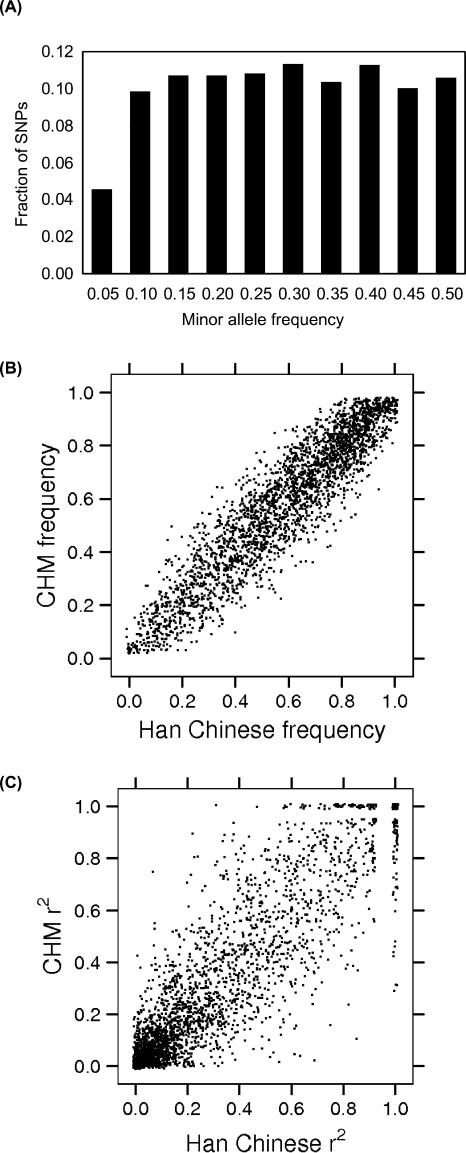
The distribution of minor allele frequencies of SNPs determined for the CHMs is essentially flat between 10% and 50% (Fig. 2A). We compared allele frequencies determined here with those among the Han Chinese sample previously reported (Hinds et al. 2005), and found a high correlation (Fig. 2B, R2 = 0.93).
Figure 2.
Allele frequencies and linkage disequilibrium of SNPs used in this study. (A) Fractions of SNPs in bins of minor allele frequencies among CHMs are shown. Comparisons of allele frequencies (B) and r2 values (C) between CHM and Han Chinese are shown. One percent of the genotyped SNPs are displayed (i.e., ∼2800) to keep the number of points manageable in B and C.
We measured linkage disequilibrium between adjacent SNPs using r2 statistics. The correlation between Han Chinese and CHM r2 values was 0.89 (Fig. 2C). For SNPs with an estimated r2 > 0.8 in the Han Chinese data, 76% had r2 > 0.8 and 96% had r2 > 0.5 in the CHM data (Supplemental Fig. S1). Thus, SNPs selected based on the diploid Han Chinese samples generally do seem to behave similarly in the CHM samples.
Definitive haplotypes, block structure, and tag SNPs
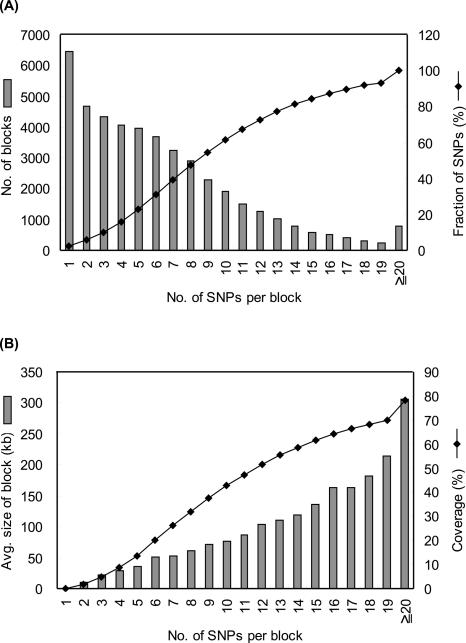
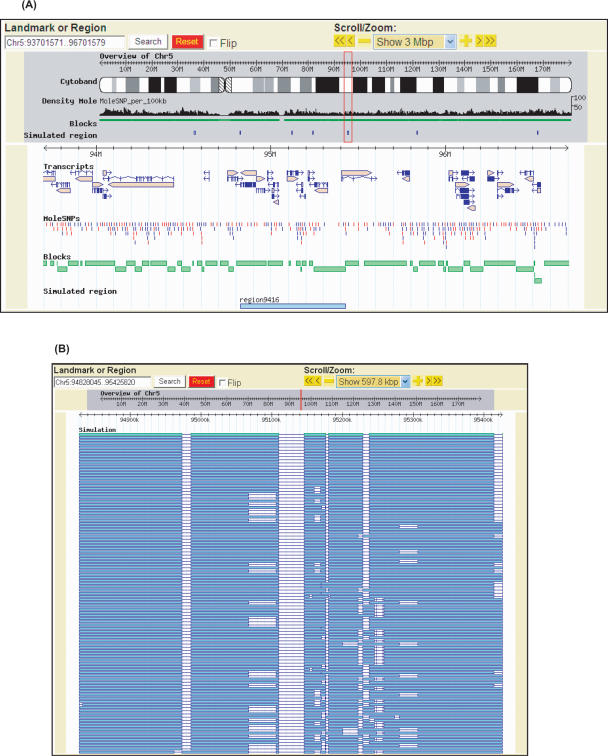
We partitioned the haplotypes of the 74 CHMs into blocks using HapBlock (Zhang et al. 2002b, 2005), with the parameters for block definition and tag SNP selection as detailed in the Methods section. Supplemental Table S2 and Figure 3 summarize the results, and Figure 4 shows a screen shot of the Kyushu University Definitive Haplotype Database (http://orca.gen.kyushu-u.ac.jp/) displaying an example of the haplotype block pattern using the Generic Genome Browser (Stein et al. 2002).
Figure 3.
Gross characteristics of haplotype blocks. (A) Blocks were classified by the number of SNPs per block. The histogram shows the number of blocks in each class. The line plot shows the cumulative fraction of SNPs covered by the blocks. (B) Block size and genome coverage classified by the number of SNPs per block. The histogram shows the average size of blocks. The line plot shows cumulative genome coverage of blocks. A genome size of 2.93 Gb is assumed, which is the summation of regions between the first and last SNPs on chromosomes of Build 35, including centromeres.
Figure 4.
Browser views of haplotype block structure. (A) Blocks deduced from 74 CHM haplotypes are shown in green boxes, along with other information, e.g., SNPs used for the typing, SNP density distributions, and transcripts. The regions examined by pseudoindividual analysis for phasing accuracy assessment are indicated by blue boxes at the bottom. (B) Blocks deduced from CHM haplotypes (green bars) and those from inferred haplotypes of 100 sets of pseudoindividuals (blue bars) are compared.
A total of 44,939 blocks was defined genome-wide. Of these, 6444 blocks (14%) contained a single SNP, but these isolated SNPs constitute only a small fraction (2%) of all SNPs. The average block size was 51.1 kb (6.3 SNPs per block), which was approximately twice as large as previously reported for Japanese and/or Chinese populations (Hinds et al. 2005). This difference may be attributable to differences in SNP density, allele frequency distribution, and sample size (Sun et al. 2004). The average number of common (≥5%) haplotypes per block was 4.1, similar to values observed for other populations (Gabriel et al. 2002). A total of 74,402 tag SNPs was identified, corresponding to 26% of all SNPs used.
Comparison of block structures of CHMs and HapMap Japanese sets
The haplotype block structures of the present study and of the HapMap Japanese in Tokyo, Japan (JPT) samples represent genetic diversity of the same underlying Japanese population, although the material of the two studies was independently collected. It is of interest to see how similar (or different) are the results of the two studies. Haplotype blocks for the HapMap JPT samples were constructed by HapBlock using the phased (release 16) HapMap genotype data. Since these were mapped on Build 34 of the reference human sequence, we remapped these blocks onto Build 35 for comparison with our CHM-based structures. During this process, a portion of phased HapMap SNPs (14,966 SNPs) failed to be mapped or their order relative to surrounding SNPs was changed. Taking this into account, we considered 10,076 blocks (including blocks with a single SNP) containing those SNPs that were possibly problematic. The remaining 50,717 blocks were assumed to be correctly remapped on Build 35. We selected 256 long regions (>1 Mb) without problematic blocks and compared the blocks with our CHM-derived partition results (Supplemental data S4). In these regions, 92,296 SNPs were assigned to 8174 blocks (average block size: 38.4 kb, 11 SNPs) in the HapMap JPT data, and 37,477 SNPs were assigned to 6287 blocks in the CHM data. The numbers of tag SNPs were 12,704 (JPT) and 10,122 (CHM). It is not easy to compare block structures of CHM and JPT sets, because of the differences in numbers of chromosomes (74 CHM vs. 90 JPT chromosomes) and SNP density (2.8-fold more SNPs in the JPT data than in the CHM data). These differences are known to seriously affect block partition (Ke et al. 2004; Sun et al. 2004).
Assessment of errors in phasing and subsequent block partitioning
Several methods for phasing of unrelated individuals have been developed (Salem et al. 2005). Of these, PHASE, which employs a coalescence model-based algorithm, seems to be the most accurate software for inferring haplotypes. Still, some phasing errors inevitably occur, as demonstrated in an evaluation study using several genomic regions (Stephens and Scheet 2005). Since massive definitive haploid data were available here, we assessed the accuracy of phasing with this software using many genomic regions.
We first selected 134 non-overlapping genomic regions (125 autosomal regions and 9 × chromosome regions [Fig. 4A]) each containing 50 SNPs to test the accuracy of phase determination by PHASE. The number of SNPs per region was decided based on our computing capacity. Since missing genotypes leave uncertainty in the phasing and following evaluations, we selected subsets of CHMs for which all 50 SNPs were called for each region. As a result, the number of CHMs used in the analysis varied from 56 to 62 (28–31 pseudoindividuals), and all 50 SNPs were polymorphic in 122 regions. The remaining 12 regions contained between one and three SNPs that were monomorphic across the selected CHMs. The total size of the analyzed regions was 67 Mb, or ∼2% of the whole human genome. The SNP densities ranged from 10.7 to 350.0 SNPs per Mb (one SNP per 2.9 to 93.8 kb).
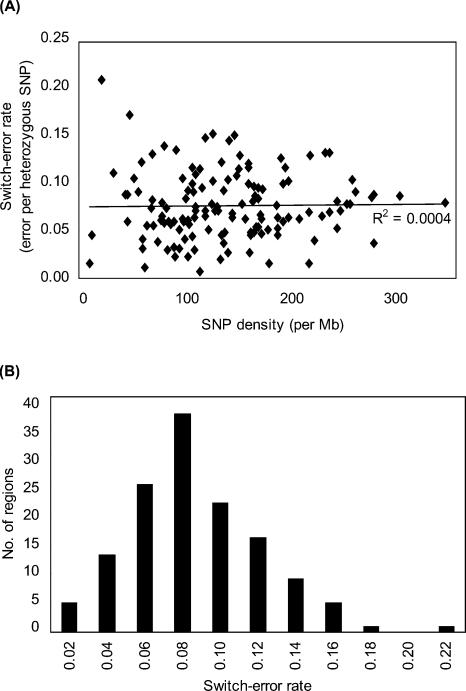
We made 100 sets of pseudoindividuals for each region, as described in the Methods section. Phasing for each set was done using PHASE v2.1.1 (Stephens and Scheet 2005). We then calculated the switch error rate, which measures the proportion of heterozygote positions whose phase is incorrectly inferred relative to the previous heterozygote position in the pseudoindividuals by comparing with trues (actual CHM types) (Lin et al. 2002; Stephens and Scheet 2005). As shown in Figure 5, switch-error rates were variable region-by-region (range of 0.7%–20.6%, average of 7.7%). The rate was apparently independent of SNP density (R2 = 0.0004). The error rate obtained here is within the range of reported values estimated from pseudoindividuals made from X chromosome haplotypes, and from reconstruction of haplotypes obtained from trios in an autosomal region (Stephens and Scheet 2005).
Figure 5.
Accuracy of phasing. (A) Haplotypes of 134 genomic regions consisting of 50 SNPs were inferred from synthetic diploid genotypes of pseudoindividuals (random pairs of CHMs) by the PHASE program (V. 2.11). Switching errors were counted by the method of Lin et al. (2002). Each data point represents an average of 100 data sets. The range of SNP density was 10.7–350.0 SNPs per Mb. Regression line was obtained by the least square method. (B) Distribution of switch error rate is shown.
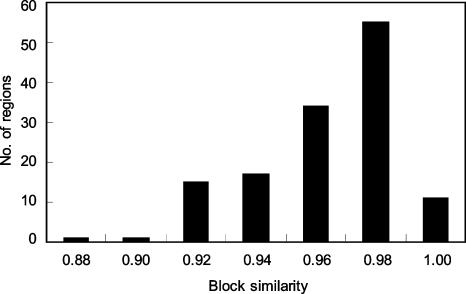
The 134 haplotype-inferred regions were partitioned into blocks using HapBlock v30 (Fig. 4B). A total of 1048 blocks was defined for true sets (CHM sets), yielding an average block size of 54 kb (6.4 SNPs per block). The average number of tag SNPs per region was 12.8, and the average number of common (≥5%) haplotypes per block was 4.3. These values obtained from the 134 regions were similar to those from the whole genome. Overall, the size distributions, numbers of tag SNPs, and numbers of common haplotypes were similar between the true and pseudo sets. However, some of block partitions in pseudo sets were different from those of the true set. We measured the similarity of blocking patterns using several criteria (Fig. 6; Supplemental data S5), among which was the concordance rate of SNP pairs grouped into the same block (Liu et al. 2004). For two partition sets (one from the CHM data and one from a phased pseudo set), we determined for every SNP pair whether they were assigned to the same block or not. Then, we determined the fraction of concordant pairs between the two partitions. In this analysis, the results of 100 comparisons between true and pseudo sets were averaged. The concordance averaged 95%; thus, ∼5% of SNP pairs were discordant due to incorrect inference of haplotypes. In some cases, the discordance rate was as high as 12%, although such cases seemed to be rare (Fig. 6).
Figure 6.
Evaluation of block similarity. Using HapBlock, we obtained block-partitions of pseudoindividual sets and CHM sets for haplotype-inferred regions. For each pseudo set, the block similarity was calculated as described by Liu et al. (2004) and averaged for each simulated region (average of 100 sets). The distribution of the block similarity for regions is shown.
Extended shared haplotype analysis
We were interested in the question of whether genotyping CHM samples offers additional advantages compared with genotyping diploid samples and computationally inferring phase. Therefore, we compared extended shared haplotypes (ESHs) obtained from CHM data and from phased HapMap data to evaluate a possible advantage of CHMs in identifying extended intervals of haplotype homozygosity.
The identification of ESH is sensitive to the choice of SNPs assayed, especially their density (see Supplemental data S6). Therefore, we identified 93,531 SNPs that were genotyped and polymorphic both in the CHM data and in the HapMap JPT data. This shared subset of SNPs represented ∼34% of the SNPs genotyped in the CHM samples, and ∼13% of the HapMap SNPs polymorphic in the JPT samples. The ESH analyses of HapMap samples were done for 37 phased diploid unrelated JPT and 37 phased CEPH Utah residents with ancestry from northern and western Europe (CEU) parent samples to match the number of individuals in the CHM data, using the shared SNPs and also using all SNPs typed in each data set. We then identified ESHs that extended ≥1 Mb or ≥2 Mb by examining all pairs of the 74 CHM samples, or the phased diploid HapMap data.
Table 1 summarizes the numbers of ESHs and their total coverage for the CHM samples, and for the HapMap JPT and CEU samples, across the shared subset of SNPs. The CHM data contained more ESHs, covering more of the genome, than the two HapMap samples, presumably because inferred haplotypes contained a low frequency of phasing errors, which broke some extended haplotypes. The JPT had more 1-Mb haplotypes than the CEU, but fewer 2-Mb haplotypes. This might reflect generally higher quality phasing in the CEU data, which is based on trios; hence, correct phase is confirmed at most SNPs, and the only ambiguous cases are positions that are heterozygous in all three trio members.
Table 1.
Extended shared haplotypes
| Span (Mb) | Group | Haplotypes | Coverage (Gb) |
|---|---|---|---|
| >1 | CHM | 128,806 | 223.1 |
| JPT | 106,372 | 184.9 | |
| CEU | 98,171 | 166.8 | |
| >2 | CHM | 8492 | 34.8 |
| JPT | 5417 | 22.8 | |
| CEU | 6669 | 25.0 |
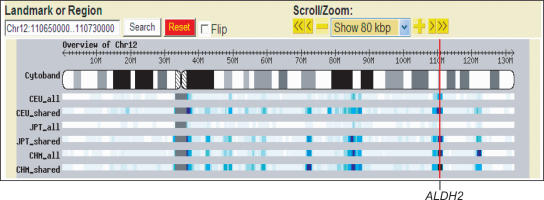
Figure 7 shows an example of a chromosome-wide view of ESH density. Many of the peaks of ESH density are common among different samples. Also evident is the fact that many of the density peaks are observed regardless of the number of SNPs used to detect the homozygosity, demonstrating that the sparse shared SNP subset is sufficient for detection of ESH.
Figure 7.
A browser view of extended shared haplotypes. The density of extended shared haplotypes (ESHs) >1 Mb among all pairs of haplotypes of 74 HapMap CEU chromosomes, 74 HapMap JPT chromosomes, and 74 CHM chromosomes from this study are shown. The total numbers of SNPs participating in the ESH analyses were 772,839 (CEU_all), 698,909 (JPT_all), 274,957 (CHM_all), 89,164 (CEU_shared), and 93,531 (JPT_shared and CHM_shared). The density was determined as the number of overlapping ESHs at 100-kb intervals. ESHs spanning centromeres may be artifactual because SNPs are sparse or absent in these regions. The bars in the overview track are color-coded to indicate ESH density: white for zero, light to dark blue for one to 860, and black for >860. Red vertical line indicates the position of the ALDH2 locus.
Bersaglieri et al. (2004) reported an example of detection of population-specific, recent positive selection around the LCT gene by extended haplotype homozygosity analysis. We confirmed that ESH is elevated in only the CEU data set and not in the JPT and CHM. Aldehyde dehydogenase 2, ALDH2, is a candidate natural selection gene in Asian populations. It is reported that this site has low haplotype diversity, and one haplotype, which is responsible for catalytic deficiency, is Asian-specific (Oota et al. 2004). This locus on chromosome 12q is detected as a site with increased ESH density in CHM samples. It is also high in the CEU data set, possibly reflecting low haplotype diversity in this region also among Caucasians. This elevated ESH was not detected in the JPT data, possibly due to limited accuracy of phasing as described above. Further analysis to detect the core and extended haplotype allele in each density peak should allow discovery of more loci responsible for positive selection.
Discussion
In almost all large-scale genome diversity projects, genotypes are determined using diploid samples, and haplotypes are inferred computationally, either using family data or by population genetics-based inference. However, these inference methods do not always produce accurate and definitive haplotype data. Even if family data are available, haplotypes remain ambiguous for markers that are heterozygous for all family members.
CHMs are tissues of gestational trophoblastic disease resulting from rare events of abnormal gametogenesis and/or fertilization. Although the exact etiology of CHM is unknown, most of these tissues arise by the fertilization of an anucleate egg by a single sperm. Phenotype–genotype comparison between CHMs indicates that maternal genomic condition plays a role in the pathophysiology of molar pregnancies, and paternal genomic contexts, i.e., genomes of CHMs, do not seem to be involved. Thus, a collection of CHM genomes can be regarded to represent generalized genomes of the population.
Most complete hydatidiform mole samples are homozygous diploids, and genotyping of multiple loci on one chromosome yields a definitive haplotype. Chromosome-wide haplotype analysis using CHMs was pioneered by Kwok's group (Taillon-Miller et al. 1997; Fan et al. 2002). Here we extended this strategy to the whole genome level, with an average SNP density of one SNP per 10 kb, using CHM samples collected throughout Japan.
The incidence of hydatidiform moles is known to be moderately high, representing 0.5 to one per 1000 pregnancies in Caucasians and one to two per 1000 pregnancies in eastern Asians (Steigrad 2003). Recent technical improvement in whole genome amplification allowed us to genotype hundreds of thousands of SNPs using a small amount (∼100 ng) of template DNA. Thus, collecting CHMs, extracting and amplifying the DNA, and determining definitive haplotypes in any population seems to be a realistic approach to establish a haplotype profile of the population.
We have shown that the allele frequencies of SNPs are highly correlated between Japanese and Chinese samples. Measures of linkage disequilibrium, i.e., r2 values, between neighboring SNPs were also similar between the two populations; these facts suggest a close relationship between the two populations. Thus, many of the conclusions drawn here for the Japanese should also apply to the Chinese population.
To estimate the error rate of the phasing process, we simulated diploid genomes using definitive haploid data from 134 genomic regions, where each region contained 50 SNPs with various densities. Of these, 118 regions contained two to 43 genes (or fragments), and 16 regions were nongenic. So, the 134 regions seem to reflect a variety of genomic contexts. Our results are in good agreement with previous evaluations of phasing accuracy, in which several genic regions or synthetic genomes constructed based on a coalescence model were used for diploid reconstruction (Stephens and Donnelly 2003; Stephens and Scheet 2005). Switch errors seem to influence the accuracy of block structure estimation, and tag SNP selection to some extent, but may not seriously reduce efficiency in an association study, as revealed by our simulation experiments (Figs. 5, 6; Supplemental data S5; data not shown).
There is interest in the use of long-range haplotypes to make inferences about natural selection (Sabeti et al. 2002; Bersaglieri et al. 2004), and these long haplotypes would be particularly sensitive to even a low frequency of phasing errors. Comparison of ESHs between CHMs and HapMap sets shows that phasing errors can affect detection of ESHs in some cases (Table 1). Using definitive haplotypes, we mapped ESH regions to detect loci possibly subject to recent natural selection. We found that two genes previously reported as potential targets of positive selection were in ESH peaks, rationalizing this approach for genome-wide identification of candidate loci subject to natural selection. Extending such work to other populations may reveal etiology of population-specific differences in common diseases such as diabetes and hypertension. The results may also be useful for development of population-specific (or personalized) medical interventions.
Recent studies for recombination hot spots as local deficits of LD showed wide divergence between human and chimpanzee genomes (Ptak et al. 2005; Winckler et al. 2005). Jeffreys et al. (2005) showed that some hot spots leave no signature of reduced LD in human. These data suggested that hot spots may be rather transitory in human. If recombination hot spots are formed near disease-causative regions on the responsible allele, association studies using tag SNPs could fail to detect the disease locus. Since the unexpected results of recent studies for hot spots are from small parts of whole human genome, we should need to understand more thoroughly the root causes for fine-scale variation in recombination.
It has been reported that rare variants can considerably contribute to common phenotypes of complex diseases (Pritchard 2001; Cohen et al. 2004), implying the importance of determination of rare haplotype alleles for the association study. Presently, we have determined only major haplotype alleles using common SNPs. We are considering constructing a map to include rare variants, by including less common markers in the analysis.
Methods
DNA samples
CHM samples were collected on a nationwide scale, and the effort was supported by the Japan Association of Obstetricians & Gynecologists. Both the female donors of the CHM tissues and the male partners were Japanese, and their informed consents have been obtained. The project has been approved by the Ethical Committee of Kyushu University. Genomic DNA samples of CHMs were extracted using QIAamp DNA Blood Mini Kit (Qiagen). To determine that the CHM DNA samples were homozygous at all loci without significant maternal contamination, we genotyped 17 microsatellite loci (Kondo et al. 2004). CHMs that were homozygous at all 17 loci were used for SNP genotyping.
Whole genome amplification
For each mole sample, 100 ng of CHM genomic DNA was used as template for amplification with a GenomiPhi DNA Amplification Kit (Amersham Biosciences) according to the manufacturer's protocol. The products were cleaned of nucleotides and salts by ultrafiltration using a Microcon30 Ultrafiltration Device (Millipore). The DNA was recovered in 10 mM Tris-HCl, 0.1 mM EDTA, pH 8.0, and concentration was determined using a PicoGreen dsDNA Assay Kit (Molecular Probes). The average yield of amplified DNA was 46 μg when 100 ng of template DNA was used.
In pilot experiments, we evaluated the effects of amplification on genotyping using Affymetrix Mapping 100K arrays. Using four CHM samples, the average call rates were 99.15% for amplified DNA and 99.34% for unamplified DNA. The overall concordance rate was 99.93%. We concluded that using amplified DNA was a reasonable strategy for whole genome analysis by DNA array assays, confirming previous reports (Paez et al. 2004; Wong et al. 2004).
Genotyping by DNA arrays
The procedures for SNP genotyping with high-density oligonucleotide arrays were as described by Hinds et al. (2005). The SNPs informative among an Asian population were assayed in two array sets. The first set included three chip designs, with a total of 266,722 tiled SNPs, tagging high-LD bins in a European-American population. The second was a supplementary chip containing 91,828 tag SNPs covering additional high-LD bins for a Han Chinese population (Hinds et al. 2005), expecting that these SNPs would also be polymorphic among Japanese.
For genotyping the first set of SNPs, 169 diploid Caucasian samples were analyzed along with the CHM samples. These Caucasian samples had been independently assayed on the same chip designs, and three clusters per SNP for the reference (r), alternate (a), or heterozygous (h) genotypes were determined. Clustering alongside diploid samples enabled an added layer of checks for genotyping quality. The following quality filters were performed for these SNPs: (1) a call rate for mole samples (r + a)/75 ≥ 80%, (2) diploid samples represented in all three genotype clusters, (3) no more than one heterozygous call on the mole samples, (4) at least two mole samples observed with each allele, and (5) a P value for Hardy-Weinberg equilibrium in the diploid samples >10–5. Heterozygote calls on the mole samples were treated as missing data. The Hardy Weinberg filter was intended to eliminate likely cluster assignment errors. Using these criteria, ∼197,000 SNPs were selected for later analysis.
We did not have a large set of diploid sample scans available for the second chip design. In this case, we used a modified haploid clustering algorithm, which allowed a maximum of two genotyping clusters. Our requirements for data quality for these SNPs were: (1) a call rate for mole samples of ≥80%, and (2) at least two mole samples observed with each allele. The overall number of SNPs passing through all quality filters across both SNP sets was 281,561. These genotype data of CHMs were freely available at our Web site (http://orca.gen.kyushu-u.ac.jp/).
Block partition
Construction of haplotype block partitions was done using Hap-Block v30 (Zhang et al. 2002b, 2005; http://www.cmb.usc.edu/msms/HapBlock/). The following parameters were used in all our analyses: The methods for block definition and tag SNP selection were those used in Patil et al. (2001). A set of consecutive SNPs forms a block if the number of common haplotypes accounts for ≥80% of all the observed haplotypes, and the haplotypes represented at >5% are considered as common haplotypes. The minimum set of SNPs that can uniquely distinguish a subset of common haplotypes that can account for ≥80% of all the observed haplotypes is considered as a set of tag SNPs. In the selection of tag SNPs, the minimum frequency for common haplotypes was set to 5%.
Phasing of pseudoindividuals
We constructed 100 sets of pseudoindividuals for each genomic region. This was done by randomly choosing pairs of samples from the selected CHMs without replacement. This was repeated 100 times to produce 100 sets of pseudoindividuals. Phasing for each set was done using PHASE v2.1.1 (Bayesian method with approximate “coalescent with recombination” prior distribution) (Stephens and Scheet 2005; http://www.stat.washington.edu/stephens/software.html).
Extended shared haplotype analysis
We defined ESH regions by comparing all pairs of CHM samples or phased HapMap chromosomes and identifying intervals of consecutive SNPs that were homozygous. Missing genotypes were assumed to match. When unusually large gaps >200 kb were found between adjacent informative SNPs, those gaps were treated as 200 kb regardless of their actual length. This was done to limit the impact of very large sequence gaps such as centromeres.
Acknowledgments
This work was supported by Grants-in-Aid for Scientific Research and Research Revolution 2002 from the Ministry of Education, Culture, Sports, Science and Technology, Japan to K.H. We thank members of the Japan Association of Obstetricians & Gynecologists for their cooperation in collecting mole samples. Some ofthe data included in this article are from The International Hap-Map Project Web sites.
[Supplemental material is available online at www.genome.org.\]
Article and publication are at http://www.genome.org/cgi/doi/10.1101/gr.4371105\. Freely available online through the Genome Research Immediate Open Access option.
References
- Bersaglieri, T., Sabeti, P.C., Patterson, N., Vanderploeg, T., Schaffner, S.F., Drake, J.A., Rhodes, M., Reich, D.E., and Hirschhorn, J.N. 2004. Genetic signatures of strong recent positive selection at the lactase gene. Am. J. Hum. Genet. 74**:** 1111–1120. [DOI] [PMC free article] [PubMed] [Google Scholar]
- Cohen, J.C., Kiss, R.S., Pertsemlidis, A., Marcel, Y.L., McPherson, R., and Hobbs, H.H. 2004. Multiple rare alleles contribute to low plasma levels of HDL cholesterol. Science 305**:** 869–872. [DOI] [PubMed] [Google Scholar]
- Fan, J.B., Surti, U., Taillon-Miller, P., Hsie, L., Kennedy, G.C., Hoffner, L., Ryder, T., Mutch, D.G., and Kwok, P.Y. 2002. Paternal origins of complete hydatidiform moles proven by whole genome single-nucleotide polymorphism haplotyping. Genomics 79**:** 58–62. [DOI] [PubMed] [Google Scholar]
- Gabriel, S.B., Schaffner, S.F., Nguyen, H., Moore, J.M., Roy, J., Blumenstiel, B., Higgins, J., DeFelice, M., Lochner, A., Faggart, M., et al. 2002. The structure of haplotype blocks in the human genome. Science 296**:** 2225–2229. [DOI] [PubMed] [Google Scholar]
- Hinds, D.A., Stuve, L.L., Nilsen, G.B., Halperin, E., Eskin, E., Ballinger, D.G., Frazer, K.A., and Cox, D.R. 2005. Whole-genome patterns of common DNA variation in three human populations. Science 307**:** 1072–1079. [DOI] [PubMed] [Google Scholar]
- The International HapMap Consortium. 2003. The International HapMap Project. Nature 426**:** 789–796. [DOI] [PubMed] [Google Scholar]
- Jeffreys, A.J., Neumann, R., Panayi, M., Myers, S., and Donnelly, P. 2005. Human recombination hot spots hidden in regions of strong marker association. Nat. Genet. 37**:** 601–606. [DOI] [PubMed] [Google Scholar]
- Johnson, G.C.L., Esposito, L., Barratt, B.J., Smith, A.N., Heward, J., Genova, G.D., Ueda, H., Cordell, H.J., Eaves, I.A., Dudbridge, F., et al. 2001. Haplotype tagging for the identification of common disease genes. Nat. Genet. 29**:** 233–237. [DOI] [PubMed] [Google Scholar]
- Ke, X., Hunt, S., Tapper, W., Lawrence, R., Stavrides, G., Ghori, J., Whittaker, P., Collins, A., Morris, A.P., Bentley, D., et al. 2004. The impact of SNP density on fine-scale patterns of linkage disequilibrium. Hum. Mol. Genet. 13**:** 577–588. [DOI] [PubMed] [Google Scholar]
- Kondo, H., Qin, M., Mizota, A., Kondo, M., Hayashi, H., Hayashi, K., Oshima, K., Tahira, T., and Hayashi, K. 2004. A homozygosity-based search for mutations in patients with autosomal recessive retinitis pigmentosa, using microsatellite markers. Invest. Ophthalmol. Vis. Sci. 45**:** 4433–4439. [DOI] [PubMed] [Google Scholar]
- Lin, S., Cutler, D.J., Zwick, M.E., and Chakravarti, A. 2002. Haplotype inference in random population samples. Am. J. Hum. Genet. 71**:** 1129–1137. [DOI] [PMC free article] [PubMed] [Google Scholar]
- Liu, N., Sawyer, S.L., Mukherjee, N., Pakstis, A.J., Kidd, J.R., Kidd, K.K., Brookes, A.J., and Zhao, H. 2004. Haplotype block structures show significant variation among populations. Genet. Epidemiol. 27**:** 385–400. [DOI] [PubMed] [Google Scholar]
- Oota, H., Pakstis, A.J., Bonne-Tamir, B., Goldman, D., Grigorenko, E., Kajuna, S.L., Karoma, N.J., Kungulilo, S., Lu, R.B., Odunsi, K., et al. 2004. The evolution and population genetics of the ALDH2 locus: Random genetic drift, selection, and low levels of recombination. Ann. Hum. Genet. 68**:** 93–109. [DOI] [PubMed] [Google Scholar]
- Paez, J.G., Lin, M., Beroukhim, R., Lee, J.C., Zhao, X., Richter, D.J., Gabriel, S., Herman, P., Sasaki, H., Altshuler, D., et al. 2004. Genome coverage and sequence fidelity of phi29 polymerase-based multiple strand displacement whole genome amplification. Nucleic Acids Res. 32**:** e71. [DOI] [PMC free article] [PubMed] [Google Scholar]
- Patil, N., Berno, A.J., Hinds, D.A., Barrett, W.A., Doshi, J.M., Hacker, C.R., Kautzer, C.R., Lee, D.H., Marjoribanks, C., McDonough, D.P., et al. 2001. Blocks of limited haplotype diversity revealed by high-resolution scanning of human chromosome 21. Science 294**:** 1719–1723. [DOI] [PubMed] [Google Scholar]
- Phillips, M.S., Lawrence, R., Sachidanandam, R., Morris, A.P., Balding, D.J., Donaldson, M.A., Studebaker, J.F., Ankener, W.M., Alfisi, S.V., Kuo, F.S., et al. 2003. Chromosome-wide distribution of haplotype blocks and the role of recombination hot spots. Nat. Genet. 33**:** 382–387. [DOI] [PubMed] [Google Scholar]
- Pritchard, J.K. 2001. Are rare variants responsible for susceptibility to complex diseases? Am. J. Hum. Genet. 69**:** 124–137. [DOI] [PMC free article] [PubMed] [Google Scholar]
- Ptak, S.E., Hinds, D.A., Koehler, K., Nickel, B., Patil, N., Ballinger, D.G., Przeworski, M., Frazer, K.A., and Pääbo, S. 2005. Fine-scale recombination patterns differ between chimpanzees and humans. Nat. Genet. 37**:** 429–434. [DOI] [PubMed] [Google Scholar]
- Sabeti, P.C., Reich, D.E., Higgins, J.M., Levine, H.Z., Richter, D.J., Schaffner, S.F., Gabriel, S.B., Platko, J.V., Patterson, N.J., McDonald, G.J., et al. 2002. Detecting recent positive selection in the human genome from haplotype structure. Nature 419**:** 832–837. [DOI] [PubMed] [Google Scholar]
- Salem, R.M., Wessel, J., and Schork, N.J. 2005. A comprehensive literature review of haplotyping software and methods for use with unrelated individuals. Hum. Genomics 2**:** 39–66. [DOI] [PMC free article] [PubMed] [Google Scholar]
- Steigrad, S.J. 2003. Epidemiology of gestational trophoblastic diseases. Best Pract. Res. Clin. Obstet. Gynaecol. 17**:** 837–847. [DOI] [PubMed] [Google Scholar]
- Stein, L.D., Mungall, C., Shu, S., Caudy, M., Mangone, M., Day, A., Nickerson, E., Stajich, J.E., Harris, T.W., Arva, A., et al. 2002. The generic genome browser: A building block for a model organism system database. Genome Res. 12**:** 1599–1610. [DOI] [PMC free article] [PubMed] [Google Scholar]
- Stephens, M. and Donnelly, P. 2003. A comparison of bayesian methods for haplotype reconstruction from population genotype data. Am. J. Hum. Genet. 73**:** 1162–1169. [DOI] [PMC free article] [PubMed] [Google Scholar]
- Stephens, M. and Scheet, P. 2005. Accounting for decay of linkage disequilibrium in haplotype inference and missing-data imputation. Am. J. Hum. Genet. 76**:** 449–462. [DOI] [PMC free article] [PubMed] [Google Scholar]
- Sun, X., Stephens, J.C., and Zhao, H. 2004. The impact of sample size and marker selection on the study of haplotype structures. Hum. Genom. 1**:** 179–193. [DOI] [PMC free article] [PubMed] [Google Scholar]
- Taillon-Miller, P., Bauer-Sardina, I., Zakeri, H., Hillier, L., Mutch, D.G., and Kwok, P.Y. 1997. The homozygous complete hydatidiform mole: A unique resource for genome studies. Genomics 46**:** 307–310. [DOI] [PubMed] [Google Scholar]
- Winckler, W., Myers, S.R., Richter, D.J., Onofrio, R.C., McDonald, G.J., Bontrop, R.E., McVean, G.A., Gabriel, S.B., Reich, D., Donnelly, P., et al. 2005. Comparison of fine-scale recombination rates in humans and chimpanzees. Science 308**:** 107–111. [DOI] [PubMed] [Google Scholar]
- Wong, K.K., Tsang, Y.T., Shen, J., Cheng, R.S., Chang, Y.M., Man, T.K., and Lau, C.C. 2004. Allelic imbalance analysis by high-density single-nucleotide polymorphic allele (SNP) array with whole genome amplified DNA. Nucleic Acids Res. 32**:** e69. [DOI] [PMC free article] [PubMed] [Google Scholar]
- Zhang, K., Calabrese, P., Nordborg, M., and Sun, F. 2002a. Haplotype block structure and its applications to association studies: Power and study designs. Am. J. Hum. Genet. 71**:** 1386–1394. [DOI] [PMC free article] [PubMed] [Google Scholar]
- Zhang, K., Deng, M., Chen, T., Waterman, M.S., and Sun, F. 2002b. A dynamic programming algorithm for haplotype block partitioning. Proc. Natl. Acad. Sci. 99**:** 7335–7339. [DOI] [PMC free article] [PubMed] [Google Scholar]
- Zhang, K., Qin, Z., Chen, T., Liu, J.S., Waterman, M.S., and Sun, F. 2005. HapBlock: Haplotype block partitioning and tag SNP selection software using a set of dynamic programming algorithms. Bioinformatics 21**:** 131–134. [DOI] [PubMed] [Google Scholar]
Web site references
- http://www.hapmap.org; The International HapMap Project Home page.
- http://orca.gen.kyushu-u.ac.jp/; Kyushu University Definitive Haplotype Database.
- http://www.cmb.usc.edu/msms/HapBlock/; HapBlock program.
- http://www.stat.washington.edu/stephens/software.html; PHASE program.
