Rapid Expression of Human Immunodeficiency Virus following Activation of Latently Infected Cells (original) (raw)
Abstract
The host cell activation state impacts the nature of human immunodeficiency virus infection. Activated cells facilitate productive infections; quiescent cells enable the virus to enter a latent state, the major obstacle to viral clearance. We wanted to understand how these differences affected viral gene expression. In quiescent cells activated prior to infection, viral RNA was seen 12 h postinfection; when cells were stimulated postinfection, viral RNA was not seen until 36 h postinfection. Up-regulation of viral RNA in latently infected cells occurred within 2 h poststimulation. This hierarchy also held true for viral protein production. These results may explain the rapid reemergence of viremia following termination of therapy.
Productive human immunodeficiency virus (HIV) infection of CD4+ T lymphocytes is a highly regulated process that only results when numerous, distinct events in the viral life cycle occur. After viral binding and entry, cellular activation is required for the virus to complete the rest of the infectious cycle. In the absence of sufficient activation, however, HIV replication halts. For example, infection of quiescent CD4+ cells results in the production of a labile, partially reverse-transcribed HIV complex (4, 14, 21, 22). If this cell is stimulated within 3 days after virus entry (18), reverse transcription is rescued and the viral life cycle progresses. This preintegration latency, therefore, can serve as a short-term latent reservoir in vivo.
Postintegration latency results from infection of transcriptionally active CD4+ cells that revert to a quiescent state after virus integration, for example, during the transition from activated to memory T cells (7). Postintegration latency is thought to be stable for more than 60 years (10) and represents the major obstacle to eliminating virus from patients on antiretroviral therapy.
HIV type 1 viral latency was first described in ACH-2 T cells (8). In the absence of stimulation, ACH-2 cells express very little viral RNA due to a mutation in the TAR element of the viral genome (9). It is therefore likely these transcriptionally active, transformed cell lines do not accurately reflect HIV gene expression during latency in primary cells. Nevertheless, exogenous stimulation results in the dramatic up-regulation of viral gene expression and virion production.
Characterization of latency in human patient samples remains difficult due to their very low frequency (less than one latently infected cell per million resting CD4+ cells) (6). To circumvent this problem, we used the SCID-hu mouse model (2, 3, 16, 17). SCID mice were implanted with human fetal liver and thymus tissue, providing the in vivo microenvironment for the genesis and differentiation of human thymocytes. Two key features of this model make it relevant to postintegration latency in HIV-infected patients. First, the majority of immature thymocytes express CD4 and CXCR4 (12) and are highly transcriptionally active, rendering them excellent targets for HIV infection. Second, as these thymocytes mature, they gradually decrease transcription, similar to the circumstances leading to latency in vivo. Thus, SCID-hu-derived thymocytes bear integrated, transcriptionally silent proviruses that are induced to express viral RNA after cell stimulation (3).
To understand viral RNA and protein expression kinetics in different cell activation states, we first studied quiescent primary CD4+ cells stimulated prior to and after HIV infection. We then compared this kinetic to those of stimulated, latently infected (SCID-hu and ACH-2) cells.
Acute infection of CD4+ T lymphocytes.
CD4+ T lymphocytes were isolated from leukopaks by Ficoll-Hypaque density centrifugation and infected with HIV strain NL4-3 (1) for 2 h at a multiplicity of infection of 0.1. The cells were then either stimulated with 4 μg/ml phytohemagglutinin (PHA) plus 20 U/ml interleukin-2 (IL-2) (PHA/IL-2) for 2 days prior to infection (prestimulated) or stimulated with PHA/IL-2 immediately after infection (poststimulated). In both cases, 100 nM indinavir was added to the culture medium after infection to ensure analysis of single-round infections.
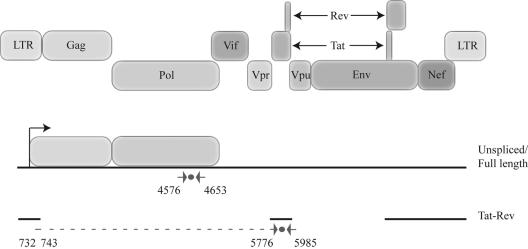
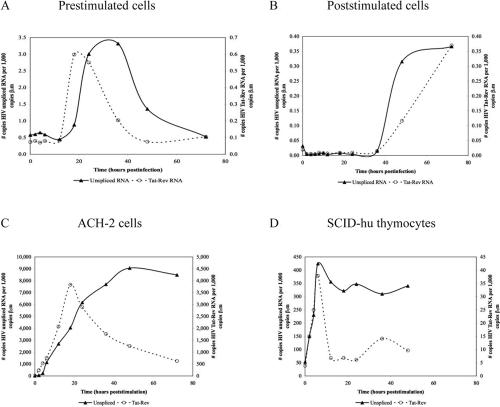
Expression of viral genomic RNA was measured by quantitative real-time reverse transcription (RT)-PCR and compared to in vitro-transcribed RNA standards. We could detect as few as 10 copies of RNA standard in our assay. Primer set “FL” detects only full-length transcripts; primer set “TR” (3) detects only multiply spliced Tat-Rev RNA (i.e., the latest and earliest viral transcripts produced during replication, respectively) (11, 13, 19) (Fig. 1). Prestimulated cells initiated transcription of unspliced RNA approximately 18 h postinfection (Fig. 2A). In contrast, poststimulated cells began producing unspliced RNA approximately 36 h postinfection (Fig. 2B; Table 1); this difference was statistically significant (P = 0.003; Table 1). This same pattern held true for the initiation of Tat-Rev RNA transcription (P < 0.0001). These observations suggest that cell activation prior to virus infection enhances virus replication significantly more than activation after infection.
FIG. 1.
Real-time RT-PCR quantitation of HIV transcripts. Locations and sequences of primers and TaqMan probes used for real-time RT-PCR quantitation of HIV transcripts are shown. Numbers refer to nucleotide positions in the HIV NL4-3 genome. Primer set FL spans nucleotides 4576 to 4653 and picks up full-length unspliced RNA (FL primer/probe sequences: FL sense, 5′-CAATGGCAGCAATTTCACCA-3′; FL antisense, 5′-GAATGCCAAATTCCTGCTTGA-3′; FL probe; CCCACCAACAGGCGGCCTTAACTG). Primer set TR spans nucleotides 732 to 743 and 5776 to 5985 and picks up spliced RNA around the first splice donor site. FL, full length; TR, Tat-Rev; LTR, long terminal repeat.
FIG.2.
RNA production in various infected cells. RNA isolated from infected cells was analyzed by real-time RT-PCR using the FL and TR primers and probes depicted in Fig. 1. RNA data for prestimulated cells (A) are representative of four independent experiments, data for poststimulated cells (B) are representative of three independent experiments, data for ACH-2 cells (C) are representative of three independent experiments, and data for SCID-hu thymocytes (D) are representative of four independent experiments. All values are relative to the RNA copy number of β2-microglobulin, the internal control. As the levels of infection differ for these cell types, the data are plotted on separate axes so that the kinetics may be more easily compared.
TABLE 1.
Viral RNA productiona
| Comparison | RNA type | Mean times to cross threshold (h) | P value | |
|---|---|---|---|---|
| Pre-stim vs. post-stim | Unspliced | 17.95 | 35.94 | 0.0033 |
| Pre-stim vs. ACH-2 | Unspliced | 17.95 | 0.76 | 0.0036 |
| Pre-stim vs. SCID-hu | Unspliced | 17.95 | 3.15 | 0.0009 |
| Post-stim vs. ACH-2 | Unspliced | 35.94 | 0.76 | <0.0001 |
| Post-stim vs. SCID-hu | Unspliced | 35.94 | 3.15 | <0.0001 |
| ACH-2 vs. SCID-hu | Unspliced | 0.76 | 3.15 | NSb |
| Pre-stim vs. post-stim | Tat-Rev | 15.33 | 36.87 | <0.0001 |
| Pre-stim vs. ACH-2 | Tat-Rev | 15.33 | 1.65 | 0.0060 |
| Pre-stim vs. SCID-hu | Tat-Rev | 15.33 | 3.07 | 0.0149 |
| Post-stim vs. ACH-2 | Tat-Rev | 36.87 | 1.65 | 0.0009 |
| Post-stim vs. SCID-hu | Tat-Rev | 36.87 | 3.07 | 0.0020 |
| ACH-2 vs. SCID-hu | Tat-Rev | 1.65 | 3.07 | NS |
HIV latency.
Since latent virus has already progressed through integration, we hypothesized that viral gene expression kinetics may be different from those observed during de novo infection. ACH-2 cells were cultured in the absence (unstimulated) or presence (stimulated) of 2 μg/ml PHA plus 50 ng/ml phorbol-12-myristate-13-acetate (19), both with 10 mM zidovudine and 100 nM indinavir. Production of both unspliced and Tat-Rev RNA began within 2 h of stimulation (Fig. 2C). Thus, RNA production was significantly more rapid than for both pre- and poststimulated cells (Table 1).
We then compared kinetics of the ACH-2 cells with those of latently infected SCID-hu thymocytes. Infected SCID-hu-derived thymocytes were cultured ex vivo under unstimulated or stimulated (PHA/IL-2) conditions. Rapid increases in both unspliced and Tat-Rev RNA production were seen within 2 h of stimulation (Fig. 2D; Table 1). These kinetics were similar to those of ACH-2 cells and also differed significantly from those of prestimulated and poststimulated cells (Table 1).
Viral protein production.
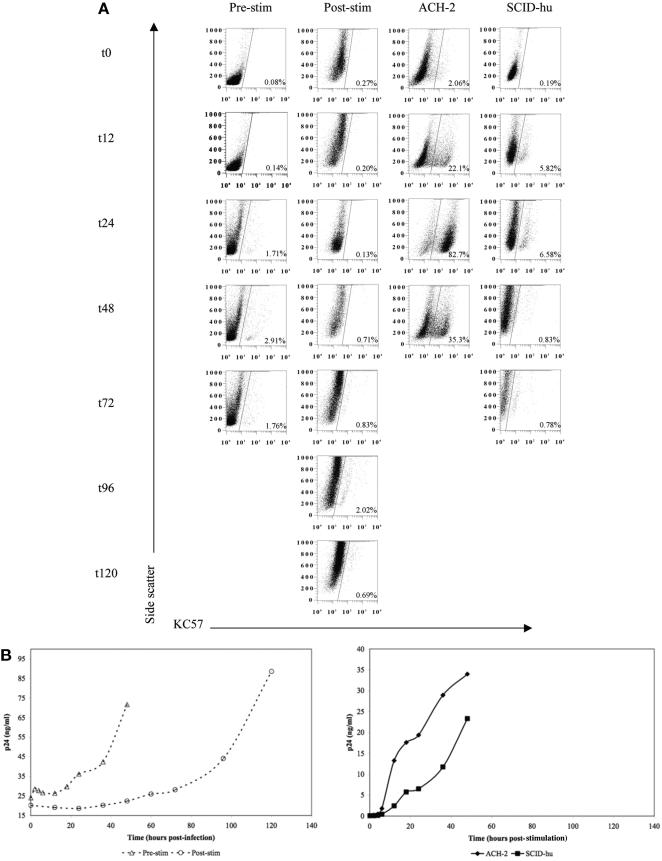
To assess how the differences in RNA kinetics correlated with protein production, we examined the expression of p24 Gag by intracellular staining and enzyme-linked immunosorbent assay of cell supernatants. We observed intracellular Gag accumulation within 12 h following activation of either of the latently infected cell populations (Fig. 3A), indicating rapid translation of the Gag (unspliced) viral RNA. In prestimulated cells, increases in intracellular Gag were not seen until 24 h. Poststimulated cells did not show an increase in intracellular Gag until at least 72 h. This hierarchy of protein production is therefore consistent with the RNA data.
FIG.3.
Comparison of Gag protein production. (A) Intracellular Gag protein production following activation of various cell types. Cells were harvested and stained with antibodies to CD4 (primary lymphocytes) or CD4 and CD45 (SCID-hu thymocytes) to ensure specificity of the infected cell populations. Intracellular staining was performed by membrane permeabilization followed by staining with antibody to the KC57 epitope of p24 Gag. Gates are set based on isotype control antibody staining at each time point. (B) p24 Gag protein production was determined by enzyme-linked immunosorbent assay of infected cell culture supernatants. Left, acutely infected cells (pre- and poststimulation); right, latently infected cells (ACH-2 and SCID-hu). Note that acutely and latently infected cells are plotted on separate y axes. Also note that higher baseline p24 values for acutely infected cells are due to preentry virions adhering to the surface of cells after the de novo infection period.
We also measured the release of p24 into the supernatant. In prestimulated cells, Gag protein did not increase significantly until 18 to 24 h (Fig. 3B, left panel). The increase in poststimulated cells was not seen until 72 h. In contrast, in latently infected cells, Gag protein increased after 6 h (Fig. 3B, right panel). Based on these data, stimulated latently infected cells produced p24 well before acutely infected cells.
We found that RNA transcription occurs relatively early in the mitogenic cycle; in the case of latently infected thymocytes, it occurred within 2 h of stimulation, well before the initiation of cellular DNA synthesis (48 h poststimulation) (3). However, in quiescent cells stimulated after de novo infection, we did not see transcription until 36 h poststimulation. These differences were not due to intrinsic differences in cell activation kinetics, as we have determined that peripheral CD4+ cells and thymocytes respond similarly to stimulation (data not shown). Since HIV requires progression into the G1b stage of the cell cycle to fully complete reverse transcription (14), poststimulated cells must pass through this stage before the virus can be expressed; latent infections do not have this obstacle. Therefore, transcription factors acting early after cell activation can induce the expression of integrated, latent virus.
Previous studies suggested that following activation of latently infected cells, multiply spliced RNA expression precedes unspliced RNA expression and that unspliced viral RNA subsequently becomes the predominant species (11, 19). Our data also indicate that unspliced RNA is expressed at levels approximately 10-fold higher than that of Tat-Rev; however, we observed little temporal difference between the initiation of Tat-Rev and the initiation of unspliced RNA. This apparent disparity may be attributed to the differences in cell types and the detection methodology employed.
At this point, it is unclear what role the cellular antiviral protein APOBEC3G (5, 15, 20, 23) plays in this instance. While APOBEC3G is active in quiescent cells, it becomes inactive once cells enter the G1b phase (5). Our data from poststimulated cells are consistent with a possible APOBEC3G effect; however, additional experiments are needed to confirm this. These data have potentially important clinical implications. Our findings suggest that in vivo, activation of latently infected cells results in the near-instantaneous resumption of the viral life cycle and may contribute to the rapid virus rebound following cessation of therapy.
Acknowledgments
We thank Steven W. Cole for providing statistical analyses.
This work was supported by NIH grants AI36059 and AI36554 to J.A.Z. and NIH/UCLA Microbial Pathogenesis Training Grant T32-AI07323 to P.A.A.
REFERENCES
- 1.Adachi, A., H. E. Gendelman, S. Koenig, T. Folks, R. Willey, A. Rabson, and M. A. Martin. 1986. Production of acquired immunodeficiency syndrome-associated retrovirus in human and nonhuman cells transfected with an infectious molecular clone. J. Virol. 59**:**284-291. [DOI] [PMC free article] [PubMed] [Google Scholar]
- 2.Aldrovandi, G. M., G. Feuer, L. Gao, B. Jamieson, M. Kristeva, I. S. Chen, and J. A. Zack. 1993. The SCID-hu mouse as a model for HIV-1 infection. Nature 363**:**732-736. [DOI] [PubMed] [Google Scholar]
- 3.Brooks, D. G., S. G. Kitchen, C. M. Kitchen, D. D. Scripture-Adams, and J. A. Zack. 2001. Generation of HIV latency during thymopoiesis. Nat. Med. 7**:**459-464. [DOI] [PubMed] [Google Scholar]
- 4.Bukrinsky, M. I., T. L. Stanwick, M. P. Dempsey, and M. Stevenson. 1991. Quiescent T lymphocytes as an inducible virus reservoir in HIV-1 infection. Science 254**:**423-427. [DOI] [PMC free article] [PubMed] [Google Scholar]
- 5.Chiu, Y. L., V. B. Soros, J. F. Kreisberg, K. Stopak, W. Yonemoto, and W. C. Greene. 2005. Cellular APOBEC3G restricts HIV-1 infection in resting CD4+ T cells. Nature 435**:**108-114. [DOI] [PubMed] [Google Scholar]
- 6.Chun, T. W., L. Carruth, D. Finzi, X. Shen, J. A. DiGiuseppe, H. Taylor, M. Hermankova, K. Chadwick, J. Margolick, T. C. Quinn, Y. H. Kuo, R. Brookmeyer, M. A. Zeiger, P. Barditch-Crovo, and R. F. Siliciano. 1997. Quantification of latent tissue reservoirs and total body viral load in HIV-1 infection. Nature 387**:**183-188. [DOI] [PubMed] [Google Scholar]
- 7.Chun, T. W., D. Finzi, J. Margolick, K. Chadwick, D. Schwartz, and R. F. Siliciano. 1995. In vivo fate of HIV-1-infected T cells: quantitative analysis of the transition to stable latency. Nat. Med. 1**:**1284-1290. [DOI] [PubMed] [Google Scholar]
- 8.Clouse, K. A., D. Powell, I. Washington, G. Poli, K. Strebel, W. Farrar, P. Barstad, J. Kovacs, A. S. Fauci, and T. M. Folks. 1989. Monokine regulation of human immunodeficiency virus-1 expression in a chronically infected human T cell clone. J. Immunol. 142**:**431-438. [PubMed] [Google Scholar]
- 9.Emiliani, S., C. Van Lint, W. Fischle, P. Paras, Jr., M. Ott, J. Brady, and E. Verdin. 1996. A point mutation in the HIV-1 Tat responsive element is associated with postintegration latency. Proc. Natl. Acad. Sci. USA 93**:**6377-6381. [DOI] [PMC free article] [PubMed] [Google Scholar]
- 10.Finzi, D., J. Blankson, J. D. Siliciano, J. B. Margolick, K. Chadwick, T. Pierson, K. Smith, J. Lisziewicz, F. Lori, C. Flexner, T. C. Quinn, R. E. Chaisson, E. Rosenberg, B. Walker, S. Gange, J. Gallant, and R. F. Siliciano. 1999. Latent infection of CD4+ T cells provides a mechanism for lifelong persistence of HIV-1, even in patients on effective combination therapy. Nat. Med. 5**:**512-517. [DOI] [PubMed] [Google Scholar]
- 11.Kim, S. Y., R. Byrn, J. Groopman, and D. Baltimore. 1989. Temporal aspects of DNA and RNA synthesis during human immunodeficiency virus infection:evidence for differential gene expression. J. Virol. 63**:**3708-3713. [DOI] [PMC free article] [PubMed] [Google Scholar]
- 12.Kitchen, S. G., C. H. Uittenbogaart, and J. A. Zack. 1997. Mechanism of human immunodeficiency virus type 1 localization in CD4-negative thymocytes: differentiation from a CD4-positive precursor allows productive infection. J. Virol. 71**:**5713-5722. [DOI] [PMC free article] [PubMed] [Google Scholar]
- 13.Klotman, M. E., S. Kim, A. Buchbinder, A. DeRossi, D. Baltimore, and F. Wong-Staal. 1991. Kinetics of expression of multiply spliced RNA in early human immunodeficiency virus type 1 infection of lymphocytes and monocytes. Proc. Natl. Acad. Sci. USA 88**:**5011-5015. [DOI] [PMC free article] [PubMed] [Google Scholar]
- 14.Korin, Y. D., and J. A. Zack. 1998. Progression to the G1b phase of the cell cycle is required for completion of human immunodeficiency virus type 1 reverse transcription in T cells. J. Virol. 72**:**3161-3168. [DOI] [PMC free article] [PubMed] [Google Scholar]
- 15.Mangeat, B., P. Turelli, G. Caron, M. Friedli, L. Perrin, and D. Trono. 2003. Broad antiretroviral defence by human APOBEC3G through lethal editing of nascent reverse transcripts. Nature 424**:**99-103. [DOI] [PubMed] [Google Scholar]
- 16.McCune, J. M., R. Namikawa, H. Kaneshima, L. D. Shultz, M. Lieberman, and I. L. Weissman. 1988. The SCID-hu mouse: murine model for the analysis of human hematolymphoid differentiation and function. Science 241**:**1632-1639. [DOI] [PubMed] [Google Scholar]
- 17.Namikawa, R., K. N. Weilbaecher, H. Kaneshima, E. J. Yee, and J. M. McCune. 1990. Long-term human hematopoiesis in the SCID-hu mouse. J. Exp. Med. 172**:**1055-1063. [DOI] [PMC free article] [PubMed] [Google Scholar]
- 18.Pierson, T. C., Y. Zhou, T. L. Kieffer, C. T. Ruff, C. Buck, and R. F. Siliciano. 2002. Molecular characterization of preintegration latency in human immunodeficiency virus type 1 infection. J. Virol. 76**:**8518-8531. [DOI] [PMC free article] [PubMed] [Google Scholar]
- 19.Pomerantz, R. J., D. Trono, M. B. Feinberg, and D. Baltimore. 1990. Cells nonproductively infected with HIV-1 exhibit an aberrant pattern of viral RNA expression: a molecular model for latency. Cell 61**:**1271-1276. [DOI] [PubMed] [Google Scholar]
- 20.Sheehy, A. M., N. C. Gaddis, J. D. Choi, and M. H. Malim. 2002. Isolation of a human gene that inhibits HIV-1 infection and is suppressed by the viral Vif protein. Nature 418**:**646-650. [DOI] [PubMed] [Google Scholar]
- 21.Stevenson, M., T. L. Stanwick, M. P. Dempsey, and C. A. Lamonica. 1990. HIV-1 replication is controlled at the level of T cell activation and proviral integration. EMBO J. 9**:**1551-1560. [DOI] [PMC free article] [PubMed] [Google Scholar]
- 22.Zack, J. A., S. J. Arrigo, S. R. Weitsman, A. S. Go, A. Haislip, and I. S. Chen. 1990. HIV-1 entry into quiescent primary lymphocytes: molecular analysis reveals a labile, latent viral structure. Cell 61**:**213-222. [DOI] [PubMed] [Google Scholar]
- 23.Zhang, H., B. Yang, R. J. Pomerantz, C. Zhang, S. C. Arunachalam, and L. Gao. 2003. The cytidine deaminase CEM15 induces hypermutation in newly synthesized HIV-1 DNA. Nature 424**:**94-98. [DOI] [PMC free article] [PubMed] [Google Scholar]


