Bidirectional plasticity of excitatory postsynaptic potential (EPSP)-spike coupling in CA1 hippocampal pyramidal neurons (original) (raw)
Abstract
Integration of synaptic excitation to generate an action potential (excitatory postsynaptic potential-spike coupling or E-S coupling) determines the neuronal output. Bidirectional synaptic plasticity is well established in the hippocampus, but whether active synaptic integration can display potentiation and depression remains unclear. We show here that synaptic depression is associated with an _N_-methyl-d-aspartate receptor-dependent and long-lasting depression of E-S coupling. E-S depression is input-specific and is expressed in the presence of γ-aminobutyric acid type A and B receptor antagonists. In single neurons, E-S depression is observed without modification of postsynaptic passive properties. We conclude that a decrease in intrinsic excitability underlies E-S depression and is synergic with glutamatergic long-term depression.
Integration of synaptic inputs to produce an action potential at the axon hillock is a complex operation that depends on two critical factors: the distribution of voltage-gated ion channels in the dendrites and the passive electrical properties upon which these active channels are superimposed (1). Synaptic potentials have been shown to be shaped by intrinsic voltage-gated conductances located in the dendrites and the soma (2), but the dynamics of active synaptic integration remains poorly understood. We addressed here the question as to whether synaptic integration is modified after induction of long-term synaptic potentiation and depotentiation.
In the area CA1, homosynaptic long-term potentiation (LTP) of excitatory synaptic transmission is induced by high-frequency stimulation (HFS, 100 Hz) of the afferent fibers (3). In parallel, the probability of discharge of the postsynaptic neurons in response to a given excitatory postsynaptic potential (EPSP) is enhanced (4–7). This second component has been called EPSP-to-Spike potentiation (E-S potentiation, E-S P) which is complementary to LTP and functionally important. The reversal of LTP preserves a potential for network plasticity and appears essential for any model of memory (8). Long-term synaptic depotentiation has been reported in the area CA1 (9), but the reversal of E-S P has never been clearly established (10, 11). We show here that E-S depression (E-S D) is expressed concomitantly with long-term depression (LTD). E-S D is largely independent of synaptic inhibition but requires _N_-methyl-d-aspartate (NMDA) receptor (NMDAR) activation for its induction. We provide evidence for an activity-dependent decrease of the intrinsic excitability of CA1 pyramidal neurons that acts in synergy with LTD.
Methods
Slice Preparation.
Hippocampal slices (400 μm) were obtained from 3- to 6-week-old rats according to institutional guidelines. Slices were cut in a solution (280 mM sucrose/26 mM NaHCO3/10 mM d-glucose/1.3 mM KCl/1 mM CaCl2/10 mM MgCl2), and were maintained for 1 h at room temperature in oxygenated (95% O2/5% CO2) artificial cerebrospinal fluid (ACSF; 125 mM NaCl/2.5 mM KCl/0.8 mM NaH2PO4/26 mM NaHCO3/3 mM CaCl2/2 mM MgCl2/10 mM d-glucose). Each slice was transferred to a temperature-controlled (34°C) recording chamber with oxygenated ACSF. Neurons were visualized by using differential interference contrast infrared-videomicroscopy. When the γ-aminobutyric acid type A (GABAA) channel blocker, picrotoxin (PTX) was bath-applied, the area CA1 was surgically isolated.
Electrophysiology.
Field-potentials were recorded in the stratum pyramidale or in the stratum radiatum by using glass microelectrodes filled with 3 M NaCl. CA1 pyramidal neurons were either impaled with 0.5 M potassium methylsulfate-filled sharp electrodes or whole-cell recorded with pipettes containing 120 mM K-gluconate, 20 mM KCl, 10 mM Hepes, 10 mM EGTA, 2 mM MgCl26H2O, and 2 mM Na2ATP. Glass stimulating electrodes filled with extracellular saline were placed in the stratum radiatum. Stimuli (0.1- to 0.15-ms duration) of 0.1–3 mA were delivered at 0.3 Hz for baseline measurements. LTP was induced with 10 bursts of 10 shocks at 100 Hz. The bursts were delivered at 0.3 Hz. LTD and depotentiation were induced with continuous shocks delivered at 3 Hz for 3 min or 1 Hz for 15 min (12, 13). Before and after each tetanus, E-S coupling was explored by progressively lowering the stimulus intensity from the test value to 0 mA. Drugs were bath applied. PTX and kynurenic acid were purchased from Sigma, d-AP5 (d(-)-2-amino-5-phosphonopentanoic acid) was purchased from Tocris Cookson (St. Louis), and CGP62349 was a gift of Novartis Pharma (Basel).
Data Acquisition and Analysis.
Analog signals were filtered at 3 kHz, and acquisition of 400-ms sequences were performed at a digitization rate of 12 kHz (ACQUIS1, G. Sadoc, Centre National de la Recherche Scientifique). Ten traces at each stimulus intensity were averaged and population EPSP slopes and population spike (PS) amplitudes were measured. E-S coupling changes were quantified by the normalized PS amplitude for a given EPSP slope (bin size of 0.05 mV/ms). Data from EPSP slopes <0.03 mV/ms were not kept for analysis. The value of E-S coupling obtained for each slice was calculated by averaging the normalized PS amplitude corresponding to each class of EPSP slope. For single-cell recordings, EPSP slopes were measured during the first 2 ms, sorted in 0.2–0.4 mV/ms bins, and the firing probability was determined for each bin. Data are presented as mean ± SE and were compared with the Mann–Whitney U test.
Results
Reversal of E-S P.
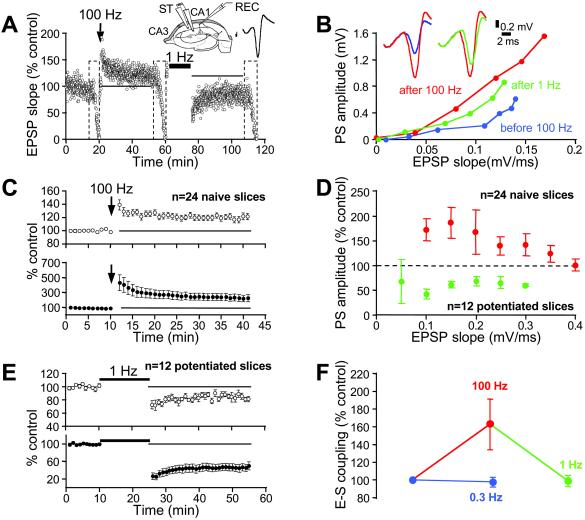
In naive slices, HFS induced LTP (Fig. 1A; 120 ± 4%, n = 24), and was accompanied by a potentiation of the PS amplitude to 240 ± 44% (Fig. 1 B and C). To test E-S coupling, input–output curves were compared before and after HFS. The PS amplitude evoked by a given EPSP was larger after HFS, therefore attesting to E-S P (Fig. 1D; 165 ± 18%, n = 24). In 12 of these slices, low-frequency stimulation (LFS; 1 Hz) was applied after stabilization of LTP (Fig. 1A). The depotentiation to 83 ± 3% was accompanied by a decrease of the PS amplitude to 44 ± 6% (n = 12; Fig. 1E). E-S depotentiation was consistently observed at different EPSP slopes (Fig. 1D). On average, E-S depotentiation amounted to 61 ± 6%, thus restoring the initial level of E-S coupling (Fig. 1F). E-S depotentiation was also induced by a 3 Hz stimulation (58 ± 9%, n = 5), showing that E-S P in the area CA1 is reversible by 1- to 3-Hz stimulation. Temporal stability of E-S coupling was demonstrated by comparing the coupling in naive slices, 30 min apart (Fig. 1F). We conclude that LFS reverses E-S P.
Fig 1.
Reversal of E-S P. (A) Time course of the normalized EPSP slope after HFS (100 Hz) and LFS (1 Hz) in a representative slice. (Inset) Recording configuration. Dashed areas correspond to the test of E-S coupling. The stimulus intensity was restored to its initial value for tetani and EPSP-slope measurements. (B) Associated changes in E-S coupling. Blue, red, and green curves, E-S coupling before, after HFS tetanus and after LFS, respectively. After HFS, a given EPSP slope evoked a larger PS (superimposed blue and red traces). After LFS a given EPSP slope evoked a smaller PS (superimposed red and green traces). (C) Pooled data of the effect of HFS on the EPSP slope (○) and PS amplitude (•). (D) Normalized PS amplitude after induction of potentiation (red) and depotentiation (green). (E) Pooled data of the effect of LFS on EPSP slope (○) and PS amplitude (•). (F) Summary of E-S changes after HFS and LFS (P < 0.001 and _P_ < 0.002). E-S coupling remained unchanged if the stimulus frequency was 0.3 Hz (blue line, _P_ > 0.1).
E-S D in Naive Slices.
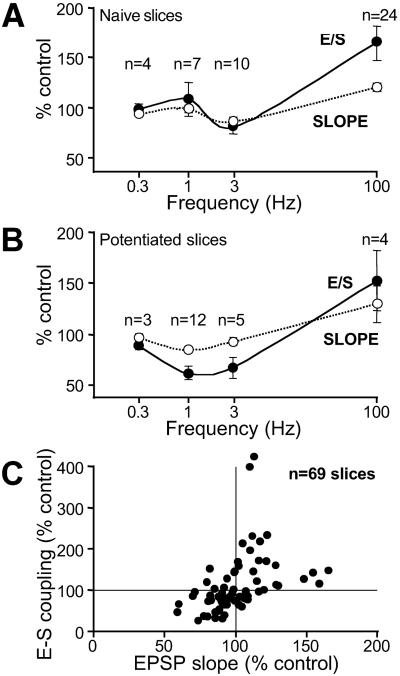
Can E-S D be induced in naive slices? Significant LTD and E-S D were induced by 3 Hz stimuli (81 ± 7% of the control coupling, n = 8; P < 0.02) but not by 1 Hz (106 ± 16%, _n_ = 7; _P_ > 0.6), indicating that E-S D in naive slices is less prominent than in potentiated slices (Fig. 2). This depression is unlikely to result from a nonspecific alteration of intrinsic excitability because HFS induced E-S de-depression (145 ± 16%, n = 8).
Fig 2.
Synergic expression of synaptic and E-S plasticity. (A and B) Changes in EPSP slope and E-S coupling as a function of the tetanus frequency in naive (A) and potentiated (B) slices. (C) Plot of E-S plasticity versus synaptic plasticity in all slices.
What is the nature of the relationship between the induced changes in E-S coupling and synaptic efficacy? As previously shown (9), synaptic strength vs. the tetanus frequency described two-threshold curves for both naive (Fig. 2A) and potentiated slices (Fig. 2B). Normalized changes in E-S coupling and synaptic strength had homothetic profiles (Fig. 2 A and B). Moreover, E-S P was found to occur when the EPSP was potentiated and E-S D was concomitant with synaptic depression (Fig. 2C). We conclude that E-S D is synergic with synaptic depression.
E-S Plasticity and Synaptic Inhibition.
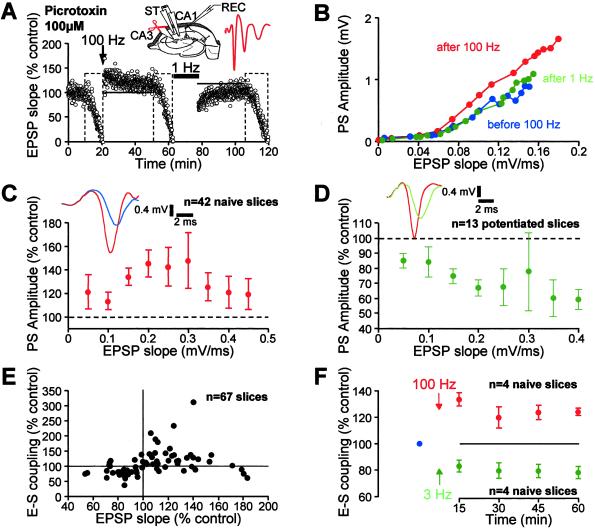
An imbalance between excitation and inhibition has been proposed to account for E-S P (6, 14, 15). However, other studies reported GABAA receptor-independent E-S P, suggesting a long-term potentiation of intrinsic excitability (16–18). We therefore reexamined this question for both E-S P and E-S D. Significant E-S P was still induced when the HFS was applied in the presence of PTX (100 μM; 128 ± 7%, P < 0.001, n = 42; Fig. 3 A_–_C). The amount of E-S P obtained in these conditions was however weaker than that obtained without PTX (P < 0.02), indicating that E-S P has two components: a PTX-sensitive and a PTX-resistant component that represents ≈40% of E-S P.
Fig 3.
E-S P and E-S D in the presence of PTX. (A) Time-course of the synaptic potentiation and depotentiation in a representative slice. (B) Associated changes in the E-S coupling in this slice. (C and D) Pooled data for E-S P (C) and E-S depotentiation (D). (Insets) Representative potentials showing E-S P (superimposed blue and red traces) and E-S depotentiation (superimposed red and green traces). (E) E-S plasticity as a function of synaptic plasticity in potentiated and naive slices recorded in the presence of PTX. (F) Time course of E-S P (red) and E-S D (green) induced by 100 and 3 Hz tetani.
Additional experiments were performed to examine whether E-S depotentiation could still be induced in the presence of PTX. LFS induced a significant E-S depotentiation (75 ± 4%, n = 13 with a 1 Hz stimulation (Fig. 3 B and D) and 86 ± 8%, n = 6 with a 3 Hz stimulation), but its magnitude was on average smaller than that obtained in control ACSF (Fig. 3D). We conclude that E-S D also exhibits two components: a GABAA receptor-dependent and a GABAA receptor-independent component. The second component accounted for ≈40%. Similarly to the previous results (Fig. 2C), E-S P and E-S D were observed at potentiated and depressed inputs, respectively (Fig. 3E). PTX was applied systematically in the subsequent experiments.
A significant E-S P was induced by HFS in the presence of PTX and 2 μM of the GABAB receptor antagonist, CGP62349 (117 ± 5%, n = 6). E-S depotentiation was also observed after 1 Hz stimulation (83 ± 3%, n = 6). These values were similar to those observed in the presence of PTX alone, indicating that the expression of the second component of E-S plasticity does not depend on GABAB receptor-mediated inhibition.
To rule out a possible contamination of E-S coupling by early spikes when EPSP slope was measured at the cell body layer, E-S P and E-S depotentiation were assessed with EPSP measured in the radiatum and the spike in the cell body layer (Fig. 7, which is published as supporting information on the PNAS web site, www.pnas.org). In the presence of PTX, E-S P and E-S depotentiation induced by HFS and LFS (respectively 139 ± 11% and 87 ± 5%, n = 4) were virtually identical to those previously measured.
Time Course of E-S P and E-S D.
LTP and LTD are rapidly expressed and persist from several tens of minutes to hours (3). Some forms of activity-dependent long-term modification of excitability have been shown to be expressed only after 24 h (19). We therefore determined the time-course of E-S P and E-S D by testing E-S coupling every 15 min. E-S P was expressed rapidly after the HFS, but exhibited a short-term increase and a stable plateau (Fig. 3F). E-S D was expressed within 15 min and remained stable over 60 min (Fig. 3F). Thus, E-S P and E-S D are rapidly expressed and are long-lasting forms of plasticity.
E-S Plasticity in Single CA1 Pyramidal Cells.
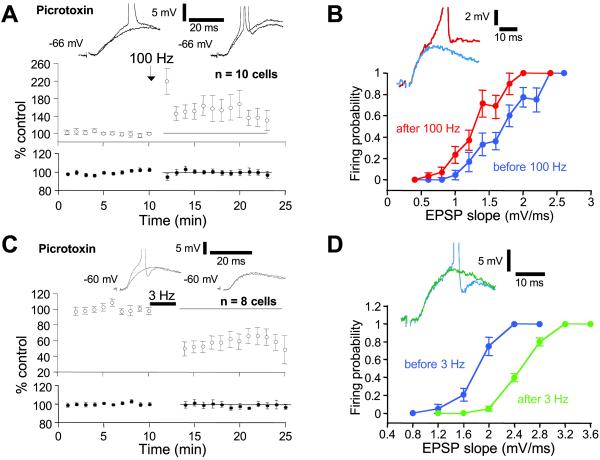
In field potential recordings, the membrane potential and input resistance of CA1 pyramidal neurons are not controlled. These parameters could be affected when excitability is apparently changed. We therefore examined whether E-S plasticity was obtained in single neurons recorded intracellularly or in the whole-cell configuration. The stimulus intensity was usually high to elicit APs by evoked EPSPs. However, E-S coupling could not be assessed satisfactorily in 5 of 18 neurons before or after the tetani. Particular care was taken to assess the stability of the recording. Resting membrane potential was maintained at a constant level (±0.5 mV) with small holding currents (<100 pA). HFS of the presynaptic fibers induced LTP (154 ± 19%, n = 10; Fig. 4A). In parallel, the firing probability in response to EPSPs of a given slope was enhanced (Fig. 4B), attesting to the induction of E-S P (152 ± 30%, n = 7 cells). No change in input resistance was observed after induction of E-S P (100 ± 5%, n = 7).
Fig 4.
E-S P and E-S D in single CA1 pyramidal cells. All experiments were performed in the presence of PTX. (A) Time course of LTP induced by HFS (○) and input resistance (•). (B) Firing probability as a function of EPSP slope before (blue) and after (red) LTP induction in one of these neurons (see superimposed traces). (C) Time course of LTD induced by LFS (○) and input resistance (•). (D) Firing probability as a function of the EPSP slope before (blue) and after (green) LTD induction in one of these neurons. The firing probability for a given EPSP slope decreased after LFS (see superimposed traces).
LFS at 3 Hz induced LTD (74 ± 11% n = 8; Fig. 4C). When measurable, a decrease in the firing probability in response to EPSPs of a given slope (Fig. 4D) was observed concomitantly to LTD induction (85 ± 12% of the control coupling, n = 6). No change in input resistance was observed after induction of E-S D (97 ± 3%, n = 6). We conclude that nonspecific changes in passive properties are not involved in E-S plasticity but rather that regulation of voltage-gated conductances in CA1 neurons may underlie E-S P and E-S D.
Input Specificity.
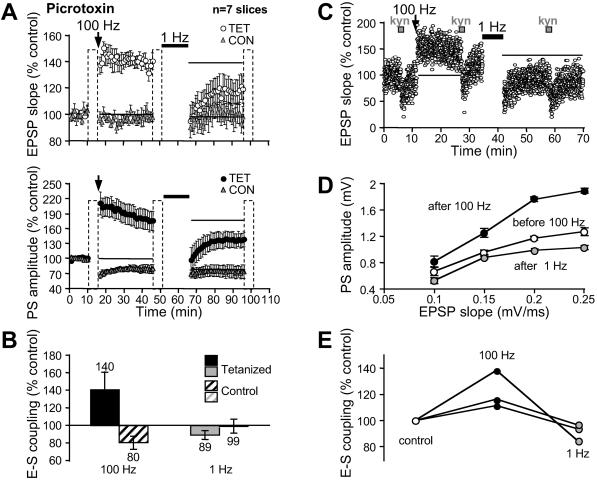
LTP and LTD are input-specific, leaving a large potential for plasticity of other inputs. This level of functional and spatial resolution would be dramatically decreased if E-S changes were generalized to other synapses. Two independent pathways were used to study the specificity of E-S P and E-S D. One pathway was tetanized, whereas the other was kept silent during HFS and LFS (Fig. 5A and Fig. 8, which is published as supporting information on the PNAS web site). HFS was found to induce E-S P at the tetanized pathway (140 ± 20%) but heterosynaptic E-S D at the control pathway (80 ± 7%, n = 7; Fig. 5B). After LFS, E-S depotentiation was observed at the stimulated pathway but not at the control pathway (89 ± 5% vs. 99 ± 8%, n = 7). We conclude that E-S P and E-S depotentiation are input-specific.
Fig 5.
E-S plasticity is input-specific. (A) EPSP slope and PS amplitude versus time in the tetanized (○, •, TET) and the control pathway (gray triangle, CON). (B) Pooled changes in E-S coupling for each pathway. (C_–_E) Assay of E-S coupling with constant stimulus strength in the presence of PTX. (C) Time course of EPSP changes in a slice. Kynurenate (kyn, 400 μM) was applied before and after each tetanus. (D) E-S P and E-S depotentiation in the experiment illustrated in C. (E) Summary of E-S changes in 3 slices.
In all of the previous experiments, E-S coupling was tested by varying the stimulus intensity to compensate the induced synaptic changes. In these conditions, the dendritic pattern of synaptic excitation may differ before and after tetanization. Local changes in the dendritic depolarization may interfere with postsynaptic excitation. To rule out this possibility, E-S plasticity was assessed at constant stimulus intensity by brief blockade of α-amino-3-hydroxy-5-methyl-4-isoxazolepropionic acid (AMPA)/NMDA receptors with kynurenate (400 μM, 90 s; Fig. 5C). Kynurenate allowed the exploration of the E-S coupling from ≈50 to 100% of the maximal EPSP slope. E-S P and E-S depotentiation were induced after HFS and LFS (respectively, 122 ± 8% and 76 ± 8% n = 3; Fig. 5 D and E). The values were similar to those measured by varying the stimulus intensity (P > 0.8 and P > 0.9), indicating that E-S plasticity is also observed when the synaptic changes are solely compensated by an action on postsynaptic receptors.
Induction of E-S P and E-S Depotentiation Requires NMDAR Activation.
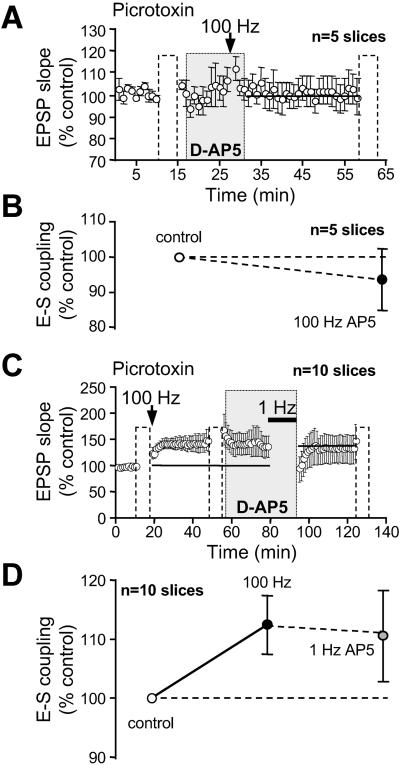
LTP and LTD in area CA1 requires NMDAR activation (20). We therefore investigated its role in the induction of E-S P and E-S depotentiation. Neither LTP (99 ± 5%, n = 5; Fig. 6A) nor E-S P (94 ± 9%, Fig. 6B) were induced when HFS was applied in the presence of the NMDAR antagonist d-AP5. In the same slices, HFS applied 40 min after washout of d-AP5 induced both LTP and E-S P (127 ± 9% and 132 ± 12%, respectively).
Fig 6.
Induction of E-S P and E-S depotentiation requires NMDAR activation. (A and B) d-AP5 (100 μM) blocked LTP induction and E-S P. (C) LTP was first induced by HFS. d-AP5 (100 μM) was applied 20 min before and during 1 Hz stimulation and prevented synaptic depotentiation. (D) Summary of induced changes in E-S coupling.
We found that E-S depotentiation also required the activation of NMDARs. When LFS was applied in the presence of d-AP5, neither synaptic depotentiation (92 ± 5%, n = 10; P > 0.01; Fig. 6C) nor E-S depotentiation (101 ± 10%, n = 10, P > 0.1; Fig. 6D) were observed. These results were in clear contrast with the depotentiation (80 ± 5%, n = 7) and E-S depotentiation (74 ± 3%, n = 7) observed after LFS (1 Hz) in the absence of d-AP5. We therefore conclude that activation of NMDAR is required for the induction of E-S P and E-S depotentiation.
Discussion
We show that E-S D is expressed in the area CA1 when LTD is induced homosynaptically. This question has been addressed previously by using only indirect recording techniques, and induction of E-S P with 1 Hz tetani was reported, because LTD was apparently overestimated, as a result of a poor definition of the EPSP (10). These results were not confirmed by subsequent studies (11) and appeared paradoxical for information processing because LTD apparently accompanied an increase in the probability of discharge. We demonstrate here that E-S D is observed concomitantly with the expression of synaptic depression or depotentiation. In potentiated slices, E-S depotentiation was consistently induced by 1 and 3 Hz stimuli. Synaptic and E-S changes were found to be correlated, suggesting that both the synaptic strength and the input–output function of the neuron changed synergistically.
Contradictory conclusions have been drawn regarding the contribution of GABAA receptor-mediated inhibition to hippocampal E-S P. Early studies argued that E-S P was abolished by GABAA channel blockers (6, 14), whereas others reported a PTX-resistant E-S P (16, 17). These later results suggested that in addition to an imbalance between excitation and inhibition, intrinsic changes in excitability might have also been induced (21). Our results are consistent with the presence of a PTX-sensitive and a PTX-resistant component in E-S P. This second component was independent of GABAB receptors, was expressed at constant membrane potential and input resistance, and could also be observed without any change in the pattern of dendritic activation. We evaluate this last component as ≈40% of the total change, indicating that in control ACSF a substantial fraction of E-S P is mediated by modifications of intrinsic excitability. A mirror conclusion can be drawn for E-S D. Although weaker, E-S D and E-S depotentiation were consistently induced in the presence of GABAA-channel blockers. We therefore conclude that a relative imbalance between synaptic excitation and inhibition on one hand, and an intrinsic decrease in excitability on the other hand, account for the expression of E-S D. This last component represents ≈40% of total E-S D. In other brain areas, tetanus-induced increases in intrinsic excitability are also independent of inhibitory synaptic transmission (22, 23).
Persistent potentiation of neuronal excitability is observed after postsynaptic depolarization (24), receptor stimulation (25), or when a synaptic pathway is tetanized (22, 23). These changes in excitability could be implicated in learning and memory because increases in neuronal excitability are reported in hippocampal and cerebellar neurons after classical conditioning (26, 27). In invertebrates, bidirectional changes in excitability are induced concomitantly with sensitization and habituation (28). The present study provides, however, the first indication for activity-dependent bidirectional plasticity in the neuronal excitability of central mammalian neurons.
What is the relationship between synaptic plasticity and intrinsic plasticity? In CA1 hippocampal cells (5–7) and granule cells (23), a parallel potentiation of synaptic efficacy and excitability has been reported after HFS of glutamatergic inputs. We report here that LTD is associated with the induction of E-S D. In contrast to some forms of intrinsic plasticity (19), E-S plasticity was rapidly induced. E-S plasticity was also long-lasting, therefore indicating that it may be functionally as important as synaptic plasticity and could also contribute to engram formation.
Homosynaptic LTD and depotentiation in the area CA1 requires NMDAR activation. E-S depotentiation was not induced under NMDAR blockade, suggesting a common induction pathway between synaptic and E-S depotentiation. Calcium entry through NMDAR could therefore represent the first induction signal. Further studies will be required to identify the nature of the ionic conductances that undergo long-term regulation, though those shaping the EPSP (A-type K+, persistent Na+, … ) are possible candidates.
How might alterations of the intrinsic excitability of CA1 cell dendrites contribute to information storage in the hippocampus? Theoretical studies have shown that bidirectional synaptic plasticity is crucial for memory formation (8). We show here that changes in excitability accompany modifications in synaptic efficacy and therefore follow the Bienenstock, Cooper, and Munrow rule (29). E-S P and E-S depotentiation were found to be specific to the stimulated pathway, suggesting that the underlying changes in intrinsic excitability are probably restricted to the active dendritic area (30). Thus, the input specificity conferred by synaptic efficacy is respected and the functional contrast between active and inactive synaptic inputs is not subsequently altered by modifications in the intrinsic excitability. E-S P was consistently associated with heterosynaptic E-S D that could further enhance the input specificity. It may result from a nonspecific decrease in excitability of the surrounding dendritic membrane (D. Fricker and D. Johnston, personal communication), but its characterization would require further studies. Our results indicate that selective increases and decreases in intrinsic excitability could potentially complement input-specific modifications in synaptic strength to give rise to a flexible and informationally enriched engram.
Supplementary Material
Supporting Figures
Acknowledgments
We thank L. Fronzaroli and N. Ferrand for technical assistance; Drs. E. Carlier, D. Kullmann, Y. Frégnac, B. H. Gähwiler, M. Scanziani, and V. Sourdet for discussions; and Drs. T. V. P. Bliss, S. H. R. Oliet, and M. Seagar for constructive criticisms. This work was supported by CG13, Fondation pour la Recherche Médicale, Ministry of Research (Actions Concertées Incitatives Jeunes Chercheurs), and Institut National de la Santé et de la Recherche Médicale (Avenir).
Abbreviations
- LTP, long-term potentiation
- LTD, long-term depression
- NMDA, _N-_methyl-d-aspartate
- HFS, high-frequency stimulation
- LFS, low-frequency stimulation
- ACSF, artificial cerebrospinal fluid
- NMDAR, NMDA receptor
- EPSP, excitatory postsynaptic potential
- E-S, EPSP-spike
- E-S D, E-S depression
- E-S P, E-S potentiation
- GABAA, γ-aminobutyric acid type A
- GABAB, γ-aminobutyric acid type B
- PTX, picrotoxin
References
- 1.Spruston N., Jaffe, D. B. & Johnston, D. (1994) Trends Neurosci. 17**,** 161-166. [DOI] [PubMed] [Google Scholar]
- 2.Magee J. F. (2000) Nat. Rev. Neurosci. 1**,** 181-190. [DOI] [PubMed] [Google Scholar]
- 3.Bliss T. V. P. & Lømo, T. (1973) J. Physiol. (London) 232**,** 331-356. [DOI] [PMC free article] [PubMed] [Google Scholar]
- 4.Bliss T. V. P., Lømo, T. & Gardner-Medwin, A. R. (1973) in Macromolecules and Behaviour, eds. Ansell, G. & Bradley, P. B. (MacMillan, London), pp. 193–203.
- 5.Andersen P., Sundberg, S. H., Sveen, O., Swann, J. W. & Wigström, H. (1980) J. Physiol. (London) 302**,** 463-482. [DOI] [PMC free article] [PubMed] [Google Scholar]
- 6.Abraham W., Gustafsson, B. & Wigstrom, H. (1987) J. Physiol. (London) 394**,** 367-380. [DOI] [PMC free article] [PubMed] [Google Scholar]
- 7.Chavez-Noriega L. E., Halliwell, J. V. & Bliss, T. V. P. (1990) Exp. Brain Res. 79**,** 633-641. [DOI] [PubMed] [Google Scholar]
- 8.Wilshaw D. & Dayan, P. (1990) Neural Comput. 2**,** 85-93. [Google Scholar]
- 9.Dudek S. M. & Bear, M. F. (1993) J. Neurosci. 13**,** 2910-2918. [DOI] [PMC free article] [PubMed] [Google Scholar]
- 10.Bernard C. & Wheal, H. V. (1995) J. Neurosci. 15**,** 6542-6551. [DOI] [PMC free article] [PubMed] [Google Scholar]
- 11.Fuji S., Kuroda, Y., Ito, K., Kaneko, K. & Kato, K. (1999) J. Physiol. (London) 521**,** 451-466. [DOI] [PMC free article] [PubMed] [Google Scholar]
- 12.Dudek S. M. & Bear, M. F. (1992) Proc. Natl. Acad. Sci. USA 89**,** 4363-4367. [DOI] [PMC free article] [PubMed] [Google Scholar]
- 13.Debanne D., Gähwiler, B. H. & Thompson, S. M. (1996) Proc. Natl. Acad. Sci. USA 93**,** 11225-11230. [DOI] [PMC free article] [PubMed] [Google Scholar]
- 14.Chavez-Noriega L. E., Bliss, T. V. P. & Halliwell, J. V. (1989) Neurosci. Lett. 104**,** 58-64. [DOI] [PubMed] [Google Scholar]
- 15.Lu Y. M., Mansuy, I., Kandel, E. R. & Roder, J. (2000) Neuron 26**,** 197-205. [DOI] [PubMed] [Google Scholar]
- 16.Hess G. & Gustafsson, B. (1990) Neuroscience 37**,** 61-69. [DOI] [PubMed] [Google Scholar]
- 17.Asztely F. & Gustafsson, B. (1994) Hippocampus 4**,** 148-156. [DOI] [PubMed] [Google Scholar]
- 18.Jester J. M., Campbell, L. W. & Sejnowski, T. J. (1995) J. Physiol. (London) 484**,** 689-705. [DOI] [PMC free article] [PubMed] [Google Scholar]
- 19.Desai N. S., Rutherford, L. C. & Turrigiano, G. G. (1999) Nat. Neurosci. 2**,** 515-520. [DOI] [PubMed] [Google Scholar]
- 20.Mulkey R. M. & Malenka, R. C. (1992) Neuron 9**,** 967-975. [DOI] [PubMed] [Google Scholar]
- 21.Taube J. S. & Schartzkroin, P. A. (1988) J. Neurosci. 8**,** 1632-1644. [DOI] [PMC free article] [PubMed] [Google Scholar]
- 22.Aizenman C. D. & Linden, D. J. (2000) Nat. Neurosci. 3**,** 109-111. [DOI] [PubMed] [Google Scholar]
- 23.Armano S., Rossi, P., Taglietti, V. & D'Angelo, E. (2000) J. Neurosci. 20**,** 5208-5216. [DOI] [PMC free article] [PubMed] [Google Scholar]
- 24.Tsubokawa H., Offermanns, S., Simon, M. & Kano, M. (2000) J. Neurosci. 20**,** 4878-4884. [DOI] [PMC free article] [PubMed] [Google Scholar]
- 25.Cohen A. S., Coussens, C. M., Raymond, C. R. & Abraham, W. C. (1999) J. Neurophysiol. 82**,** 3139-3148. [DOI] [PubMed] [Google Scholar]
- 26.Disterhoft J. F., Coulter, D. A. & Alkon, D. L. (1986) Proc. Natl. Acad. Sci. USA 83**,** 2733-2737. [DOI] [PMC free article] [PubMed] [Google Scholar]
- 27.Schreurs B. G., Tomsic, D., Gusev, P. A. & Alkon, D. L. (1997) J. Neurophysiol. 77**,** 86-92. [DOI] [PubMed] [Google Scholar]
- 28.Burrell B. D., Sahley, C. L. & Muller, K. J. (2001) J. Neurosci. 21**,** 1401-1412. [DOI] [PMC free article] [PubMed] [Google Scholar]
- 29.Bienenstock E. L., Cooper, L. N. & Munrow, P. W. (1982) J. Neurosci. 2**,** 32-48. [DOI] [PMC free article] [PubMed] [Google Scholar]
- 30.Whatey J. C., Lytton, W. W., Jester, J. M. & Sejnowski, T. J. (1992) J. Neurosci. 12**,** 607-618. [DOI] [PMC free article] [PubMed] [Google Scholar]
Associated Data
This section collects any data citations, data availability statements, or supplementary materials included in this article.
Supplementary Materials
Supporting Figures
