Three-Dimensional Analysis of Syncytial-Type Cell Plates during Endosperm Cellularization Visualized by High Resolution Electron Tomography (original) (raw)
Abstract
The three-dimensional architecture of syncytial-type cell plates in the endosperm of Arabidopsis has been analyzed at ∼6-nm resolution by means of dual-axis high-voltage electron tomography of high-pressure frozen/freeze-substituted samples. Mini-phragmoplasts consisting of microtubule clusters assemble between sister and nonsister nuclei. Most Golgi-derived vesicles appear connected to these microtubules by two molecules that resemble kinesin-like motor proteins. These vesicles fuse with each other to form hourglass-shaped intermediates, which become wide (∼45 nm in diameter) tubules, the building blocks of wide tubular networks. New mini-phragmoplasts also are generated de novo around the margins of expanding wide tubular networks, giving rise to new foci of cell plate growth, which later become integrated into the main cell plate. Spiral-shaped rings of the dynamin-like protein ADL1A constrict but do not fission the wide tubules at irregular intervals. These rings appear to maintain the tubular geometry of the network. The wide tubular network matures into a convoluted fenestrated sheet in a process that involves increases of 45 and 130% in relative membrane surface area and volume, respectively. The proportionally larger increase in volume appears to reflect callose synthesis. Upon fusion with the parental plasma membrane, the convoluted fenestrated sheet is transformed into a planar fenestrated sheet. This transformation involves clathrin-coated vesicles that reduce the relative membrane surface area and volume by ∼70%. A ribosome-excluding matrix encompasses the cell plate membranes from the fusion of the first vesicles until the onset of the planar fenestrated sheet formation. We postulate that this matrix contains the molecules that mediate cell plate assembly.
INTRODUCTION
In plant cells, new cell walls are formed by phragmoplasts, complex cytoskeletal arrays of microtubules and actin filaments, and cell plates, which form from the fusion of Golgi-derived vesicles and mature into cell walls. In “conventional” cytokinesis, nuclear division and cytokinesis are coupled (i.e., the phragmoplast arises from the anaphase spindle between the two sister nuclei immediately after mitosis). In contrast, in systems exhibiting “nonconventional” cytokinesis, such as nuclear endosperms, nuclear division is not immediately followed by cytokinesis (i.e., the two processes are uncoupled and new walls are formed at a later stage between sister and nonsister nuclei) (Otegui and Staehelin, 2000a, 2000b).
The early development of nuclear-type endosperms involves several cycles of nuclear division followed by repositioning of the nuclei to the cortical cytoplasm surrounding the central vacuole. The sites of assembly of the future cell walls are then determined by radial systems of microtubules, which originate from microtubule organizing centers associated with the nuclear surface and organize the cytoplasm into nuclear cytoplasmic domains (Brown and Lemmon, 1992; Pickett-Heaps et al., 1999). The new cell walls form where opposing sets of microtubules from adjacent nuclear cytoplasmic domains overlap, but the mechanism by which these cell walls develop, whether by infurrowings from the parental cell wall or by conventional cell plate formation, remained unsettled for more than 90 years (DeMason, 1997). We demonstrated recently that the formation of the first endosperm cell walls involves phragmoplast-like structures termed mini-phragmoplasts, and a syncytial-type cell plate is formed (Otegui and Staehelin, 2000a, 2000b). Each mini-phragmoplast consists of two opposing sets of microtubules, which arise from the overlapping clusters of microtubules that radiate from neighboring nuclei. Golgi-derived vesicles seem to be transported along these microtubules and to fuse with each other to generate a network of wide membranous tubes (∼45 nm in diameter). Subsequently, these wide tubes undergo a series of transformations that eventually yield the mature cell wall (Otegui and Staehelin, 2000a).
The transient membrane configurations observed during syncytial-type cell plate formation differ in several respects from those reported for somatic-type cell plates, but the overall assembly process is quite similar (cf. Samuels et al., 1995, and Otegui and Staehelin, 2000a). Both processes involve highly complex sets of carefully controlled membrane transformation and maturation events and a sequential deposition of different types of cell wall–forming polysaccharides. For example, whereas the early stage cell plates are rich in xyloglucans and pectins produced by Golgi-located enzymes, later stage cell plates contain increasing amounts of callose and cellulose, polysaccharides that are synthesized by enzymes located in the cell plate membrane (Hong et al., 2001a, 2001b; Verma, 2001). Furthermore, the activation of these latter enzymes seems to coincide with the disappearance of the dense fuzzy coat that surrounds the tubular cell plate membranes (Samuels et al., 1995; Otegui and Staehelin, 2000a).
Although these recent ultrastructural studies have provided a wealth of new insights into the processes of both somatic- and syncytial-type cell plate assembly, many structural questions remain as a result of the technical limitations associated with the analysis of thin (∼80 nm) sections. In particular, such thin sections can provide only limited information about the spatial organization of phragmoplast microtubules, the three-dimensional (3-D) architecture of cell plate intermediates, and the distribution of cell plate–forming vesicles. In addition, it is impossible to extract from thin section micrographs precise quantitative information about the surface areas and volumes of the different types of highly convoluted cell plate intermediates, the number of vesicles needed to assemble these membranous intermediates, and the number of microtubules participating in cell plate assembly.
We demonstrated recently that it is possible to obtain both high-resolution (∼6 nm) and quantifiable 3-D information on membrane systems associated with the secretory pathway of mammalian cells by combining high-pressure freezing/freeze substitution for specimen preparation and dual-axis high-voltage electron tomography for image analysis (Ladinsky et al., 1999; Marsh et al., 2001). Here we report on the use of these advanced structural research techniques to study the 3-D architecture of plant cell components. The resulting data sets have not only confirmed a number of previously defined stages of syncytial-type cell plate formation but also have led to the discovery of new structural elements of forming cell plates, to a much better definition of the 3-D conformation of several membrane network intermediates, and to quantitative insights about the volumetric and surface plasma membrane area changes during cell plate formation. Some highlights of this study are the discovery of spiral complexes of dynamin-like molecules that appear to transiently pinch but not fission membrane tubules, the demonstration that most Golgi-derived vesicles are connected to microtubules by means of two molecules that resemble kinesin-type motor proteins, and the quantitative demonstration that 75% of the cell plate membrane is removed during maturation.
RESULTS
Dual-axis tomography provides a means of producing very thin (2 to 3 nm thick) tomographic slices through a 3-D reconstructed cellular volume. The results reported in this study are based on four dual-axis high-voltage electron microscope tomographic reconstructions of high pressure frozen/freeze-substituted endosperm samples containing syncytial-type cell plates.
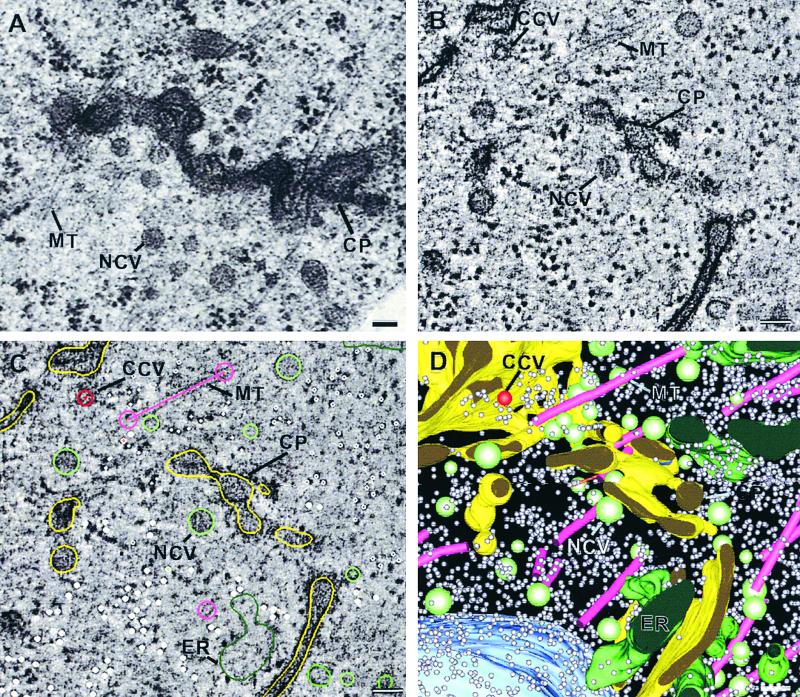
The computed tomographic slices were parallel to the plane of the original microtome section and resemble conventional thin sections (cf. Figures 1A and 1B), except that they are 30 times thinner (80 versus 2.3 nm). Figure 1 depicts the main steps in the modeling process (see also video sequence 1). Cellular structures (objects) are traced with colored contours in every slice (Figure 1C). The contours belonging to the same object are then assembled into individual 3-D structures (Figure 1D; see Methods).
Figure 1.
Comparison between Conventional Electron Microscopy and Electron Tomography and Steps in Tomographic 3-D Reconstruction.
(A) Conventional electron micrograph of an 80-nm section observed at 80 kV.
(B) to (D) Steps in the 3-D tomographic reconstruction of a portion of a cell plate and the surrounding cytoplasm.
(B) A 2.3-nm tomographic slice extracted from a tomogram consisting of 157 slices. This tomogram was obtained by combining the reconstructed volumes derived from two orthogonal tilt series (dual-axis tomography) using IMOD software package.
(C) Cellular structures such as microtubules (magenta), noncoated vesicles (light green), clathrin-coated vesicles (red), endoplasmic reticulum cisternae (dark green), cell plates (yellow), and ribosomes (gray dots) included in the tomographic volume are traced one by one with colored contours in all of the slices.
(D) Rendition of the surfaces on the contours for each object modeled in this region. The surfaces of individual objects were obtained by computing a mesh of triangles between overlapping contours in two adjacent tomographic slices. See also video sequence 1.
CCV, clathrin-coated vesicle; CP, cell plate; ER, endoplasmic reticulum; MT, microtubules; NCV, noncoated vesicle. Bars = 50 nm.
Cell Plate–Forming Vesicles Are Connected to Mini-Phragmoplast Microtubules via Structures That Resemble Motor Proteins
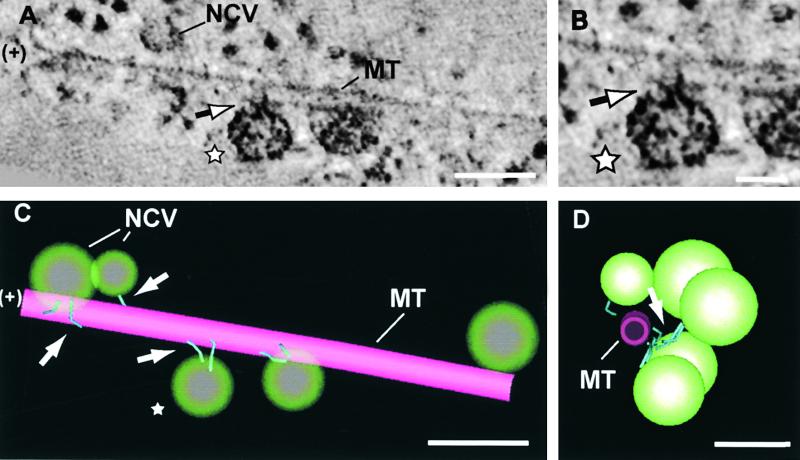
Syncytial-type cell plates are assembled from Golgi-derived vesicles in structures known as mini-phragmoplasts, which are small clusters of oppositely oriented microtubules and associated cytoskeletal molecules (Otegui and Staehelin, 2000a). It is generally assumed that the Golgi-derived vesicles travel to the forming cell plates along microtubules with the help of plus end–directed microtubule motor proteins, but direct observations supporting this hypothesis have been difficult to achieve. In tomographic studies, such motor proteins can be visualized readily by using the “image slicer” tool in the Imod image analysis program (see Methods). This tool allows the viewer to orient the tomographic slices parallel to the longitudinal axis of individual microtubules (Figure 2A). Once oriented, each 2.3-nm-thick slice or an integrated view of a few of them can be analyzed for the presence of structures (molecules) that link the vesicles to the microtubule (Figures 2A and 2B).
Figure 2.
Mini-Phragmoplast Microtubules and Associated Vesicles with Kinesin-Like Proteins.
(A) An 11.5-nm-thick tomographic slice (slicer view of five integrated 2.3-nm slices) through a mini-phragmoplast microtubule and associated noncoated vesicles. The flared plus end (+) is facing the cell plate. Two kinked, rod-like structures (arrow) link the vesicle marked by a star to the microtubule.
(B) Detail of the vesicle marked by a star in (A) showing the microtubule-vesicle connecting structures.
(C) Three-dimensional model of the same microtubule and associated vesicles depicted in (A). Four vesicles are connected by rod-like structures (arrows) to the microtubule (three of them are connected by two linkers and one is connected by a single linker), and one vesicle displays no bridging elements.
(D) Same 3-D model but viewed from the microtubule plus end.
MT, microtubule; NCV, non-coated vesicle. Bars in (A), (C), and (D) = 100 nm; bar in (B) = 50 nm.
The microtubule segment shown in Figure 2A includes a microtubule end that was oriented toward the forming cell plate and depicts flared protofilaments. Because phragmoplast microtubules have their plus ends facing the cell plate, and because microtubule plus ends usually are flared, we postulate that the microtubule end marked “+” in Figure 2 corresponds to a plus end. Closely associated with this 0.4-μm-long microtubule segment are five vesicles whose staining properties and size (∼50 nm in diameter) are characteristic of cell plate–forming vesicles. Of these five vesicles, four are connected to the microtubule surface via kinked, rod-like structures. Each of the connecting elements appears to consist of three domains, a 7-nm-long domain attached to the microtubule surface, an ∼30-nm bridging domain, and a blob-like domain associated with the vesicle surface, which was not always discernible (Figure 2B). Based on their morphology, their size, and the direction in which the vesicles have to be transported to the cell plate, these vesicle–microtubule bridging structures most likely correspond to kinesin motor proteins. Of the four vesicles with bridging elements seen in Figure 2, three appear to have two kinesin-like proteins and one appears to have only one (Figures 2C and 2D). Analysis of other microtubules with associated vesicles confirms that a majority of the vesicles are attached via two kinesin-like motor proteins.
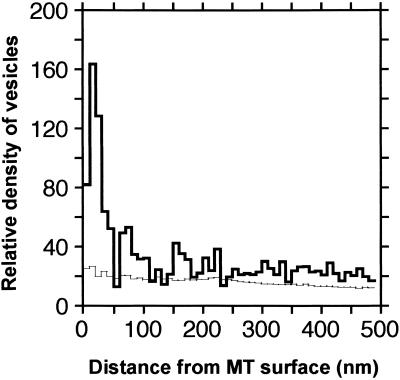
To determine approximately how many vesicles are associated with mini-phragmoplast microtubules, we have calculated the distance between every microtubule and its neighbor vesicles (Figure 3). We also tested the significance of this association by comparing the distribution pattern with a random distribution of microtubules and vesicles (see Methods). Figure 3 demonstrates that a significant number of vesicles are within 10 to 30 nm of a microtubule. Considering that the tethered vesicles represented in Figure 3 are located between 15 and 25 nm from the microtubule surface, it is likely that most of the vesicles within an ∼30-nm radius of the microtubule surfaces also are linked to the microtubule via kinesin-like motor proteins.
Figure 3.
Quantitative Analysis of Distances between Microtubules and Noncoated Vesicles.
The histogram shows the relative density of vesicles (number of vesicles per cubic micrometer) at 10-nm distances from the microtubule surfaces. The peak in the real distribution (thick line) is substantially greater than the randomized distribution (thin lines), suggesting a specific association. Note that many vesicles are located between 10 and 30 nm from the microtubule surfaces. MT, microtubule.
The freeze substitution and staining protocols used in this study were optimized for membrane staining and not for the preservation of the actin cytoskeleton. For this reason, we were able to trace only a few individual actin filaments. Nevertheless, in most of the cases in which actin filaments were identified unambiguously, they were attached to the growing edge of the cell plate (see Figure 8) and were surrounded by noncoated vesicles (data not shown).
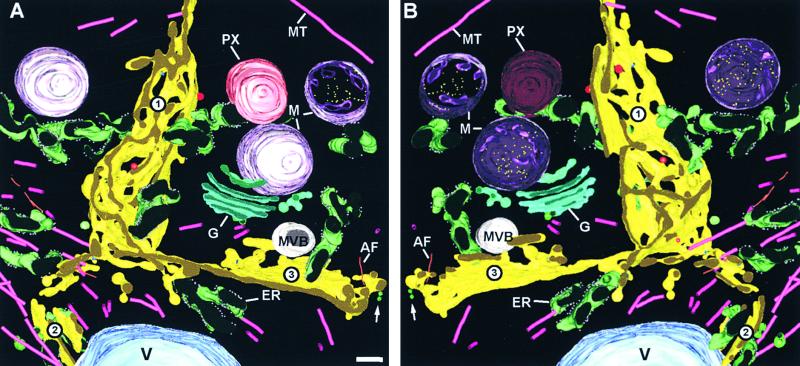
Figure 8.
“Front” and “Back” Views of a 2.8 × 2.8 × 0.5 μm3 Cytoplasmic Volume Containing a Junctional Region between Three Maturing Cell Plates.
(A) and (B) Note that each cell plate is in a slightly different stage of development. Cell plate 1 is mostly in the convoluted fenestrated sheet stage; the less developed cell plate 2 is just beginning to fuse with the junctional region; and cell plate 3 is already in the planar fenestrated sheet stage. An hourglass-shaped intermediate (arrow) is seen near the growing edge of cell plate. Most of the microtubules (MT) are located near the growing region of the least developed cell plate 2. Numerous larger organelles, such endoplasmic reticulum cisternae (ER), mitochondria (M), and a peroxisome (PX) also are crowded around the junctional area. See also video sequences 4 and 5. AF, actin filament; G, Golgi; MVB, multivesicular body; V, vacuole.
Bar in (A) = 200 nm.
Growth of the Wide Tubular Network Occurs at Discrete Locations throughout the Network
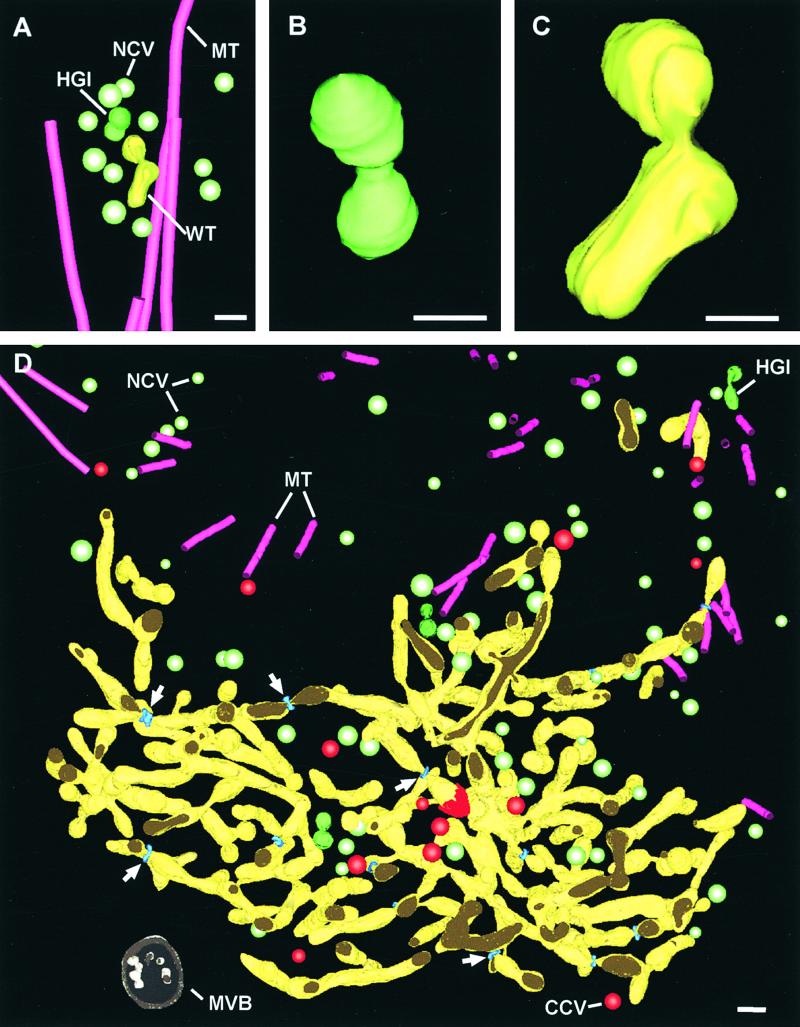
Upon arriving at the future site of the cell plate, the Golgi-derived vesicles fuse with each other and thereby initiate cell plate formation. The earliest stages of cell plate assembly have been captured in the reconstructed mini-phragmoplast illustrated in Figures 4A to 4C. Aside from the microtubules (magenta) and numerous noncoated, Golgi-derived vesicles (Figure 4A, light green), the reconstruction depicts a distinct hourglass-shaped fusion intermediate (Figures 4A and 4B, green) and a short wide tubule (Figures 4A and 4C, green/yellow) with which a vesicle appears to be fusing. As these wide tubules become longer, they appear to branch and fuse with each other to generate a membranous network, the yellow-colored wide tubular network (Figure 4D, video sequence 2).
Figure 4.
Three-Dimensional Modeled Reconstruction of the First Steps in Syncytial-Type Cell Plate Assembly.
(A) Mini-phragmoplast. Noncoated vesicles transported along microtubules to the future cell plate site fuse with each other via hourglass-shaped intermediates to produce wide tubules.
(B) and (C) Details of an hourglass-shaped intermediate (B) and a growing wide tubule (C).
(D) Wide tubular network resulting from the fusion, extension, and branching of individual wide tubules. All of the mini-phragmoplast microtubules are located around the growing edges. Numerous noncoated vesicles and some clathrin-coated vesicles are found both between the tubules and in the vicinity of the cell plate. Tubule-constricting helical structures (white arrows; see Figure 5 for details) are seen throughout the network. See also video sequence 2.
CCV, clathrin-coated vesicle; HGI, hourglass-shaped intermediate; MT, microtubule; MVB, multivesicular body; NCV, noncoated vesicle; WT, wide tubule. Bars in (A) and (D) = 100 nm; bars in (B) and (C) = 50 nm.
The individual tubules of the wide tubular network have diameters of between 45 and 52 nm, except at specific constricted sites, which are discussed in greater detail in the next section. In the area shown in Figure 4D, most of the microtubules along which the noncoated, Golgi-derived vesicles are brought to the forming cell plate are located outside of the upper edge of the wide tubular network region. A few microtubules are seen closely associated with unbranched, elongated wide tubules that extend from the cell plate edge. The majority of the noncoated vesicles located between the network tubules are in the upper right half of the network (Figure 4D). Because this region also contains hourglass-shaped vesicle fusion intermediates and many short, unbranched tubules, it appears that this is where most of the wide tubular network growth occurs.
Interestingly, a second independent cell plate assembly site consisting of a mini-phragmoplast, vesicles, an hourglass-shaped intermediate, and individual wide tubules is seen in the upper right corner of Figure 4D (see also video sequence 2). The red cap associated with the tubule end near the center of the network corresponds to a clathrin coat, and the surrounding red vesicles correspond to clathrin-coated vesicles. A multivesicular body (Figure 4D) is seen in close proximity to the forming cell plate.
Dynamin-Like Rings Constrict the Tubules of Wide Tubular Networks at Irregular Intervals
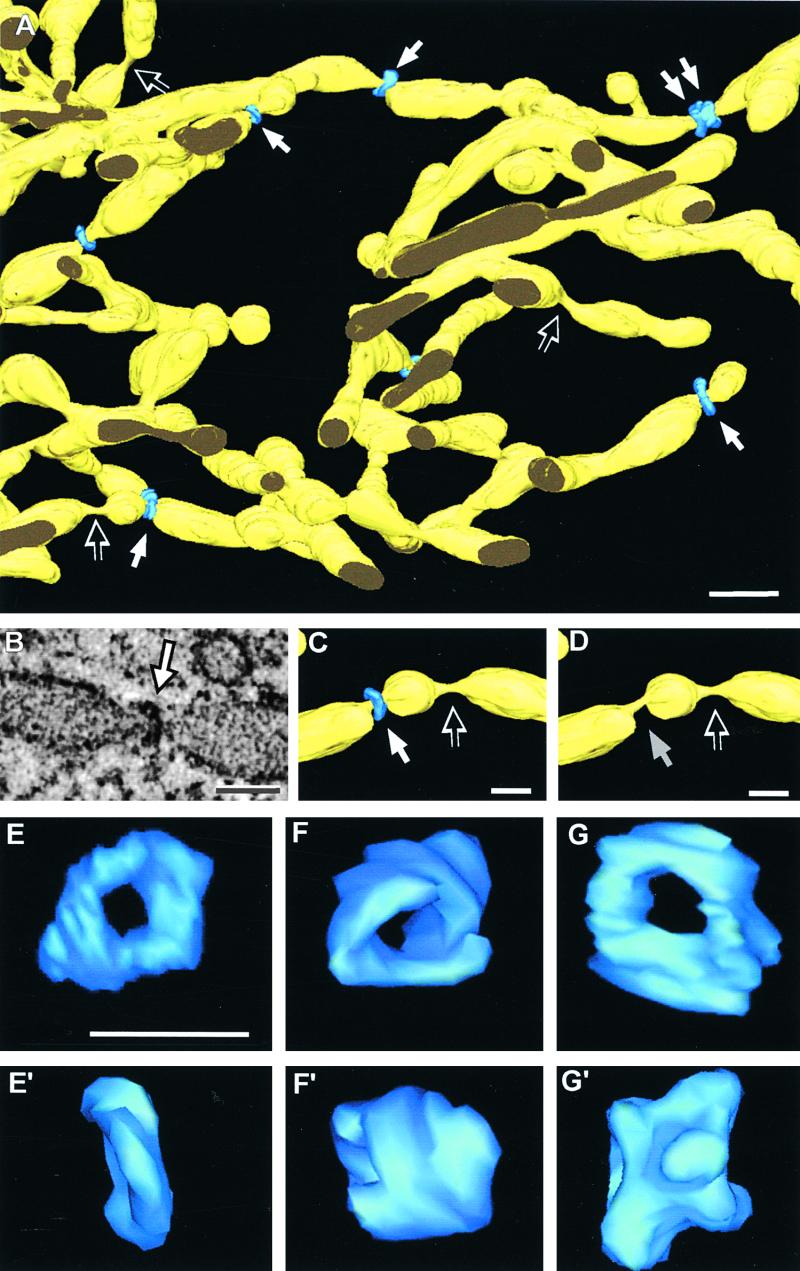
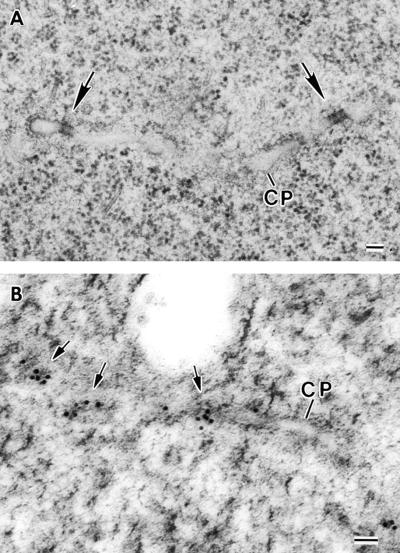
One of the most striking novel features of syncytial-type cell plates revealed by our tomographic studies are the ring complexes that constrict the wide tubular network at irregular intervals (Figures 5 and 6). These structures exhibit a helical configuration; their outside diameter is 45 nm, and their length along the tubes varies depending on whether they possess a single or a double turn helical structure (Figure 5A, single and double arrows, and Figures 5E to 5G′). Where these rings form, the normally ∼50-nm wide membrane tubules become constricted to a diameter of ≤20 nm (cf. Figures 5C and 5D). We have found ∼10 ring complexes per square micrometer of wide tubular network domain. Interestingly, similarly pinched membrane domains that lack constricting rings also are present throughout the wide tubular networks (Figures 5A, 5C, and 5D, open arrows). The high frequency with which these ring-lacking constricted membrane domains are seen (one for every two rings) suggests that the rings could be transient structures that, upon release, leave behind a transiently constricted membrane domain (cf. Figures 5C and 5D). These rings also can be identified in suitably oriented thin sections (Figure 6A).
Figure 5.
Distribution and Structure of Dynamin-Like Helical Rings That Constrict Wide Tubules.
(A) Overview of a wide tubular network domain showing simple and double constricting helical structures (white arrows) that were identified as ADL1A polymers (see Figure 6). Several constricted tubule domains without dynamin helices also are evident (empty arrows).
(B) Slicer view of a 5.6-nm tomographic slice through a wide constricted tube and its associated dynamin helix (arrow).
(C) Detail of a wide tubule with two adjacent constrictions. One of these constrictions is surrounded by a dynamin ring (white arrow), whereas the other one is not (empty arrow).
(D) Same tubules as depicted in (C) with the dynamin ring removed to show the similarity in diameter of the ring-associated constricted membrane (gray arrow) and the adjacent constricted membrane region that lacked a ring (empty arrow).
(E) to (G) Face-on views of 3-D models of individual dynamin rings that display a spiral-like substructure.
(E′) to (G′) Side-on views of the same rings. Note that the structures displayed in (F), (F′), (G), and (G′) are double-turn helices.
Bar in (A) = 100 nm; bars in (B) to (E′) = 50 nm.
Figure 6.
Thin-Section Electron Micrographs of Dynamin Rings.
(A) Micrograph of an Epon-resin section showing a growing syncytial-type cell plate (CP) edge. Two dynamin rings (arrows) are seen constricting membrane tubules.
(B) Micrograph of a Lowicryl HM20 resin–embedded syncytial-type cell plate (CP) labeled with the anti-ADL1A antibody–gold probe. Note how the clustering of the gold particles along the membrane tubules (arrows) resembles the distribution of the constricting rings.
Bars = 100 nm.
Based on their size, their helical structure, and their ability to constrict membrane tubules, we postulated that these rings could be composed of dynamin-like polymers. To test this hypothesis, we immunolabeled thin sections of forming syncytial-type cell plates with three polyclonal antibodies raised against synthetic peptides of the Arabidopsis dynamin-like protein 1A (ADL1A) (Kang et al., 2001). Of these three antibodies, only anti-ADL1A does not cross-react with any other member of the ADL1 family, whereas CIW14 and CIW15 also recognize ADL1E (B.-H. Kang and S.Y. Bednarek, unpublished results). The high pressure frozen samples used for immunolocalization were freeze substituted in glutaraldehyde and uranyl acetate and embedded in Lowicryl resin (see Methods) to optimize the preservation of antigenic sites. Although the rings are no longer clearly discernible in such specimens, the distinct clustering of the gold labels obtained with the anti-ADL1A antibody along membrane tubes (Figure 6B), as well as with the other two antibodies (data not shown), strongly supports the notion that the rings are in fact composed of dynamin-like proteins.
During Maturation, the Tubules of the Wide Tubular Network Coalesce into Extremely Convoluted Fenestrated Sheets
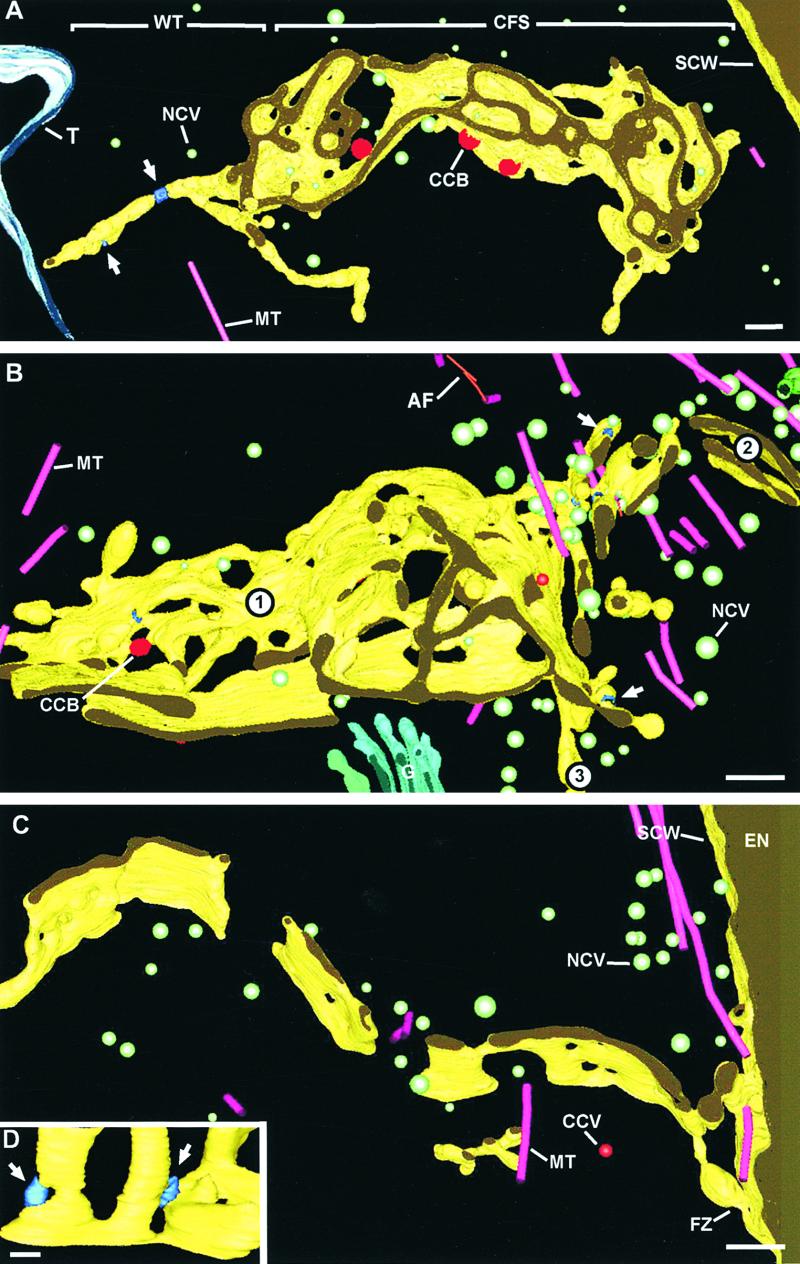
As the wide tubular network domains continue to fuse with each other and with individual new tubules, the maturing network becomes more coherent and three-dimensionally more complex (see left side of the network shown in Figure 4D). Eventually, the tubules also begin to fuse laterally with each other, beginning the transformation of the wide tubular network into a membrane system consisting of extremely convoluted, interconnected fenestrated membrane sheets that form labyrinth-like structures (Figures 7A and 7B, Figure 8, video sequence 3). Previously, based on 80-nm serial sections, we interpreted this transformation to involve the conversion of the wide tubular network into a thin tubular network (Otegui and Staehelin, 2000a). However, it is now obvious that the 3-D resolution of conventional thin sections is simply inadequate to allow for an unambiguous interpretation of this type of unusually convoluted membrane configuration.
Figure 7.
Three-Dimensional Models of Convoluted and Planar Fenestrated Sheets That Illustrate Different Stages of Cell Plate Maturation.
(A) Syncytial-type cell plate showing a convoluted fenestrated sheet domain in its central region and wide tubules emanating from the growing edge. At left, the cell plate extends toward the tonoplast membrane of a vacuole, whereas at right, it is seen close to a syncytial cell wall. Two dynamin rings (white arrows) are seen constricting the wide tubules on the left. Three clathrin-coated buds are shown budding from the convoluted fenestrated sheet domains. See also video sequence 3.
(B) Junctional region between three growing syncytial-type cell plates (numbers 1, 2, and 3). Cell plate 1 exhibits a more convoluted fenestrated sheet-type morphology near the junction region (central area), which changes to a more planar fenestrated sheet toward the left (older domain). Cell plate 2 appears to be in the process of fusing to the other two cell plates by an actively growing wide tubular network domain. (Note the high density of mini-phragmoplast microtubules and noncoated cell plate–forming vesicles in this region.) Several dynamin rings are seen associated with all three adjoining cell plates. See also video sequences 4 and 5.
(C) Segment of a planar fenestrated sheet fused to the syncytial cell wall facing the endothelium via two wide tubules. Several microtubules appear to be directing vesicles to the fusion site.
(D) Detail of a fenestrated sheet in which dynamin rings (arrows) are constricting narrow membrane bridges between adjacent fenestrae.
AF, actin filaments; CCB, clathrin-coated bud; CFS, convoluted fenestrated sheet; EN, endothelium; FZ, fusion zone; MT, microtubule; NCV, noncoated vesicle; SCW, syncytial cell wall; T, tonoplast membrane; WT, wide tubule. Bars in (A) to (C) = 100 nm; bar in (D) = 50 nm.
While the transformation from wide tubular network to convoluted fenestrated sheet is taking place in the older domains of the cell plates, the peripheral regions continue to grow by the lengthening of existing wide tubules and the formation of new tubules. This is seen most clearly in Figure 7A, which shows several elongated wide tubules that extend from the cell plate margins (see also video sequence 3). The presence of dynamin-like rings around these wide tubules (Figure 7A, arrows) confirms that these tubules are in the early stages of development. Upon reaching the cell surface, the tubules fuse with the plasma membrane, thereby linking the cell plate to the mother cell wall (Figure 7C).
As described previously (Otegui and Staehelin, 2000a), the cellularization of the syncytial endosperm also requires the fusion of adjacent cell plates with each other to form the triple junction regions of the honeycomb-like cell walls. Figures 7B and 8 depict such a region, where three cell plates (numbers 1, 2, and 3) at slightly different stages of development are in the process of joining together. In the joining region, the density of mini-phragmoplast microtubules is quite high, as is the density of Golgi-derived vesicles. Most of the vesicles are seen crowding around the wide tubules that extend from the least developed cell plate (number 2) (see also video sequences 4 and 5). Several dynamin-like rings also are associated with wide tubules (Figure 7B, arrows).
Transformation of a Convoluted Fenestrated Sheet into a Planar Fenestrated Sheet Involves the Removal of Excess Membrane by Clathrin-Coated Vesicles
Although the individual convoluted fenestrated sheets are on average only ∼28 nm wide, the entire convoluted fenestrated system forms a layer that has a thickness of between 450 and 500 nm (Figures 7A and 7B). Conversion of this labyrinthine membrane system into a planar fenestrated sheet (Figure 7C) requires the removal of large amounts of excess membrane. This removal process appears to be mediated by clathrin-coated budding vesicles that begin to appear on maturing wide tubules (Figure 4D, red membrane bud), reach their highest density (one clathrin-coated bud per 1.6 μm2 of membrane surface area) on the convoluted fenestrated sheets (Figure 7A, video sequence 3), and then gradually decline. As this excess membrane is withdrawn, the degree of membrane convolution and layering gradually decreases to eventually yield a planar fenestrated sheet. This transformation process is illustrated most clearly in the left half of Figure 7B, where the fenestrated membrane system 1 can be seen to change from a highly convoluted morphology in the center to a more planar configuration toward the left. During this process, a few dynamin-like rings still can be seen pinching narrow connections between adjacent fenestrae (Figure 7D).
Syncytial-Type Cell Plates Undergo Dramatic Changes in Membrane Surface Area and Volume during Maturation
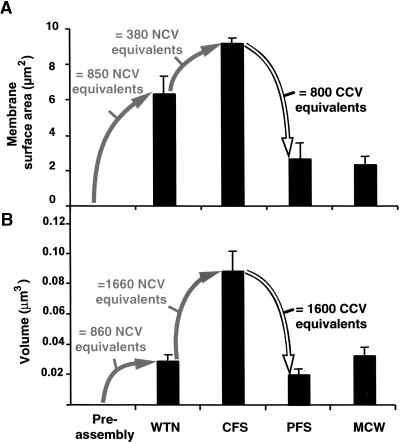
We have further characterized these cell plate transformation events by calculating the changes in surface area and volume of the different cell plate assembly intermediates (Figure 9). Because the surface area of plasma membranes cannot be expanded by stretching (Wolfe and Steponkus, 1983), we assumed for our calculations that the observed changes in membrane surface area during cell plate assembly are caused by the incorporation or removal of membrane material. As discussed above, cell plates arise from Golgi-derived noncoated vesicles (Figure 9A, NCV), and removal of excess membrane from cell plates is achieved by the formation of clathrin-coated vesicles (Figure 9A, CCV). Thus, by calculating the surface area of the two types of vesicles and the unit surface areas of the cell plates at different developmental stages, one can determine how many vesicle equivalents had to be added or subtracted to transform one kind of cell plate intermediate into the next kind. The terms unit membrane surface area and unit cell plate volume are defined as the membrane surface area and volume of cell plate pieces contained in a 1-μm3 box (see Methods). As depicted in Figure 9A, the unit surface area of the wide tubular network was 6.34 μm2. Because an average cell plate–forming vesicle has a surface area of 0.00747 μm2, ∼850 noncoated vesicle equivalents would be needed to produce this piece of wide tubular network. An additional 380 noncoated vesicle equivalents would be needed to convert a wide tubular network into a convoluted fenestrated sheet (9.17 μm2; Figure 9A). In contrast, to transform a convoluted fenestrated sheet into a planar fenestrated sheet (Figure 9A) would require the removal of 800 clathrin-coated vesicle equivalents (0.0082 μm2 of membrane surface area per clathrin-coated vesicle).
Figure 9.
Histograms Illustrating Changes in Membrane Surface Area and Volume during Syncytial-Type Cell Plate Assembly.
(A) Changes in unit cell plate surface area.
(B) Changes in unit cell plate volume.
The values refer to the surface area and volume of cell plate elements contained in a 1-μm3 box of reconstructed volume (see Methods). The numbers of noncoated vesicle and clathrin-coated vesicle equivalents that would mediate the transition from one developmental stage to the next also are provided. CCV, clathrin-coated vesicle; CFS, convoluted fenestrated sheet; MCW, mature cell wall; NCV, noncoated vesicle (Golgi derived); PFS, planar fenestrated sheet; WTN, wide tubular network. Error bars indicate the standard deviation.
We also have analyzed the changes in volume of the different cell plate intermediates (Figure 9B). Approximately the same number of noncoated vesicle equivalents (860 versus 850; Figure 9B) that are required to produce the unit membrane surface area of the wide tubular network also are enough to account for the unit volume of this membranous compartment (0.03 μm3; 3.5 × 10⁻⁵ μm3/cell plate–forming vesicle). This suggests that the cell wall precursor molecules in the wide tubular network are provided entirely by Golgi-derived vesicles. In contrast, the dramatic volumetric changes associated with the following cell plate transformation events cannot be explained by the incorporation or removal of vesicles alone. If only vesicle trafficking were considered, the change in relative volume from the wide tubular network (0.03 μm3) to the convoluted fenestrated sheet (0.088 μm3) would require the incorporation of 1660 noncoated vesicle volume equivalents, whereas only 380 noncoated vesicle equivalents would be needed for the surface area changes. A similar discrepancy between the volume and surface area changes is observed during the transformation from convoluted fenestrated sheet to planar fenestrated sheet, during which ∼1600 clathrin-coated vesicle volume equivalents should be removed to account for the volumetric change (4.2 × 10⁻⁵ μm3/clathrin-coated vesicle) versus 800 clathrin-coated vesicle equivalents for the surface area change. Based on these findings, it is obvious that the greater volumetric than surface area changes must originate from cell plate activities other than vesicle transport. Conversion of a planar fenestrated sheet into a new cell wall involves only a slight increase in relative volume (from 0.021 to 0.035 μm3).
A Ribosome-Excluding Matrix Surrounds the Wide Tubular Network and the Convoluted Fenestrated Sheet but Not the Planar Fenestrated Sheet
We reported previously that ribosomes appeared to be excluded from the vicinity of forming wide tubular networks by a dense matrix of fine filamentous molecules (Otegui and Staehelin, 2000a). However, the extent and timing of the assembly and disassembly of this matrix was difficult to assess in conventional thin sections. Using our tomographic data sets, we have been able to produce more definitive information about the spatial organization of this ribosome-excluding zone during different stages of cell plate formation and about how this zone affects the distribution of other cellular components.
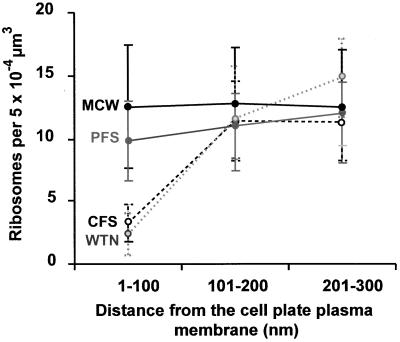
A quantitative assessment of these ribosome–cell plate relationships during different stages of cell plate formation is presented in Figure 10. In this diagram, the density of ribosomes is plotted against their distance from the cell plate plasma membrane. The density of ribosomes within a 100-nm distance from wide tubular network and convoluted fenestrated sheet membranes is seen to be much lower than for the planar fenestrated sheet and the completed cell walls. Beyond 100 nm, the ribosome density is the same as in the cytoplasm regions not associated with the cell plate (Figure 10).
Figure 10.
Changes in Ribosome Density as a Function of Distance from the Cell Plate Surface.
The densities of ribosomes are plotted against their distance from the cell plate membrane for different cell plate intermediates. CFS, convoluted fenestrated sheet; MCW, mature cell wall; PFS, planar fenestrated sheet; WTN, wide tubular network. Error bars indicate the standard deviation.
In Figure 11A, we have highlighted the distinct interface between cytosolic ribosomes and the matrix zone surrounding a segment of a wide tubular network by means of red stippling. Analysis of larger areas has shown that although the matrix excludes the vast majority of the ribosomes, the exclusion is not complete, with individual ribosomes and the occasional polysomes also being present. At the same time, as illustrated in Figure 11B, the ribosome-excluding matrix does not appear to form a barrier to the much larger cell plate–forming vesicles, microtubules, and endoplasmic reticulum cisternae, all of which are essential for cell plate assembly. Indeed, the distribution of these latter structures suggests that they may have an affinity for the matrix elements and could be actively drawn into the proximity of the growing membrane tubules. Once a cell plate has reached the planar fenestrated sheet stage, the ribosome-excluding matrix disappears and ribosomes approach closely to the cell plate surface (Figure 11C).
Figure 11.
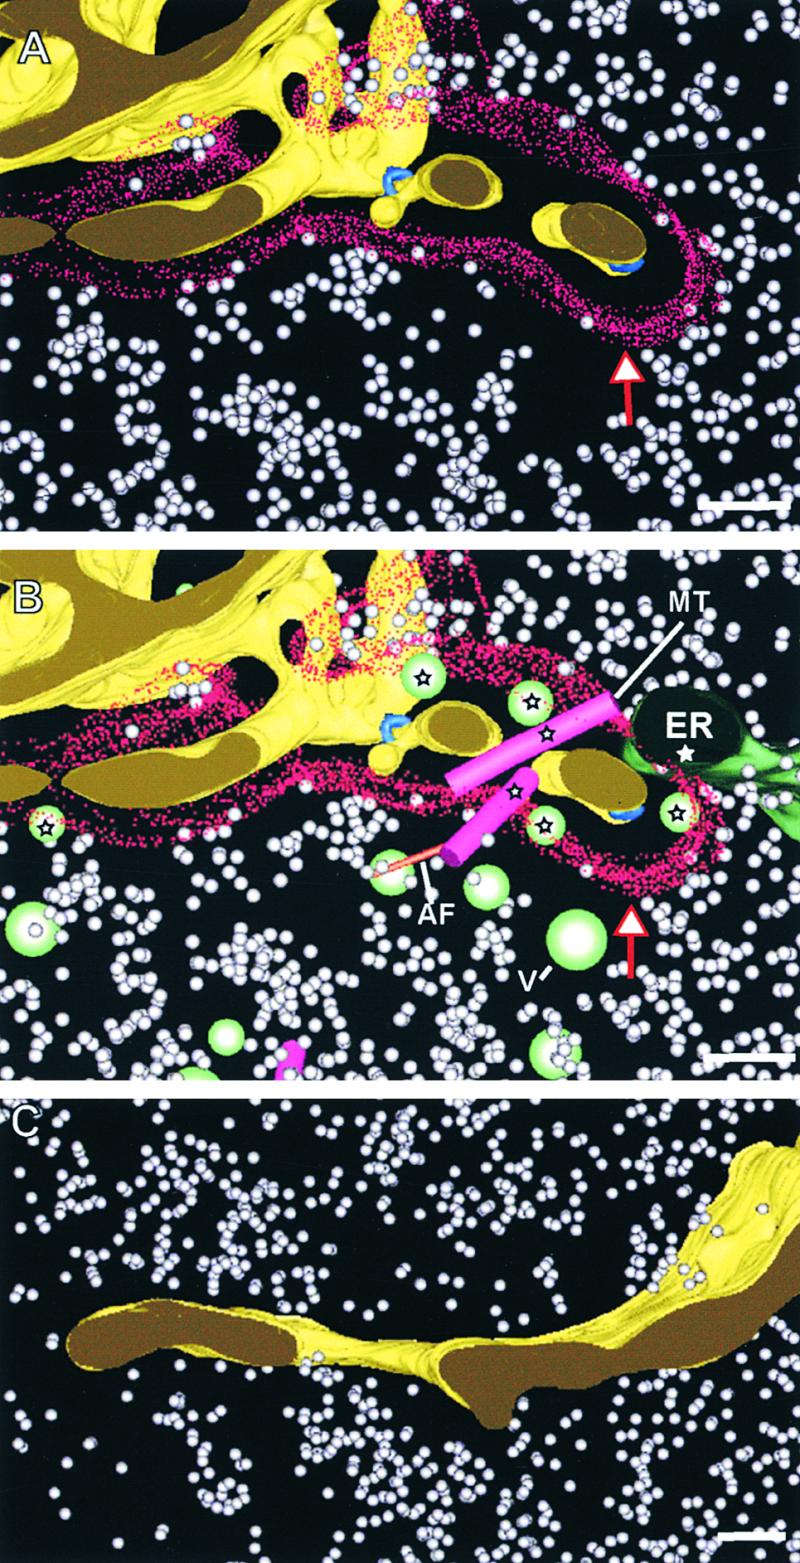
Spatial Organization of the Ribosome Exclusion Zone around Developing Cell Plates.
(A) Portion of a wide tubular network. The limit of the ribosome exclusion zone is indicated by red stippling (red and white arrow). No other organelles are included in this model to highlight its size and distribution.
(B) Same cell plate domain as shown in (A) but including associated organelles, such as noncoated vesicles (V), endoplasmic reticulum (ER), microtubules (MT), and actin filaments (AF). The organelles that are completely or partially located inside the ribosome exclusion zone are marked by stars.
(C) Segment of a planar fenestrated sheet stage cell plate. Note that ribosomes are located very close to the cell plate, indicating that the ribosome exclusion zone is no longer present.
Bars = 100 nm.
Mitochondria, Rough Endoplasmic Reticulum Cisternae, and Multivesicular Bodies Are Closely Associated with Syncytial-Type Cell Plates
We have observed in our tomograms that numerous mitochondria, Golgi stacks, endoplasmic reticulum cisternae, and multivesicular bodies are located in the vicinity of cell plates. Figure 8 depicts the relationship between these organelles and three fusing cell plates (see also video sequences 4 and 5). Vesicles are not shown in this model to highlight the spatial relationships between the organelles, the cell plates, and the microtubules.
Rough endoplasmic reticulum cisternae were seen in close proximity to all cell plates (Figure 8). During the later, planar fenestrated sheet stage of cell plate formation, such cisternae often were observed passing through the fenestrae (data not shown).
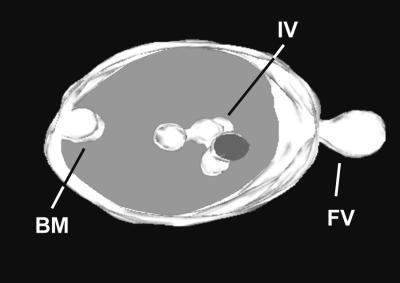
Multivesicular bodies were observed commonly in the vicinity of cell plates during all stages of development (Figures 4 and 8). A 3-D model of an individual multivesicular body is depicted in Figure 12. This multivesicular body is somewhat unique in that it shows simultaneously a cytosolic vesicle that appears to be in the process of fusing with the limiting membrane and at the opposite side a vesicle budding into the interior. (Note that the suggested budding/fusion directions are based on studies in other systems.) Within the multivesicular body lumen, all of the vesicle-like inner membranes are fused together into bulbous tubules. A similar fusion of internalized vesicles is evident in the multivesicular body illustrated in Figure 4D.
Figure 12.
Three-Dimensional Reconstruction of a Multivesicular Body.
This unusual image captures both the fusion of a cytoplasmic vesicle (FV) to the limiting membrane of a multivesicular body and, at the same time, the budding of membrane material (BM) from the limiting membrane into the interior. Several internalized vesicles (IV) are seen connected to each other.
DISCUSSION
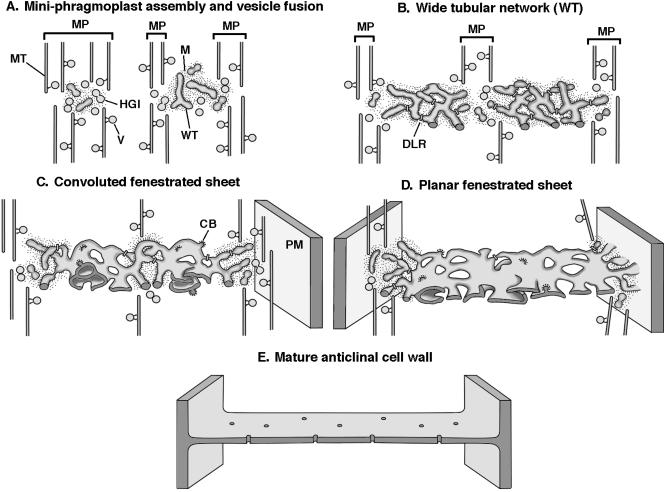
Forming cell plates are among the most three-dimensionally complex and dynamic membrane systems of plant cells. These combined features present a formidable challenge to cell biologists interested in understanding how they are assembled. In this investigation, we have used two advanced structural methods, high-pressure freezing and dual-axis high-voltage electron tomography, to obtain new insights into the mechanism of syncytial cell plate assembly. Figure 13 summarizes in diagrammatic form our current understanding of this process.
Figure 13.
Developmental Stages of Syncytial-Type Cell Plate and Cell Wall Formation.
The model summarizes the main stages in syncytial-type cell plate assembly and cell wall formation in the micropylar zone of the endosperm of Arabidopsis based on the findings of Otegui and Staehelin (2000a) and the present study. CB, clathrin-coated bud; DLR, dynamin-like rings; HGI, hourglass intermediate; M, ribosome-excluding matrix; MP, mini-phragmoplast; MT, microtubule; PM, plasma membrane; V, vesicle; WT, wide tubule.
Electron Tomography Adds a New Dimension to High-Resolution Structural Studies of Cell Plate Formation
Despite 100 years of research, plant cell cytokinesis remains a poorly understood process at the molecular level because of the difficulties associated with the identification and characterization of the numerous structures involved in phragmoplast, cell plate, and cell wall formation. Light microscopy has yielded critically important insights into the dynamics of the formation of these structures in living cells. However, none of the currently available light microscopic techniques is able to resolve the individual cytoskeletal elements of the phragmoplast, the Golgi-derived vesicles that fuse to form the cell plate, and the membrane intermediates that give rise to the new cell wall. More detailed information on these structures can be produced by means of electron microscopy of thin sections of chemically fixed cells (Hepler and Newcomb, 1967; Gunning, 1982) and of high-pressure frozen and freeze-substituted cells (Samuels et al., 1995; Otegui and Staehelin, 2000a). These studies also have enabled researchers to establish potential sites of action of drugs (Heese et al., 1998) and mutations (Nacry et al., 2000) that perturb plant cell cytokinesis.
However, the limits of this type of electron microscopy become most apparent when attempts are made to extract 3-D structural information from the essentially two-dimensional images of the structures of interest. In addition, thin section electron microscopy does not allow one to accurately calculate surface areas and volumes of interesting cellular structures or even to determine their absolute numbers. The current study demonstrates that these and other quantification problems can be overcome by combining fast freezing followed by freeze substitution with dual-axis electron tomography. The ∼6-nm resolution of this new methodology yields information about the architecture of cellular structures that can be used to investigate cell plate formation and other cellular processes in ways that were inconceivable even a few years ago. At the same time, we would like to emphasize that the electron tomographic approach used in this study does not substitute for but complements the information contained in the actual micrographs of the cryofixed/freeze-substituted specimens.
Vesicle Transport along Microtubules to the Cell Plate Appears to Be by Kinesin-Like Motor Proteins
Cell wall formation requires the delivery of Golgi-derived vesicles to the site of wall assembly. In growing pollen tubes, the vesicles are transported from Golgi stacks to the growing tip region along actin filament bundles with the help of a myosin-type motor activity (Asada and Collings, 1997). In contrast, during cytokinesis, the vesicles are assumed to be transported along phragmoplast microtubules to the site of cell plate assembly. Two lines of indirect evidence support this assumption. In electron micrographs of both intact cells (Samuels et al., 1995; Otegui and Staehelin, 2000a) and isolated phragmoplast–nuclei complexes (Kakimoto and Shibaoka, 1988), vesicles are seen in close association with microtubules. Similarly, cell plate formation in somatic cells is disrupted completely by microtubule depolymerization (Whaley et al., 1966) but not by the disruption of actin filaments with cytochalasin (Mineyuki and Palevitz, 1990). It also has been postulated that this microtubule-based transport is mediated by a plus end–directed kinesin or kinesin-like protein. However, although three kinesin proteins with plus end–directed activity, TKRP125 from tobacco (Asada et al., 1997), AtPAKRP1 from Arabidopsis (Lee and Liu, 2000), and DcKRP120-2 from carrot (Barroso et al., 2000), have been shown to be present in mitotic spindles and phragmoplasts, none of them appears to be related to vesicle transport during cytokinesis.
As shown in Figure 3, a high proportion of the vesicles seen in our specimens were located within 30 nm of a microtubule surface, the distance that separates vesicles connected to microtubules via linker proteins (Figure 2C). These connecting structures resemble the kinesin molecules seen in deep-etch replicas of microtubules and latex beads incubated with bovine brain kinesin and in the linking elements between the microtubules and membrane-bounded organelles of neurons (Hirokawa et al., 1989). Interestingly, even though the bovine brain kinesin molecules were ∼80 nm long, the bridging elements connecting the organelles and latex beads to the microtubules measured only ∼25 nm. According to Hirokawa et al. (1989), this discrepancy is attributed to the fact that the large molecular domain from the hinge region to the C-terminal region is closely apposed to the vesicle or latex bead surface, leaving only an ∼25-nm domain to bridge the microtubule and the vesicle. Our data also suggest that most vesicles are propelled along the phragmoplast microtubules with the help of two kinesin or kinesin-like proteins or, in a few cases, with one such protein (Figure 2C). Together, these findings present some of the strongest evidence for the involvement of kinesin-like proteins in the transport of Golgi-derived vesicles to forming cell plates.
New Mini-Phragmoplasts Are Produced de Novo during All Stages of Syncytial-Type Cell Plate Formation
A critical difference between somatic- and syncytial-type cell plate assembly involves the origin and organization of the phragmoplasts within which the cell plates are formed (Otegui and Staehelin, 2000a, 2000b). Whereas the phragmoplasts of somatic cells derive from anaphase spindle remnants, the mini-phragmoplasts of syncytial cells arise at areas of overlap between clusters of microtubules that radiate from the surfaces of adjacent nuclei (Van Lammeren, 1988). Sets of aligned mini-phragmoplasts then act in concert to initiate and grow individual networks that expand and merge into the larger, coherent cell plates that give rise to the new cell walls.
We have observed that while the original sets of cell plate–forming networks continue to expand and the microtubules become displaced to the outside of the network, peripheral groups of microtubules also can assemble into mini-phragmoplasts capable of initiating new networks (Figure 4D, top right). This means that cell plate expansion in syncytial cells is driven by two mechanisms: the expansion of existing networks by the addition of new vesicles and the generation of new mini-phragmoplasts.
How are new cell plate–forming sites established? We postulate that this process starts with the assembly of the ribosome-excluding matrix from scaffolding molecules that are delivered to the new site with the help of kinesin-like molecules along opposing sets of microtubules. Once assembled, this matrix becomes capable of both inducing the fusion of arriving vesicles and mediating the subsequent cell plate maturation steps. The transport of scaffolding-type proteins along microtubules with the help of kinesin-like molecules to the sites of assembly of signaling complexes has been documented in animal cells (Verhey et al., 2001).
Hourglass-Shaped Vesicle Fusion Intermediates Are Formed during All Stages of Syncytial-Type Cell Plate Formation
Our previous model of syncytial-type cell plate assembly (Otegui and Staehelin, 2000a) was based on the careful analysis of hundreds of thin-section electron micrographs. One of the unexpected findings of that study was that the initial fusion of the Golgi-derived, cell plate–forming vesicles did not involve membrane fusion tubes, as seen in somatic-type cell plate formation (Samuels et al., 1995), but instead involved hourglass-shaped vesicle fusion intermediates. However, because of the difficulty of visualizing the ∼20-nm-diameter fusion tubes in thin sections, we could not preclude the possibility that we had simply missed them in our micrographs. Figures 4A and 4D demonstrate that this was not the case. Neither during the earliest stages of cell plate formation (Figure 4A) nor during the subsequent wide tubular stage of cell plate growth (Figure 4D) could we find any evidence for membrane fusion tubes. Thus, the presence/absence of fusion tubes constitutes a critical difference between somatic-type and syncytial-type cell plate formation.
The four tomographic models depicted in this study contain a total of seven hourglass-shaped intermediates, and each of these can be viewed in the context of all of the surrounding membrane structures. These data suggest that hourglass-shaped vesicle fusion intermediates are produced at cell plate growth sites during all stages of syncytial-type cell plate formation and that they constitute the initial step in cell plate assembly.
Syncytial-Type Cell Plates Possess Highly Complex Membrane Configurations That Are Nearly Impossible to Decipher in Thin-Section Micrographs
Conversion of the wide tubular networks (Figure 4D) into planar fenestrated sheets (Figure 7C) involves some of the most unusual membrane transformations discovered to date (Figures 7A, 7B, and 8). In our previous article (Otegui and Staehelin, 2000a), we postulated that the wide tubular network is first converted into a thin tubular network and then into a fenestrated sheet. As illustrated in Figures 7A, 7B, and 8, however, this interpretation was wrong. Our findings indicate that structures previously interpreted as thin tubules were actually cross-sectional views of unusually convoluted fenestrated membrane sheets. At the same time, we confirm that the convoluted membrane sheets possess the highest density of clathrin-coated buds involved in the removal of excess membrane material. As this membrane material is removed, the more cavernous-type membrane configurations seen in Figure 7A are gradually replaced by overlapping membrane “flaps” (Figures 7B and 8) that then become consolidated into planar fenestrated sheets (Figures 7C and 13).
While these membrane transformation events are taking place in the more mature regions of the cell plates, growing wide tubules continue to expand the cell plate around its margins. Finally, when these wide tubules reach the mother cell plasma membrane, the individual wide tubules fuse with the membrane, thereby linking the cell plate to the syncytial cell wall (Figure 7C).
The ADL1A Dynamin-Like Proteins Pinch but Do Not Fission Membrane Tubules
The large GTPase dynamin family comprises mechanoenzymes that in animal cells are involved in constructing and severing membrane vesicles and tubules. In vitro, they also exhibit the ability to self-assemble into helical polymers (Zhang et al., 2000). Two dynamin-like proteins, phragmoplastin from soybean (Gu and Verma, 1996, 1997; Zhang et al., 2000) and its Arabidopsis homolog, Arabidopsis dynamin-like protein (ADL1; Lauber et al., 1997), localize to somatic-type cell plates during cytokinesis. The ADL1 family comprises five proteins, ADL1A through ADL1E. ADL1A has been shown not only to localize to cell plates but also to play a critical role in plant development (Kang et al., 2001).
Our tomograms exhibit rings that constrict membrane tubes of syncytial-type cell plates. Based on their dimensions, their helical substructures, and the immunolabeling shown in Figure 6, we postulate that these spiral structures are ADL1A polymers. What distinguishes these dynamin-like spirals from those seen in other systems is that they produce ∼20-nm-wide membrane constrictions but do not fission the membrane tubules. Furthermore, the coexistence of numerous constricted membrane domains lacking the dynamin-like spirals suggests that these pinching spirals are transient structures (i.e., they assemble around membrane tubules, they constrict, and then they break down). This dynamin cycling mechanism may contribute a novel dynamic mechanism for maintaining membranes in a tubular state for prolonged periods of time.
Because the budding of clathrin-coated vesicles and possibly the formation of fusion tubes in somatic-type cell plates also involve dynamin-like (phragmoplastin) molecules, it will be interesting to determine the specific sites of action of the others ADL1 homologs. The recent discovery that the Arabidopsis dynamin II homolog, AtDH (Verma, 2001), also associates with cell plates adds yet another dimension to this problem.
Changes in the Volume of Cell Plate Intermediates Could Be Related to Callose Synthesis and Breakdown
The changes in membrane surface area and volume of the different cell plate intermediates illustrated in Figure 9 are considerably greater than we had anticipated. They also provide strong evidence for the correlation of changes in cell plate architecture and biosynthetic activities at different stages of cell plate formation. The close correlation between the number of vesicles needed to account for both the surface area and the volume of the wide tubular network (cf. Figures 9A and 9B) suggests that the formation of the wide tubular network involves vesicle fusion events but no cell plate–associated biosynthetic activities. Thus, the composition of the membranes and the lumenal contents (mainly xyloglucans and pectic polysaccharides) (Otegui and Staehelin, 2000a, 2000b) of the wide tubular network would appear to be equivalent to the Golgi-derived vesicles from which it is formed.
In contrast, the discrepancy between the number of vesicle equivalents needed to account for the membrane changes versus the volume changes associated with the conversion of wide tubular networks into convoluted fenestrated sheets (Figure 9, WTN and CFS) suggests that this transformation involves more than simply the fusion of more vesicles with the cell plate. Specifically, the volume equivalent changes are more than threefold greater than the membrane surface equivalent changes. As shown previously, the structural changes associated with the transformation from wide tubular network to convoluted fenestrated sheet are accompanied by a rapid accumulation of callose and a lesser amount of cellulose (Samuels et al., 1995; Otegui and Staehelin, 2000a). Because both of these polymers are synthesized by enzymes in the cell plate membrane (Samuels et al., 1995; Hong et al., 2001a, 2001b), the dramatic increase in cell plate volume most likely is caused by the accumulation of these polymers in the cell plate lumen.
A significant amount of this extra cell plate volume disappears during the next transformation step, the conversion of the convoluted to the planar fenestrated sheet (Figure 9B). This volumetric loss may be explained by the partial breakdown of callose. Previously, it has been hypothesized that the forces needed to convert cell plate tubules into fenestrated sheets come from the synthesis of callose, which spreads over the membrane surface as it is deposited (Samuels et al., 1995). The loss in cell plate volume after the completion of the tubule-to-sheet conversion may be explained by the removal of callose. This partial loss in callose is offset, in part, by a concomitant increase in cellulose (Otegui and Staehelin, 2000a), which together with xyloglucans and pectins forms the primary cell wall (Brett, 2000).
Approximately 1.5 Million Vesicles Are Required to Produce the Walls around an Endosperm Cell
The dual-axis high-voltage electron tomography data presented in this study have produced not only more detailed insights into the 3-D architecture of different cell plate intermediates but also quantitative surface area and volumetric information about these structures. As documented in Figure 9A, ∼1230 noncoated Golgi-derived vesicle equivalents are needed to build 1 μm2 of cell plate. Because an average Arabidopsis endosperm cell wall has a surface area of ∼400 μm2 (20 × 20 μm2), the assembly of this wall would require ∼500,000 vesicle equivalents. Considering that, on average, six cell walls are built around each nuclear cytoplasmic domain and two such domains contribute to the assembly of each wall (Otegui and Staehelin, 2000a), every nuclear cytoplasmic domain has to build approximately six half cell walls. In other words, the Golgi stacks contained in every cytoplasmic domain have to produce a total of ∼1.5 million vesicles to cellularize the endosperm. Interestingly, 75% of the membrane surface provided by these vesicles is removed during cell plate maturation.
METHODS
Seed of Arabidopsis thaliana (Landsberg erecta wild type) were planted in Metro-Mix 200 growing medium with Arabidopsis controlled release fertilizer 17-6-12 + micronutrients (Lehle Seeds, Round Rock, TX). Plants were grown in continuous fluorescent lighting at a temperature of 24 ± 1°C and a relative humidity of 45%. Developing seed were excised at various hours after anthesis.
High-Pressure Freezing and Freeze Substitution
Whole developing seed were removed from plants and immediately loaded in sample holders filled with 0.1 M sucrose. The samples were frozen in a Baltec HPM 010 high-pressure freezer (Technotrade, Manchester, NH) and then transferred to liquid nitrogen for storage. Substitution was performed in 2% OsO4 in anhydrous acetone at −80°C for 72 hr, followed by slow warming to room temperature over a period of 2 days. After several acetone rinses, samples were teased from the holders and infiltrated in Epon resin (Ted Pella, Inc., Redding, CA) according to the following schedule: 5% resin in acetone (4 hr), 10% resin (12 hr), 25% resin (12 hr), and 50, 75, and 100% resin (24 hr at each concentration). Polymerization was performed at 60°C. For immunolabeling, some high pressure frozen samples were substituted in 0.1% uranyl acetate plus 0.2% glutaraldehyde in acetone at −80°C for 72 hr and warmed to −20°C for 24 hr. After several acetone rinses, these samples were infiltrated with Lowicryl HM20 (Electron Microscopy Sciences, Fort Washington, PA) during 48 hr and polymerized at −50°C under UV light for 72 hr.
Immunolabeling of ADL1A
We used three different polyclonal antibodies raised against three different peptide sequences of ADL1A. The antibody anti-ADL1A has been shown to be specific for this protein and does not cross-react with any other member of the ADL1 family (Kang et al., 2001), whereas the other two antibodies, CIW14 and CIW15, also have affinity for ADL1E. Samples embedded in Lowicryl HM20 were sectioned and placed on formvar-coated nickel grids. The sections were blocked for 20 min with a 5% (w/v) solution of nonfat milk in TBS plus 0.1% Tween 20 (TBST). Primary antibodies were diluted 1:20 in a solution of 2.5% nonfat milk in TBST at room temperature for 1 hr. The sections were rinsed in a stream of TBS plus 0.5% Tween 20 and then transferred to the secondary antibody (anti–rabbit IgG 1:50 in TBST) conjugated to 10-nm gold particles for 1 hr. Control procedures were performed by omitting the primary antibody.
Sample Preparation for Electron Tomography
Epon (250 nm thick) was mounted on formvar-coated copper slot grids and stained with 2% uranyl acetate in 70% methanol and Reynold's lead citrate (2.6% lead nitrate and 3.5% sodium citrate, pH 12). After staining, 15-nm colloidal gold particles were added to both sides of the grid to be used as fiducial markers to align the series of tilted images. Finally, the grids were coated with carbon to enhance stability.
High-Voltage Electron Microscopy and Acquisition of Dual-Axis Tilt Series Images
The sections were mounted in a tilt-rotate specimen holder and observed with a JEM-1000 high voltage electron microscope (JEOL, Akishima, Tokyo, Japan) operating at 750 kV. The images were taken at ×12,000 from +60 to −60° at 1.5° intervals about two orthogonal axes (Mastronarde, 1997) and collected with a Gatan digital camera (Gatan, Pleasanton, CA) that covered an area of 1.4 × 1.4 μm2 and had a resolution of 1024 × 1024 pixels at a pixel size of 1.42 nm. To record larger areas, the digitized images of adjacent squares (three to six) were combined into montaged images; the software controlling the camera and microscope was able to reposition the image and focus the specimen after each tilt and to collect a montage of overlapping frames at each tilt.
Three-Dimensional (3-D) Tomographic Reconstruction
The images were aligned using the fiducial markers as described previously (Ladinsky et al., 1999). Tomograms were computed for each set of aligned tilts using the R-weighted back-projection algorithm (Gilbert, 1972). Merging of the two single-axis tomograms into a dual-axis tomogram involved a warping procedure rather than a single linear transformation (Mastronarde, 1997). This procedure was followed for each of the five analyzed sections. Of the resulting five tomograms, two corresponded to serial sections. These were aligned with each other and combined as described previously (Ladinsky et al., 1999) in a total reconstructed volume of 2.8 × 2.8 × 0.5 μm3, which consisted of 110 tomographic slices of ∼2.3 nm in thickness. The other three tomograms corresponded to reconstructed volumes of 2.8 × 2.8 × 0.25 μm3, 1.4 × 4.2 × 0.25 μm3, and 1.4 × 2.8 × 0.25 μm3 and yielded 157 tomographic slices. Based on the appearance of the unit membrane bilayer and other ultrastructural features, we estimate that the resolution in the x_–_y plane of our tomographic reconstructions is ∼6 nm. Because of the limited range of tilt angles, the resolution is 1.3 times worse in the z direction (i.e., ∼8 nm) (Mastronarde, 1997).
Three-Dimensional Modeling
Tomograms were displayed and analyzed with Imod, the graphics component of the IMOD software package (Kremer et al., 1996) using a Silicon Graphics (Mountain View, CA) computer. Membranous structures, microtubules, and vesicles were modeled as described previously (Ladinsky et al., 1999; Marsh et al., 2001). Clathrin coats on vesicle and budding structures were identified by the presence of the clathrin lattice. Once a model was completed, meshes of triangles were computed to define the surface of each object (Kremer et al., 1996). Because the initial exposure to the electron beam causes some degree of dividing the section thickness by the calculated tomographic volume reduction in the section thickness (i.e., 250 nm ÷ 150 nm = 1.6), we calculated the thinning factor for each tomogram and corrected the tomogram's dimension along the z axis to obtain accurate proportions for displaying models and measuring length distributions.
The “image slicer” tool of Imod was used to display and analyze slices extracted from the tomogram in any position or orientation. This tool was particularly useful for studying the morphology of microtubule ends and the linkers between vesicles and microtubules.
Three-Dimensional Analysis
The spatial relationship between microtubules and vesicles was determined by measuring distances between objects in three dimensions and computing an average density of neighboring items as a function of distance between objects using the program MTK (Marsh et al., 2001). Distances were measured from the central axis of microtubules to the surface of vesicles. By subtracting the microtubule radius, we calculated the distances between the microtubule surface and vesicles. The graphs depicting the actual spatial relationship between microtubules and vesicles were compared with graphs based on randomly arranged items. This random distribution was obtained by shifting vesicles to new positions within the 3-D volume and rejecting positions that shifted objects outside the modeled region or that resulted in collisions between objects (Marsh et al., 2001).
To calculate the plasma membrane surface area and volume of all cell plate assembly intermediates, we extracted randomly located boxes of 1 × 1 × 0.2 μm3 along the cell plate. Using the object meshes and the Imodinfo program, we calculated the membrane surface area and volume in these boxes. Only those boxes that included the whole thickness of the cell plate were considered. A total of 30 boxes were analyzed per each cell plate developmental stage. Multiplying these values by a factor of 5, we obtained the unit membrane surface area and the volume of the cell plate pieces contained in a 1-μm3 box. Because contours were placed in the middle of the cell plate membrane, the interior volume was calculated by subtracting the surface area × 3.5 nm (half of the membrane thickness) from the volume inside the contours (Marsh et al., 2001).
Also using Imodinfo, we calculated the density of ribosomes in 5 × 10⁻⁴ μm3 boxes (relative ribosome density) extracted from the 3-D models between 0 and 100 nm, 100 and 200 nm, and 200 and 300 nm from the membranes of different cell plate assembly intermediates. We averaged the relative ribosome density of 25 boxes for every cell plate stage and distance from the plasma membrane.
Availability of Softwares and Tomogram Files
The IMOD software package can be downloaded from http//bio3D.colorado.edu/imod/. The disks containing the tomogram files that run on the Imod program can be obtained upon request to L.A. Staehelin. However, it should be noted that the files are very large and that viewing requires specially configured computers.
Supplementary Material
[Supplemental Data]
Acknowledgments
We thank Dr. Søren Møgelsvang and Andreas Nebenführ as well as Bryon Donohoe for critical reading of the manuscript and Roberta Capp for help with manuscript preparation. This work was supported by National Institutes of Health Grant 59787 to L.A.S. and Fulbright/Antorchas Foundation, Keck Foundation, and Consejo Nacional de Investigaciones Científicas y Técnicas, Argentina, postdoctoral fellowships to M.S.O.
Footnotes
W⃞
Online version contains Web-only data.
References
- Asada, T., and Collings, D. (1997). Molecular motors in higher plants. Trends Plant Sci. 2 29–36. [Google Scholar]
- Asada, T., Kuriyama, R., and Shibaoka, H. (1997). TKRP125, a kinesin-related protein involved in the centrosome-independent organization of the cytokinetic apparatus in tobacco BY-2 cells. J. Cell Sci. 110 179–189. [DOI] [PubMed] [Google Scholar]
- Barroso, C., Chan, J., Allan, V., Doonan, J., Hussey, P., and Lloyd, C. (2000). Two kinesin-related proteins associated with the cold-stable cytoskeleton of carrots cells: Characterization of a novel kinesin, DcKRP120-2. Plant J. 26 859–868. [DOI] [PubMed] [Google Scholar]
- Brett, C.T. (2000). Cellulose microfibrils in plants: Biosynthesis, deposition, and integration into the cell wall. Int. Rev. Cytol. 199 161–199. [DOI] [PubMed] [Google Scholar]
- Brown, R.C., and Lemmon, B.E. (1992). Cytoplasmic domain: A model for spatial control of cytokinesis in reproductive cells of plants. EMSA Bull. 22 48–53. [Google Scholar]
- DeMason, D.A. (1997). Endosperm structure and development. In Cellular and Molecular Biology of Plant Seed Development, B.A. Larkins and I.K. Vasil, eds (Dordrecht, The Netherlands: Kluwer Academic Publishers), pp. 73–115.
- Gilbert, P.F.C. (1972). The reconstruction of a three-dimensional structure from projections and its application to electron microscopy. II. Direct methods. Proc. R. Soc. Lond. B 182 89–102. [DOI] [PubMed] [Google Scholar]
- Gu, X., and Verma, D.P.S. (1996). Phragmoplastin, a dynamin-like protein associated with cell plate formation in plants. EMBO J. 15 695–704. [PMC free article] [PubMed] [Google Scholar]
- Gu, X., and Verma, D.P.S. (1997). Dynamics of phragmoplastin in living cells during cell plate formation and uncoupling of cell elongation from the plane of cell division. Plant Cell 9 157–169. [DOI] [PMC free article] [PubMed] [Google Scholar]
- Gunning, B.E.S. (1982). The cytokinetic apparatus: Its development and spatial regulation. In The Cytoskeleton in Plant Growth and Development, C.W. Lloyd, ed (London: Academic Press), pp. 229–292.
- Heese, M., Ulrike, M., and Jürgens, G. (1998). Cytokinesis in flowering plants: Cellular process and developmental integration. Curr. Opin. Plant Biol. 1 486–491. [DOI] [PubMed] [Google Scholar]
- Hepler, P.K., and Newcomb, E.H. (1967). Fine structure of cell plate formation in the apical meristem of Phaseolus roots. J. Ultrastruct. Res. 19 498–513. [DOI] [PubMed] [Google Scholar]
- Hirokawa, N., Pfister, K.K., Yorifuji, H., Wagner, M., Brady, S., and Bloom, G. (1989). Submolecular domains of bovine brain kinesin identified by electron microscopy and monoclonal antibody decoration. Cell 56 867–878. [DOI] [PubMed] [Google Scholar]
- Hong, Z., Delauney, A.J., and Verma, D.P.S. (2001. a). A cell plate–specific callose synthase and its interaction with phragmoplastin. Plant Cell 13 755–768. [DOI] [PMC free article] [PubMed] [Google Scholar]
- Hong, Z., Zhang, Z., Olson, J.M., and Verma, D.P.S. (2001. b). A novel UDP-glucose transferase is a part of the callose synthase complex and interacts with phragmoplastin at the forming cell plate. Plant Cell 13 769–780. [DOI] [PMC free article] [PubMed] [Google Scholar]
- Kakimoto, T., and Shibaoka, H. (1988). Cytoskeletal ultrastructure of phragmoplast-nuclei complexes isolated from cultured tobacco cells. Protoplasma 2 95–103. [Google Scholar]
- Kang, B.-H., Busse, J.S., Dickey, C., Rancour, D.M., and Bednarek, S.Y. (2001). The Arabidopsis cell-plate-associated dynamin-like protein, ADL1Ap, is required for multiple stages of plant growth and development. Plant Physiol. 126 47–68. [DOI] [PMC free article] [PubMed] [Google Scholar]
- Kremer, J.R., Mastronarde, D.N., and McIntosh, J.R. (1996). Computer visualization of three-dimensional image data using IMOD. J. Struct. Biol. 116 71–76. [DOI] [PubMed] [Google Scholar]
- Ladinsky, M.S., Mastronarde, D.N., McIntosh, J.R., Howell, K.E., and Staehelin, L.A. (1999). Golgi structure in three dimensions: Functional insights from the normal rat kidney cell. J. Cell Biol. 144 1135–1149. [DOI] [PMC free article] [PubMed] [Google Scholar]
- Lauber, M.H., Waizenegger, I., Steinmann, T., Schwarz, H., Mayer, U., Hwang, I., Lukowitz, W., and Jürgens, G. (1997). The Arabidopsis KNOLLE protein is a cytokinesis-specific syntaxin. J. Cell Biol. 139 1485–1493. [DOI] [PMC free article] [PubMed] [Google Scholar]
- Lee, Y.-R.J., and Liu, B. (2000). Identification of a phragmoplast-associated kinesin-related protein in higher plants. Curr. Biol. 10 797–800. [DOI] [PubMed] [Google Scholar]
- Marsh, B.J., Mastronarde, D.N., Buttle, K.F., Howell, K.E., and McIntosh, J.R. (2001). Organellar relationships in the Golgi region of the pancreatic beta cell line, HIT-T15, visualized by high resolution electron tomography. Proc. Natl. Acad. Sci. USA 98 2399–2406. [DOI] [PMC free article] [PubMed] [Google Scholar]
- Mastronarde, D.N. (1997). Dual-axis tomography: An approach with alignment methods that preserve resolution. J. Struct. Biol. 120 343–352. [DOI] [PubMed] [Google Scholar]
- Mineyuki, Y., and Palevitz, B.A. (1990). Relationship between preprophase band organization, F-actin and the division site in Allium: Fluorescence and morphogenetic studies on cytochalasin-treated cells. J. Cell Sci. 97 283–295. [Google Scholar]
- Nacry, P., Mayer, U., and Jürgens, G. (2000). Genetic dissection of cytokinesis. Plant Mol. Biol. 43 719–733. [DOI] [PubMed] [Google Scholar]
- Otegui, M., and Staehelin, L.A. (2000. a). Cytokinesis in flowering plants: More than one way to divide a cell. Curr. Opin. Plant Biol. 3 493–502. [DOI] [PubMed] [Google Scholar]
- Otegui, M., and Staehelin, L.A. (2000. b). Syncytial-type cell plates: A novel kind of cell plate involved in endosperm cellularization of Arabidopsis. Plant Cell 12 933–947. [DOI] [PMC free article] [PubMed] [Google Scholar]
- Pickett-Heaps, J.D., Gunning, B.E.S., Brown, R.C., Lemmon, B.E., and Cleary, A.L. (1999). The cytoplast concept in dividing plant cells: Cytoplasmic domains and the evolution of spatially organized cell division. Am. J. Bot. 86 153–172. [PubMed] [Google Scholar]
- Samuels, A.L., Giddings, T.H., and Staehelin, L.A. (1995). Cytokinesis in tobacco BY-2 and root tip cells: A new model of cell plate formation in higher plants. J. Cell Biol. 130 1–13. [DOI] [PMC free article] [PubMed] [Google Scholar]
- Van Lammeren, A.M.M. (1988). Structure and function of the microtubular cytoskeleton during endosperm development in wheat: An immunofluorescence study. Protoplasma 146 18–27. [Google Scholar]
- Verhey, K.J., Meyer, D., Deehan, R., Blenis, J., Schnapp, B.J., Rapoport, T.A., and Margolis, B. (2001). Cargo of kinesin identified as JIP scaffolding proteins and associated signaling molecules. J. Cell Biol. 152 959–970. [DOI] [PMC free article] [PubMed] [Google Scholar]
- Verma, A.P.S. (2001). Cytokinesis and building of the new cell plate in plants. Annu. Rev. Plant Physiol. Plant Mol. Biol. 52 751–784. [DOI] [PubMed] [Google Scholar]
- Whaley, W.G., Dauwalder, M., and Kephart, J.E. (1966). The Golgi apparatus and an early stage in cell plate formation. J. Ultrastruct. Res. 15 169–180. [DOI] [PubMed] [Google Scholar]
- Wolfe, J., and Steponkus, P.L. (1983). Mechanical properties of the plasma membrane of isolated plant protoplast. Plant Physiol. 71 276–285. [DOI] [PMC free article] [PubMed] [Google Scholar]
- Zhang, Z., Hong, Z., and Verma, D.P.S. (2000). Phragmoplastin polymerizes into spiral coiled structures via intermolecular interaction of two self-assembly domains. J. Biol. Chem. 275 8779–8784. [DOI] [PubMed] [Google Scholar]
Associated Data
This section collects any data citations, data availability statements, or supplementary materials included in this article.
Supplementary Materials
[Supplemental Data]
