Genetic regulators of large-scale transcriptional signatures in cancer (original) (raw)
. Author manuscript; available in PMC: 2006 Oct 1.
Published in final edited form as: Nat Genet. 2006 Mar 5;38(4):421–430. doi: 10.1038/ng1752
Abstract
Gene expression signatures encompassing dozens to hundreds of genes have been associated with many important parameters of cancer, but mechanisms of their control are largely unknown. Here we present a method based on genetic linkage that can prospectively identify functional regulators driving large-scale transcriptional signatures in cancer. Using this method we show that the wound response signature, a poor-prognosis expression pattern of 512 genes in breast cancer, is induced by coordinate amplifications of MYC and CSN5 (also known as JAB1 or COPS5). This information enabled experimental recapitulation, functional assessment and mechanistic elucidation of the wound signature in breast epithelial cells.
The advent of microarray technology has brought an onslaught of gene expression data. Over the past years, the global gene expression profiles of thousands of disease specimens, especially cancer, have been analyzed, and hundreds of gene expression signatures that are associated with disease progression, prognosis and response to therapy have been described1–5. However, owing to the large number of genes in each signature, it is not technically feasible to study the function of an expression signature as a whole. Thus, investigators are forced to study candidate genes individually or a handful of genes in multiplex fashion; such studies represent at best a limited assessment of the functional consequences of a signature. These limitations have also hampered the development of specific therapies that may target cancers on the basis of their gene expression signatures.
Gene expression signatures may arise in cancer samples for many reasons. Gene expression differences may reflect variations in the composition of cell types2, responses to different host environments, the accumulated effects of aneuploidy and epigenetic changes (acting in cis)6 or response to altered activities of key transcriptional regulators in cancer (acting in trans)7,8. Regulators, encoding transcriptional factors or signaling proteins whose activity controls hundreds of downstream genes, offer an efficient approach to experimentally reproduce and functionally assess the consequences of gene expression signatures. However, a signature may be controlled by one or more regulators that act in a conditional or combinatorial manner, and the regulator itself may not be part of the expression signature. Therefore, an unbiased genome-wide method is needed to identify functional regulators of gene expression signatures.
On the basis of the concept that molecular programs of normal wound healing might be reactivated in cancer metastasis9,10, we previously identified a ‘wound response signature’ from the stereotypic transcriptional response of fibroblasts to serum, the soluble fraction of clotted blood. The wound signature consisted of 512 genes related to cell growth, matrix remodeling, cell motility and angiogenesis; subsequent microarray analysis of wound healing in skin confirmed the rapid regulation of many of these genes by tissue injury in vivo11. In two-way hierarchical clustering, the expression pattern of these 512 genes separated tumors into two classes that have predominant expression of either serum-activated or quiescent genes5. Expression of the activated wound signature is a powerful predictor of metastasis and death in diverse types of primary human tumors5. In primary breast cancer, the wound signature provides prognostic risk stratification that is independent of traditional criteria such as lymph node status, grade and estrogen receptor status12. Because the wound signature is expressed in tumor cells and is a consistent feature in repeat sampling of tumors5, we thought that the wound signature might be genetically determined. Here we describe a general method, based on genetic linkage, to identify candidate functional regulators of expression signatures by intersecting genome-wide DNA copy number and gene expression data. We apply this method to identify genetic regulators of the wound signature in human breast cancers.
RESULTS
Linkage analysis by SLAMS
Linkage analysis aims to associate the pattern of genotype distribution with the pattern of phenotype distribution in a group of individuals in order to identify the likely genes that control the phenotype. In this case, the phenotype is the presence or absence of previously defined gene expression signatures in cancer samples. Because the genes involved in genome-wide linkage analyses far outnumber the number of samples (~10,000 genes versus ~50 samples in typical microarray studies of cancer), there is insufficient statistical power to map the linkage to the level of individual genes. Therefore, we devised a method, stepwise linkage analysis of microarray signatures (SLAMS), to initially map linkage of prospective regulator genes to large chromosomal regions and then subsequently refine and validate the list of candidate regulators within the linked region using additional sources of data. One useful strategy to improve robustness in gene expression analysis is to consider the coordinate behavior of groups of related genes instead of individual genes13,14. We adopt a similar approach to overcome inherent noise within gene expression and DNA copy number data. Thus, the phenotype in the linkage analysis is defined by the coordinate behavior of many genes within a gene expression signature, and linkage to chromosomal regions is established by coordinate amplification or deletion of several neighboring loci.
SLAMS is a four-step strategy to find regulator genes for which an aberration in copy number could induce a gene expression signature in cancer (Fig. 1). First, tumors are sorted into two groups by the presence or absence of the signature. Second, using genomic DNA copy number data of the same tumors, we rank the change in copy number of each gene on the basis of its ability to distinguish samples with and without the signature. The association between change in copy number and expression signature is calculated by comparing the observed data with randomized data obtained by permutation, implemented using the algorithm Significance Analysis of Microarrays (SAM)15. Amplifications and deletions that are associated with the signature are represented as upward and downward deflections from the 45° line in a plot comparing observed data in the _y_-axis and expected data from permutation in _x_-axis. True amplifications or deletions will demonstrate linkage such that probes representing neighboring DNA sequences should also be enriched or depleted on the basis of the same selection. Therefore, we identify clustering of cDNA probes arising from contiguous DNA sequences in the ranked list and use the enrichment of neighboring probes to quantify the strength of linkage between a chromosomal locus and the signature. Third, candidate regulators encoded within the linked chromosomal locus are then filtered by their transcriptional regulation in appropriate expression data sets. We assume that if amplification of gene A is linked to a signature, then increased expression levels of gene A should also be associated with the signature. Conversely, linkage of gene deletion would predict association of gene repression with the signature. Candidate regulators can thus be filtered by the concordance of their mRNA expression pattern with the expression signature. Additional sources of information, such as the literature or expression profiles of relevant in vitro experiments, can also be used. Fourth, candidate regulators are further validated by the ability of their expression levels to predict the signature in additional tumor samples. The end result is a prediction of specific genes that are sufficient to regulate a gene expression signature.
Figure 1.
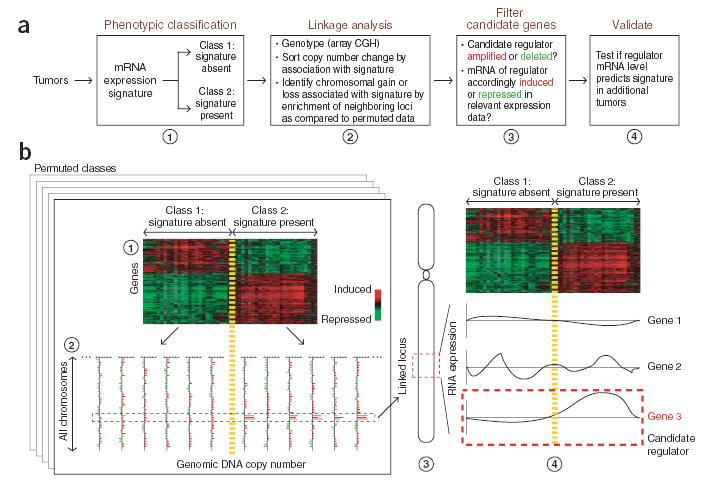
Overview of SLAMS analysis procedure. (a) Flow chart of steps in our strategy of mapping genetic regulators of expression signatures in cancer. (b) Example of the analysis on a gene expression signature and genome-wide DNA copy number data. Tumor samples are sorted into two classes on the basis of the presence of a binary gene expression signature (step 1). DNA copy numbers at all genome-wide loci are compared between these two classes of samples (step 2). Amplification of three neighboring genes is observed in 80% of samples with the signature but in 0% of samples without the signature, indicating genetic linkage. The predicted relationship between level of mRNA expression of the candidate genes and the expression signature is thus a positive correlation. Filtering (step 3) and validation (step 4) of the candidate genes shows that Gene 1 mRNA is negatively correlated with the signature, whereas Gene 2 mRNA is not correlated. Gene 3 mRNA is positively correlated with presence of the signature and emerges as the predicted regulator.
We applied our algorithm to 37 breast tumors that were analyzed for global gene expression patterns and mapped for DNA copy number change at 6,692 loci using array-based comparative genomic hybridization (aCGH)6. Comparison with permuted data showed that amplification of 57 DNA probes was observed in association with the wound signature more than expected by chance (Fig. 2a and Supplementary Table 1 online). Among these 57 amplified DNA sequences, 32 probes representing chromosome 8q were selected. There were 132 probes representing 8q out of 6,692 total probes on the array. The probability of encountering 32 of 132 probes from one chromosomal arm in 57 random trials can be estimated by the hypergeometric distribution, which showed that this result was extremely unlikely by chance alone (P = 3.4 × 10−41) and indicated strong linkage between amplification of a large region of 8q with the wound signature. The remaining 25 amplified DNA sequences mapped to 12 different chromosomal arms and did not show significant linkage. Although these tumors also harbor many regions of chromosomal loss6, none of these seemed to be associated with the wound signature. MYC, a well-known oncogenic transcription factor located on 8q24, is within the linked region. However, tumors with the wound signature uniformly had amplifications in proximal 8q, and a sizable fraction of tumors without wound signature carried amplifications in the 8q24 regions (Fig. 2b and Supplementary Fig. 1 online). This observation suggested that one or more genes on proximal 8q may collaborate with MYC to activate the wound signature.
Figure 2.
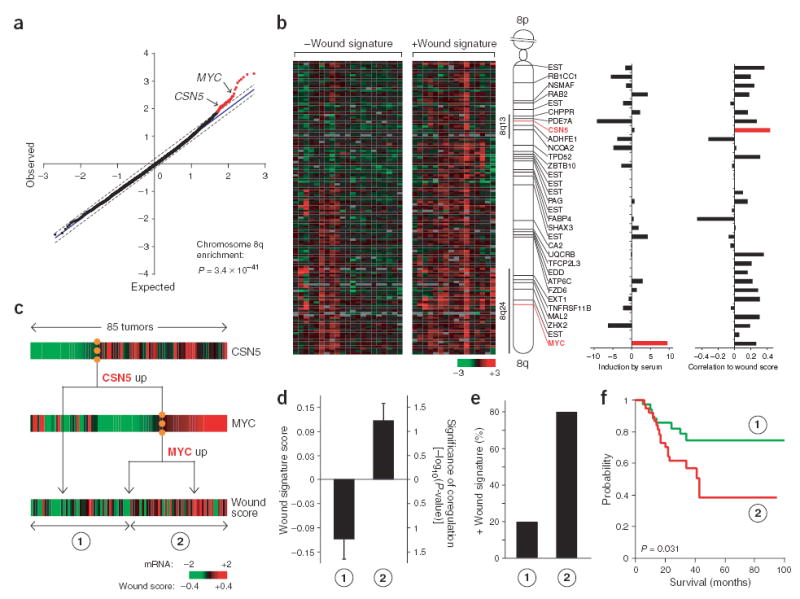
Linkage of MYC and CSN5 amplifications with wound signature. (a) Association of 8q amplification with wound signature. The greater signal in the observed data over the expected signal in permuted data indicates selective amplification in tumors with the wound signature (57 probes in red). (b) Amplification of regions of chromosome 8q in breast tumors. Array CGH data of 132 probes representing chromosome 8q is shown for breast tumors that show the wound signature (right, 16 arrays) or lack the wound signature (left, 21 arrays). Red indicates amplification, whereas green indicates deletion. The identity of 32 amplified probes linked to the wound signature (left), the degree of transcriptional induction by serum (middle) and the correlation of mRNA level to the wound score in 85 breast tumors (right) is shown. (c) CSN5 and MYC mRNA levels predict the wound signature. A decision tree model of CSN5 and MYC mRNA level was used to sort the 85 tumors into two groups. (d) Average wound scores (± s.e.m.) of the two groups. (e) Tumors with an activated wound signature (wound score ≥0.2) are enriched in group 2. (f) Kaplan-Meier survival curve of patients partitioned in c.
We next filtered the 32 amplified candidate genes in 8q on the basis of their mRNA expression patterns in 85 breast tumors3, 37 of which were used for aCGH. Because genomic DNA amplification of the candidate genes was associated with wound signature, we sought the subset of candidate genes whose mRNA level correlated with the wound signature in tumors. We tested the association between level of mRNA expression of candidate genes and the wound signature using a multiple regression analysis. The wound signature score (hereafter, wound score) is a measure of similarity (by Pearson’s correlation coefficient, R) between the expression pattern of 512 genes in the wound signature in a tumor sample and the previously defined pattern of the wound signature12. The level of mRNA expression of CSN5 (also known as JAB1 or COPS5), which is found on 8q13 and encodes the catalytic subunit of the COP9 signalosome16, showed the strongest positive correlation with the wound signature among tumor samples (Fig. 2b). Pairwise and iterative analysis of CSN5 with candidate regulators on distal 8q suggested that the combination of CSN5 with MYC mRNA was significantly associated with the wound score (P = 6.6 × 10⁻⁶), with both MYC (P = 0.028) and CSN5 (P = 10−5) providing independent information (see Methods for a detailed description of the analysis). Thus, these results predict that CSN5 and MYC function together to activate the wound signature.
To identify the optimal regulatory model of the wound signature in tumor samples on the basis of mRNA expression levels of MYC and CSN5, we carried out a decision tree analysis. We considered classification schemes of tumors based on MYC and CSN5 expression and asked if the resulting groups of tumors had differing activities of the wound signature. The decision tree method was as described12 and in essence was constructed using the best predictor to segregate samples and repeating the process in each of the resulting subgroups. Because the level of CSN5 mRNA expression is better correlated with wound score (Pearson’s R = 0.44) than MYC mRNA level is correlated with wound score (Pearson’s R = 0.26; Fig. 2b), a two-tiered decision tree involves first sorting samples by CSN5 mRNA level and then sorting by MYC mRNA level (Fig. 2c). We used the decision tree to assign the tumor samples to two groups of roughly equal sizes. Forty-three samples were assigned to group 1 and corresponded to samples with low CSN5 or MYC levels. Forty-two samples were assigned to group 2 and corresponded to tumors with moderate or high levels of both CSN5 and MYC. These two groups of tumors had a substantially different wound score (Fig. 2d). Furthermore, 80 percent of the samples with an activated wound signature (defined by wound score ≥0.2, as previously established5) were captured in group 2 (Fig. 2e). Moreover, a high expression level of both CSN5 and MYC is a significant predictor of poor patient survival in breast tumors (P = 0.031), with efficacy equivalent to that observed for the wound signature in this data set (Fig. 2f). These results indicate that CSN5 and MYC function together to induce a poor-prognosis program in human breast cancers.
To verify the association between wound signature and amplification of CSN5 and MYC, we quantified DNA copy number at CSN5 and MYC loci using quantitative microsatellite analysis (QuMA)17 in an independent set of 41 early breast tumor samples previously studied for wound signature activation12. Tumors with the wound signature had a significantly higher copy number of CSN5 and MYC genomic DNA (Fig. 3; P < 0.02, Student’s _t_-test). Because these results were obtained from a set of breast tumors completely separate from those used for SLAMS, they strongly support the link between CSN5 and MYC amplification and wound signature activation.
Figure 3.
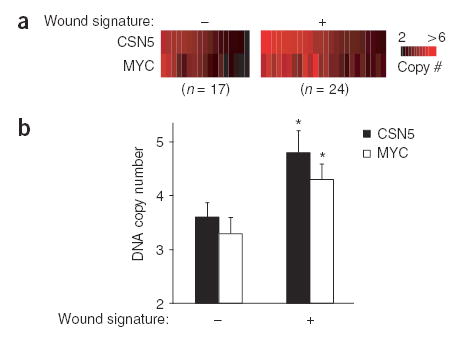
Association of MYC and CSN5 genomic DNA amplification with wound signature in an independent set of breast tumors. (a) DNA copy numbers of MYC and CSN5 in breast tumors with and without wound signature expression12, as determined by quantitative microsatellite analysis. (b) Copy number (mean ± s.e.m.) for tumors with and without a wound signature. *, P < 0.02, Student’s _t_-test.
The prediction of MYC and CSN5 as candidate regulators of the wound signature is further supported by several additional sources of information. Because the wound signature is based on the sustained transcriptional response of fibroblasts to serum stimulation at 48 h (ref. 5), we also examined candidate regulators for their expression in a detailed time course of fibroblast serum response, sampling 16 time points from 15 min to 36 h after stimulation5. Early-response genes have important regulatory roles in the serum response18, and candidate regulators of the serum response in vitro may also regulate the wound signature in vivo. MYC, a gene with a known early response to growth factor stimulation19, was strongly induced during the serum response (Fig. 2b), as were CSN5 and other CSN components, albeit more modestly (Supplementary Fig. 1). Furthermore, CSN6 is, in fact, a bona fide member of the wound signature. Overexpression of either MYC or CSN5 in fibroblasts can bypass the requirement for serum and induce S-phase entry20–22, suggesting that MYC and CSN5 can activate a subset of normally serum-responsive genes (the basis of the wound signature). Furthermore, MYC is required for the transcriptional response of fibroblasts in response to serum20. Finally, although wound signature genes are not enriched for chromosome 8q localization, they overlapped significantly with MYC target genes23 (23 overlap genes observed, versus four expected by chance alone; P < 10−8, hypergeometric distribution), suggesting a direct regulation of the wound signature by MYC.
Validation of wound signature regulation by MYC and CSN5
To experimentally validate the roles of MYC and CSN5 in wound signature and cancer progression, we transduced MCF10A cells, a nontransformed human breast epithelial cell line24, with MYC and/or CSN5 by retrovirally mediated gene transfer25. Global gene expression profiling of transduced cells grown in 0.1% serum showed that MYC and CSN5 were sufficient to activate the wound signature (Fig. 4a,b). MYC and CSN5 induced 201 of 255 genes representing the ‘activated’ wound signature, whereas 114 of 257 genes representing the ‘quiescent’ wound signature were correspondingly repressed (P < 10−19, χ2 test). CSN5 minimally activated the wound signature, whereas MYC partially activated the wound signature. We have previously established the link between incremental changes in the wound signature and metastasis risk by the wound score12. The magnitude of wound signature activation induced by MYC and CSN5 coexpression was comparable to the strongest wound scores in human breast cancers (Fig. 4b), corresponding to a 7.3-fold increased risk of death and 5.2-fold increased risk of metastasis12. To globally evaluate the consequence of MYC and CSN5 overexpression, we analyzed gene expression profiles of transduced MCF10A cells by gene module map, a method to quantify coordinate regulation of groups of functionally related genes within microarray data14. Analysis of 1,284 gene modules, including 1,256 Gene Ontology26 terms and 28 previously published prognostic gene expression signatures in breast cancer (Supplementary Table 2 online), showed that coexpression of MYC and CSN5 specifically activated the wound signature and several additional biological processes (Fig. 4c). Notably, among the 1,284 gene modules tested, the wound response signature was the most significantly induced module in cells expressing MYC and CSN5 (P < 10−10). Additional processes known to be regulated by MYC, such as RNA and nucleotide metabolism27, were induced by MYC but were even more strongly induced by coexpression of MYC and CSN5. Other prognostic signatures in breast cancer, including the basal-like3 and 70-gene4 signatures, were not activated by MYC and CSN5; thus, these signatures are under separate genetic control. Notably, gene modules related to mitochondria and oxidative stress were induced by MYC and CSN5 coexpression, and these same gene modules were observed in an independent group of human breast cancers with the wound signature (E. Segal, N. Friedman, D. Koller, H.Y.C. and A. Regev, unpublished data). To verify the specificity of these observations, we also examined coordinate regulation of the 1,284 gene sets in published gene expression profiles of MCF7 cells transduced with wild-type cyclin D1, another oncogene in breast cancer28. Although wild-type cyclin D1 overexpression induced gene modules indicative of cell cycle entry, it did not induce the wound or mitochondrial signatures (data not shown). Together, these results further validate our linkage analysis strategy and confirm that MYC and CSN5 are causative genetic lesions in breast cancers with the wound signature.
Figure 4.
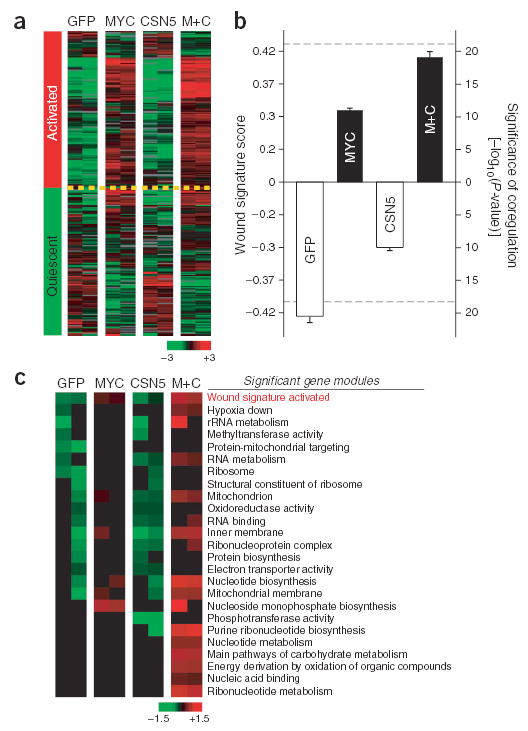
MYC and CSN5 activate the wound signature. (a) Expression of wound signature genes in transduced MCF10A cells after serum starvation. M+C represents MYC plus CSN5. Left column shows the canonical pattern of gene expression in wound signature. (b) Wound signature scores of samples in a (mean ± s.e.m.). Dashed lines indicate highest and lowest wound scores previously observed in 295 human breast tumors12. (c) Gene modules regulated by MYC and CSN5. Each row shows mean expression level of all genes in a module. From top to bottom, modules are in decreasing order of coregulation of member genes based on _P_-value. Only significant modules (P < 0.05, FDR < 0.05) are shown. Wound signature was the most significantly induced gene module by MYC and CSN5 out of all 1,284 input modules.
Functional consequences of wound signature activation
Invasive and metastatic tumor cells often show alterations in growth control, adhesion and polarity and acquire the ability to invade through basement membrane10. Normal cells can also demonstrate some of these properties in the context of wound healing10. We explored whether MCF10A cells induced to express the wound signature acquired additional properties associated with invasive cancer cells. First, expression of MYC and CSN5 together substantially increased cell proliferation compared with expression of either gene alone (Fig. 5a). Second, coexpression of MYC and CSN5 altered cell shape: the cells appeared round and less polarized and showed a marked loss of actin stress fibers and focal adhesion contacts (Fig. 5b). Third, coexpression of MYC and CSN5 significantly increased the ability of the cells to invade through three-dimensional basement membrane matrix (Matrigel) (P < 0.05, Student’s _t_-test; Fig. 5c). However, despite these alterations, MCF10A cells expressing both MYC and CSN5, or either gene singly, did not cause tumors in three months after subcutaneous injection in nude mice (data not shown). Thus, MYC and CSN5 can cooperate functionally to confer several properties associated with invasive tumor cells on untransformed breast epithelial cells, but they require additional genetic elements for full transformation.
Figure 5.
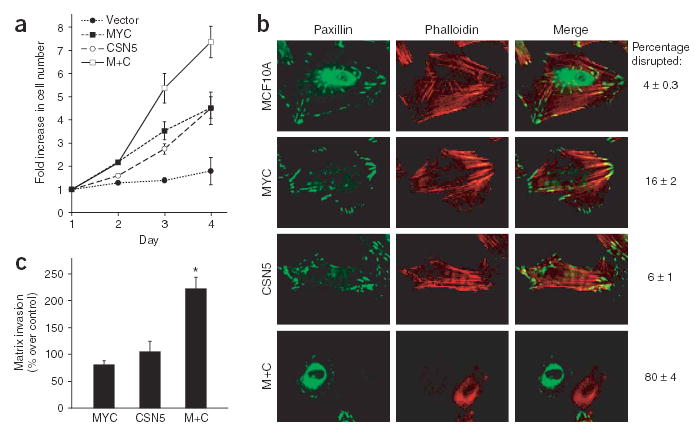
MYC and CSN5 induce features of invasive cancer cells. (a) Cell proliferation by daily counts of transduced MCF10A cells (mean ± s.e.m.). (b) Alterations in cell shape and adhesion. Frequency of disruption of focal adhesions (anti-paxillin, green) and actin stress fibers (TRITC-phalloidin, red) is shown (mean ± s.e.m.). (c) Cell invasion through Matrigel. Percentage increase over control cells (vector) is shown (mean ± s.e.m.). *, P < 0.05, Student’s _t_-test.
Mechanisms of gene regulation via interplay of MYC and CSN5
MYC protein stability and activity is regulated by at least two SKP1-CUL1-F-box protein (SCF) ubiquitin ligase complexes29. SCFFBW7 recognizes N-terminal MYC Box I and antagonizes MYC function by speeding its turnover30–32. In contrast, SCFSKP2 recognizes MYC Box II and C-terminal sequences and couples enhancement of MYC transcriptional activity with turnover33,34. CSN5 activates cullin-based ubiquitin ligase complexes by removing the NEDD8 modification from cullins16, and recent evidence from the yeast Schizosaccharomyces pombe indicated that this reaction stabilizes the associated F-box adaptor proteins35. Because CSN5 functionally cooperates with MYC, we reasoned that CSN5 may regulate MYC activity and turnover via SCFSKP2. Indeed, in MCF10A cells stably expressing CSN5 alone, endogenous MYC protein was depleted in a proteasome-dependent manner (Fig. 6a; lanes 1 and 3 versus 5 and 6). Overexpression of CSN5 increased the rate of MYC ubiquitination by threefold in a cell-based ubiquitination assay (Fig. 6b), and cycloheximide chase experiments confirmed that CSN5 strongly increased the turnover of MYC protein with similar efficacy as SKP2 (Fig. 6c). CSN5-induced turnover of MYC required components of the SCFSKP2 complex. Absence of exogenously added CUL1 or expression of dominant-negative SKP2LRR (which binds MYC but lacks the F-box to bind SKP1-CUL1 complex) completely inhibited CSN5-induced turnover of MYC (Fig. 6c).
Figure 6.
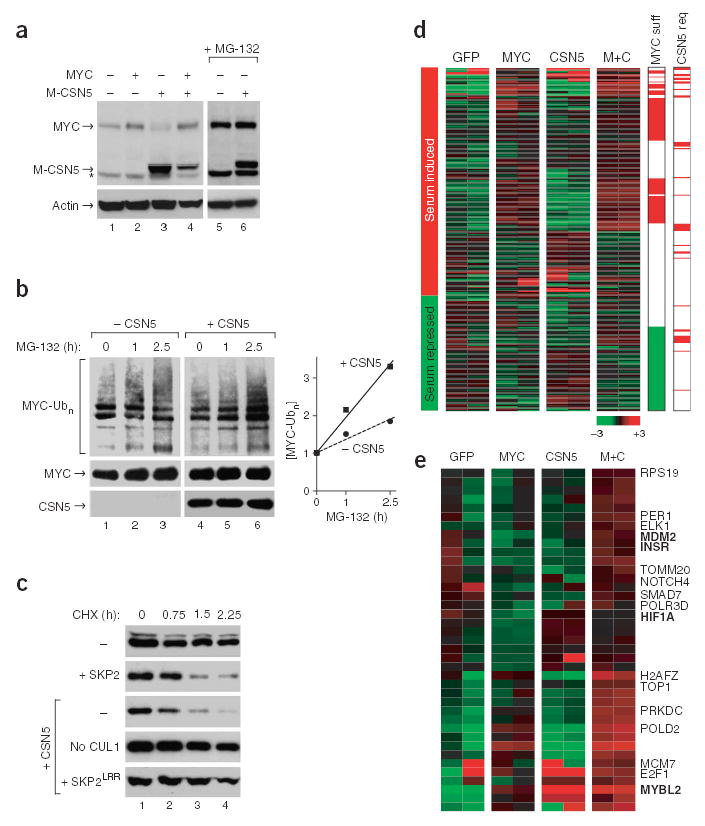
CSN5 induces MYC ubiquitination, turnover and activation of select MYC target genes. (a) Expression of MYC and CSN5 protein in transduced MCF10A cells. The CSN5 construct contains a MYC epitope tag. Two rightmost lanes: with proteasome inhibitor MG-132 (25 μM) 8 h before harvesting. *, nonspecific band. (b) Cell-based ubiquitination assay. Upper left: hemagglutinin (HA)-MYC conjugated with His-ubiquitin. Lower left: HA-MYC and HA-CSN5 in input U2OS cell lysates. Right: quantification of accumulation of ubiquitinated MYC relative to input MYC. (c) CSN5 induces MYC turnover via SCFSKP2. U20S cells were transfected with CUL1 and the indicated plasmids. HA-MYC protein at the indicated times after cycloheximide treatment (CHX, 100 μg ml−1) is shown. (d) Expression of 175 MYC target genes in transduced MCF10A cells after serum starvation. ‘MYC suff’, genes regulated by MYC expression alone; ‘CSN5 req’, genes that require CSN5 coexpression for full activation. Direction of regulation of genes by 5% serum is indicated at left. (e) Expression of the 39 genes highlighted by ’CSN5 req’ in d.
To assess the consequence of CSN5 expression on the transcriptional activity of MYC, we examined the expression of 175 endogenous MYC target genes23 in MCF10A cells expressing MYC and CSN5 (Fig. 6d,e). Although MYC expression mimicked the effect of serum stimulation on target gene expression in some cases, a subset of MYC target genes required coexpression of MYC and CSN5 for induction in low serum (Fig. 6e and Supplementary Table 3 online). No MYC target genes were repressed by CSN5 coexpression, suggesting that CSN5 specifically promotes transcription of select MYC target genes. MYC target genes that were activated by CSN5 coexpression included MDM2, a negative regulator of the tumor suppressor p53 and essential target for MYC-mediated transformation36,37; MYBL2, which is involved in cell cycle progression38; HIF1α, an activator of hypoxic response and angiogenesis38 and INSR, a tyrosine kinase receptor mediating cell proliferation, survival and motility38.
Conversely, reduction of endogenous CSN5 level by RNA interference stabilized MYC protein level and inhibited the ability of SKP2 to induce MYC turnover (Fig. 7a). SKP2 itself becomes unstable in the absence of CSN5 (Fig. 7b). Moreover, depletion of CSN5 stabilized a fusion protein containing the transactivation domain of MYC (residues 2–147) but strongly inhibited its transcriptional activity (Fig. 7c). Together, these results show that CSN5 is an essential activator of MYC transcriptional activity. By regulating MYC ubiquitination and protein stability through SCFSKP2, CSN5 increases the transcriptional potency of MYC toward select target genes to promote proliferation, survival and invasion.
Figure 7.
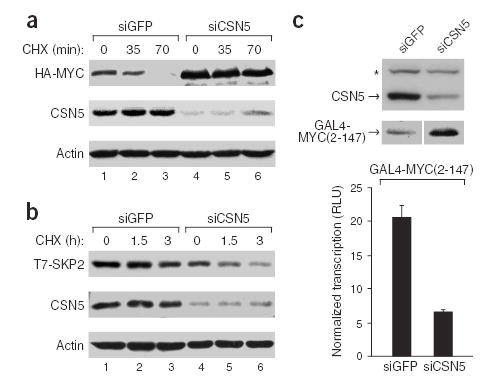
CSN5 is required for SKP2 activity, stability and transcriptional activity of MYC. (a) Endogenous CSN5 is required for SKP2-mediated MYC turnover. HEK293 cells were transfected with HA-MYC, T7-SKP2 and the indicated siRNA (siGFP is a negative control). HA-MYC and endogenous CSN5 protein at the indicated times after CHX treatment (150 μg ml−1) are shown. (b) CSN5 depletion destabilizes SKP2. U2OS cells were transfected with T7-SKP2, CUL1 and the indicated siRNA. T7-SKP2 and endogenous CSN5 protein at the indicated times after CHX treatment are shown. (c) CSN5 is required for MYC-mediated transcription. Top: siRNA-mediated silencing of endogenous CSN5 protein in 293 cells and expression of GAL4-MYC(2-147). *, nonspecific band. Bottom: relative luciferase units (RLU) of GAL4-MYC(2-147)-mediated transcription of a luciferase reporter gene normalized to input MYC levels (mean ± s.e.m.).
DISCUSSION
We have developed an integrated genomic approach that identifies genetic regulators of large-scale transcriptional signatures in human cancers. Our method applies classic genetic linkage to high-throughput genotyping and gene expression data and can provide new insights into regulation with limited biological knowledge. In the case of the wound signature, many oncogenes (such as FOS, JUN, cyclins and E2F) are known to be serum-inducible and are involved in the mitogenic response18 and thus could all be considered plausible candidate regulators. Likewise, additional oncogenes reside on chromosome 8q and are amplified together with MYC and CSN5. By combining the two types of data using SLAMS, we were able to filter many hypotheses and select the candidate genetic regulators best supported by available data. Thus, the predicted regulatory model from SLAMS enabled focused laboratory-based experiments confirming the roles of MYC and CSN5 in wound signature activation. We note that our method is general and may be used to identify the linkage between gene expression signatures and other types of genetic or epigenetic data, such as SNPs39,40 or DNA methylation maps41. For these other types of genetic data, the first and second steps of SLAMS will yield chromosomal regions that are linked to gene expression signatures, but additional methods tailored to specific experiments will be needed to filter and validate the candidate regulator genes. Another limitation is that our method requires human interpretation at several points in the procedure, which may introduce subjective bias. Our success using these relatively simple methods illustrates the robustness of the finding and lays the groundwork for devising more versatile and fully automated procedures based on SLAMS.
Our experience with the wound signature illustrates several advantages of finding genetic regulators of expression signatures in cancer. First, regulators may simplify the application of diagnostic signatures in the clinical setting. Instead of measuring the expression of 512 genes in the wound signature, the same prognostic information can be obtained by measuring the expression level of the two regulators, CSN5 and MYC (Fig. 2f). Second, knowledge of the regulators allowed us to activate the wound signature—specifically altering the expression level of hundreds of genes to the desired pattern—in untransformed breast epithelial cells to an extent seen in cancer samples (Fig. 4) and then to assess the functional consequences (Fig. 5). Third, the SLAMS method and functional validation can clarify the regulatory architecture of expression signatures in cancer and resolve signatures that are causally related versus those that merely occur at the same time. For example, gene expression profiling of cells expressing MYC and CSN5 showed that these two regulators activated the wound signature but not two other signatures (basal-like3 and 70-gene4) that are frequently coexpressed in poor-prognosis breast tumors12. Finally, our experiments pinpointed several proteins, including MYC, CSN5, SKP2 and the ubiquitin-proteasome system, that might be amenable to pharmacologic inhibition in high-risk breast cancers showing the wound signature. These findings suggest that our methods may be generally useful as a starting point in understanding the regulation and functions of gene expression signatures in cancer.
Expression of the wound signature, mediated by MYC and CSN5, in nontransformed breast epithelial cells is sufficient to induce rapid growth and invasiveness (Fig. 5) but is insufficient for transformation. Previous studies have shown that MYC overexpression requires additional genetic elements (notably, loss of tumor suppressor genes and activation of RAS) to transform human breast epithelial cells42,43. The concurrent induction of cell proliferation and invasion by MYC and CSN5 provides a means whereby precancerous cells with strong invasive activity could be positively selected. The wound signature therefore marks breast cancers that may have higher invasive and metastatic potential from its very origin. This prediction is supported by our previous observation that the wound signature is predictive of patient outcome even in the earliest T1 stage breast tumors12. Although we have examined the consequence of wound signature activation in untransformed cells, its full spectrum of biological consequences in transformed cells and in vivo should be examined in future studies.
Guided by the genomic and functional data, we show here that CSN5 is an important activator of MYC activity. CSN5 is believed to be a general activator of cullin-based ubiquitin ligase complexes16. Because MYC is regulated by two cullin-based complexes with opposite functional consequences, SCFSKP2 and SCFFBW7, a priori it would have been difficult to deduce whether CSN5 would activate or repress MYC activity. Our method predicts that CSN5 and MYC should cooperate functionally and that CSN5 activity may be a prerequisite for MYC activity (Fig. 2c). These predictions are supported by our functional studies in cells, profiling of MYC target genes and CSN5 gain- and loss-of-function biochemical experiments. Our results are consistent with activation of the recently described SKP2-mediated pathway by CSN5, coupling enhancement of MYC transcriptional potency with destruction33,34. Specifically, we found that CSN5 is required for SKP2 stability, similar to the mechanism described in S. pombe35. We suggest that the delicate interplay between MYC and CSN5 ensures a transient and tightly controlled program of wound response upon appropriate extracellular stimuli. Overexpression of CSN5 alone is unable to activate a wound signature, potentially because it quickly outstrips and depletes endogenous MYC (Fig. 6a). Similarly, overexpression of MYC alone only partially activates the wound signature because MYC lacks full transcriptional potency, particularly toward target genes important in cell growth and invasion (Figs. 6,7). The coordinate overexpression of CSN5 and MYC generates a high level of ubiquitinated MYC and breaks this regulatory circuit by providing a continuous supply of a short-lived but potent growth regulator. Inhibition of CSN5-mediated regulation of MYC may be a useful therapeutic strategy for high-risk breast cancers.
METHODS
Plasmids
pCS2-CUL1, pMT-His-Ub (A. Oro, Stanford University), pCDNA3.1-HA-CSN5 (X. Chen, University of California, San Francisco), pLZRS-GFP, pRL-Luc (P. Khavari, Stanford) and pBabe-MYC (D. Felsher, Stanford) were gifts of the indicated investigators. pCGN-MYC33, pCGN-GAL4-MYC(2-147)33, pCGT-SKP2 (ref. 33), pCGT-SKP2LRR (ref. 33) and pLXSN-CSN5 (ref. 44) were previously described. siRNA against GFP (E1)45 and CSN5 (ref. 46) from published sequences were synthesized by Dharmacon.
Antibodies
We used anti-MYC (9E10), anti-CSN5 (FL-334) and anti-Paxillin (H-114) (Santa Cruz Biotechnology); anti-hemagglutinin (HA) (12CA5; Abgent); anti-β-ACTIN (AC-74) (Sigma); anti-T7 (Novagen); FITC-conjugated immunoglobulin (Jackson ImmunoResearch Laboratories) and TRITC-conjugated phalloidin (Sigma).
MCF10A stable transduction
MCF10A cells (ATCC) were propagated in DMEM/F12 (Invitrogen/Cambrex), 5% fetal bovine serum (FBS) supplemented with EGF (20 ng ml−1), insulin (10 μg/ml) and hydrocortisone (0.5 μg/ml). Retroviral constructs were transfected into amphotropic Phoenix cells (gift of G. Nolan, Stanford University), and virus-containing supernatants were used to transduce MCF10A cells as described25. Transduced populations were selected with G418 for 4 d and puromycin for 3 d. Expression of stably transduced genes was verified by immunoblotting. Two sets of MCF10A cells were generated. In set 1, MCF10A cells were transduced with GFP, MYC, CSN5, or both MYC and CSN5 and were selected with G418 or puromycin, depending on the vector plasmid. In set 2, cells were transduced with pairwise combinations of MYC, CSN5 and empty vectors so that all resulting populations were both puromycin-and G418-resistant. Identical effects of MYC and CSN5 expression on proliferation, cell shape, adhesion and migration were observed in both sets of cells.
Microarray procedures
Transduced MCF10A cells (set 1) were cultured in medium containing 5% FBS for 24 h (serum induced) or 0.1% FBS for 48 h (starved). Total RNA was extracted with Trizol (Invitrogen) and reverse transcribed and labeled with Cy5-containing dendrimers using the 3DNA Array 900 kit (Genisphere). Reference RNA pooled from 11 cell lines (Stratagene) was reverse transcribed and labeled with Cy3-containing dendrimers and used for two-color competitive hybridizations in all experiments. Construction of human cDNA microarrays containing 40,742 elements, representing 24,472 genes, was as described2. Competitive hybridization of Cy5 and Cy3 probes was completed as described by the manufacturer (Genisphere). We selected for analysis genes in which the corresponding array element had a fluorescent hybridization signal at least 1.5-fold greater than local background in either the Cy5 or Cy3 channel, and we further restricted the analysis to genes for which technically adequate data were obtained in at least 60% of experiments. We analyzed relative expression by mean value centering within the data set.
SLAMS analysis
Global gene expression data of 85 locally advanced breast tumors and control breast tissues3, aCGH data of 37 of the 85 tumors6 and expression data of the fibroblast serum response5 were downloaded from Stanford Microarray Database. We used IMAGE clone identification numbers to map probes among different batches of microarrays. Classification of tumor samples by wound signature5, two-class SAM analysis15 and decision tree analysis12 were as described.
We filtered candidate regulators as follows: although the mRNA expression level of CSN5 was most strongly associated with the wound signature, the partner regulator in distal 8q was not as evident from the data. To address this point, we kept CSN5 fixed and compared the ability of distal 8q genes to provide additional independent prediction of wound signature score using multiple regression. We tested the expression of six distal 8q genes (MYC, EXT1, ATP6C, FZD6, MAL2 and UQCRB) with the highest individual correlation to the wound signature (Fig. 2b) in the multiple regression model. MYC and EXT1 were the top predictors in combination with CSN5, and both had similar _P_-values in the model (P = ~10−6 for each); the other four genes were significantly worse predictors (P = ~10−4–10−5). Whereas EXT1 is involved in heparan sulfate biosynthesis, MYC is a well-known oncogene in breast cancer and was the obvious candidate regulator for a poor-prognosis cancer signature. To address whether additional candidate regulators could perform as well as MYC and CSN5 in stratifying tumors based on the wound score, we removed these two genes from the list of candidate regulators and repeated the multiple regression analysis. mRNA levels of PDE7A on proximal 8q and UQCRB on distal 8q had the best individual association with the wound signature. However, multiple regression analysis showed that the fit of UQCRB expression level to wound score was three logs less significant than that of CSN5 (P = 0.01 versus P < 10−5, respectively), and PDE7A did not contribute independent information (P = 0.09). Therefore the DNA copy number and expression levels of CSN5 and MYC were uniquely associated with the wound signature in tumor samples as delineated by SLAMS, and these two genes were chosen for experimental validation. Further considerations pertaining to implementation and interpretation of SLAMS are described in the Supplementary Note online.
Gene expression analysis of MYC and CSN5 overexpression
First, to test if the wound signature was experimentally reproduced, we examined the fraction of genes in the signature that were induced (or repressed) in the appropriate direction as predicted by the signature and the magnitudes of gene induction and repression. The wound signature consisted of 512 cDNA probes (henceforth, genes): 255 genes were induced by serum, indicative of the activated wound signature; 257 genes were repressed by serum, indicative of the quiescent wound signature5. Probes corresponding to genes in the wound signature were identified by matching IMAGE clone identification numbers. Gene expression values in duplicate experiments were averaged, and values >0 were scored as induced while values <0 were scored as repressed by the experimental condition. Using these criteria, 201 of 255 genes representing the ‘activated’ wound signature were induced by coexpression of MYC and CSN5, and 114 of 257 genes representing the ‘quiescent’ wound signature were repressed by MYC and CSN5. The concordance of the regulation pattern of these 512 genes by coexpression of MYC and CSN5 relative to that defined by the wound signature was evaluated using a 2 × 2 χ2 test and found to be highly significant (P < 10−19).
The wound score is the Pearson correlation coefficient of the expression pattern of genes in the wound signature in an experimental or tumor sample to the pattern observed for the same genes in serum-stimulated fibroblasts. The wound score of primary human breast cancer is directly proportional to the risk of metastasis and death in multivariate analysis12. However, the wound signature does not quantify the magnitude of gene regulation (that is, it is scaleless). Therefore, we use additional tests (the gene module map, applied below) to address the magnitude of gene regulation. Second, the statistical significance associated with differing wound scores does not change in a linear fashion as suggested by the score, but rather increases exponentially with higher scores (Supplementary Fig. 2 online) and is dependent on the number of genes used to compute the correlation. To address these issues, we calculated the _P_-values of the reported wound scores using one-sided _t_-tests to estimate the probability that the observed wound score could be obtained by chance alone if the underlying correlation value is zero (implemented in Winstat, R. Fitch Software). We displayed the wound scores and the corresponding _P_-values based on a logarithmic scale of the _P_-values (Figs. 2d and 4b). We previously used a Cox proportional hazard model to show that each incremental +0.1 increase in the wound score is associated with 1.27- and 1.22-fold increased risk of death or metastasis, respectively12. The risk of death or metastasis based on the degree of wound score change induced by MYC and CSN5 is calculated by dividing the change in wound score by 0.1 and then applying the quotients in the Cox proportional hazard model.
Gene module map is a method to discover and quantify the coordinate regulation of groups of genes within microarray data; we implemented it in the program GeneXpress14. Groups of functionally related genes, termed gene modules, are annotated on the basis of prior biological knowledge and can consist of genes that are thought to share similar function, genes whose encoded products have similar cellular localizations, or genes that share similar regulation based on previous evidence of coexpression. We analyzed 1,256 gene modules defined by Gene Ontology26 terms and 28 gene modules based on previously published prognostic signatures in human breast cancers (Supplementary Table 2). For each microarray experiment, the algorithm compares genes that are induced (or repressed) by 1.5-fold and their membership in gene modules and identifies gene modules that show enrichment in induced (or repressed) genes more than expected by chance (P < 0.05). The _P_-value of enrichment was determined by the hypergeometric distribution, and a false discovery rate (FDR) calculation was used to account for multiple hypothesis testing. Gene modules that showed significant coregulation (P <0.05 and FDR < 0.05) in at least two experiments are shown in Figure 4c. We displayed the average expression level of all genes in the module; therefore, the intensity of color in Figure 4c reflects the magnitude of regulation of genes averaged across each cognate gene module. For the cyclin D1 analysis, we downloaded global gene expression profiles of MCF7 cells transduced with GFP, wild-type cyclin D1 or cyclin D1(KE)28 from the Gene Expression Omnibus (GEO) and analyzed all three series by the gene module map method.
Chromatin immunoprecipitation from multiple cell types previously established 257 high-confidence MYC target genes23. One hundred seventy-five of 257 genes, represented by 292 cDNA probes, had adequate technical measurements (as defined above) and were present in the microarray experiments comparing MYC and MYC plus CSN5. To identify MYC target genes that were differentially expressed in cells transduced with MYC alone versus MYC plus CSN5, we carried out a two-class comparison using the permutation-based algorithm SAM15 for these 175 genes. Thirty-nine genes were significantly induced by CSN5 coexpression (FDR < 0.1, Fig. 6d,e and **Supplementary Table 3**). No genes were significantly repressed upon MYC and CSN5 coexpression (FDR > 0.49).
Kaplan-Meier survival analysis
Disease-specific survival data were available for 76 of the 85 patients partitioned above using the two-tier CSN5-MYC decision tree, and survival analysis by the method of Kaplan and Meier for the two groups of patients was implemented in Winstat (R. Fitch Software). The 5-year disease-specific survival for breast tumors in group 1 (low CSN5 or MYC) versus group 2 (moderate or high CSN5 and MYC) was 74% versus 38%, respectively (P = 0.031).
Quantitative microsatellite analysis (QuMA)
DNA copy numbers of MYC, CSN5 and seven reference genomic loci were analyzed using QuMA17. TaqMan fluorescent probe that binds to CA-repeat microsatellite markers was purchased from Applied Biosystems. Primer sequences used in this study can be found in Supplementary Table 4 online. Data was collected and analyzed with the Stratagene Mx3000P quantitative PCR system. DNA copy numbers were quantified and normalized to 2 using normal male DNA as described17.
Cell proliferation, immunofluorescence and invasion assays
For the proliferation assay, 103 cells were plated per well in 96-well plates, and cells were counted daily in triplicate plates using the MTT cell proliferation kit (Roche). Immunofluorescence experiments were as described47, and images were obtained with a Zeiss Axiovert 100M microscope. For the invasion assay, invasion of transduced MCF10A cells through Matrigel toward 5% FBS as chemoattractant was quantified using a QCM cell invasion assay (Chemicon).
MYC ubiquitination, turnover and reporter gene assays
The MYC ubiquitination assay using histidine-tagged ubiquitin and cycloheximide chase experiments in U20S and 293 HEK cells was as described33,34. Quantification was performed with ImageJ. For the GAL4 reporter gene assay, 293 HEK cells were transfected with siRNAs, pCGN-GAL4-MYC(2-147), pGAL4-Luc and pRL-Luc using Lipofecatamine 2000 (Invitrogen). Forty-eight hours later, dual luciferase assays (Promega) were performed as described by the manufacturer.
URLs
Primary microarray data are available at Stanford Microarray Database (http://smd.stanford.edu/) and GEO (http://www.ncbi.nlm.nih.gov/geo/). ImageJ is available at http://rsb.info.nih.gov/ij/.
Supplementary Material
Supplementary Note
Supplementary Figure 1
Supplementary Figure 2
Supplementary Table 1
Supplementary Table 2
Supplementary Table 3
Supplementary Table 4
Acknowledgments
We thank E. Huntziker, A.E. Oro, W. Tansey, L. Bemis, X. Chen and D.W. Felsher for reagents, T.W. Ridky and P.A. Khavari for assistance with animal experiments, Y. Liu for technical assistance, members of the Program in Epithelial Biology for discussion and D.W. Felsher, P.A. Khavari, A.E. Oro, E. Segal and J.L. Rinn for comments on the manuscript. This work was supported by grants from the US National Institutes of Health (AR050007, CA09302) and the Dutch Cancer Society (NKB 2002–2575). H.Y.C. is a Damon Runyon Scholar supported by the Damon Runyon Cancer Research Foundation.
Footnotes
Note: Supplementary information is available on the Nature Genetics website.
COMPETING INTERESTS STATEMENT
The authors declare competing financial interests (see the Nature Genetics website for details).
References
- 1.Liu ET. Classification of cancers by expression profiling. Curr Opin Genet Dev. 2003;13:97–103. doi: 10.1016/s0959-437x(03)00008-x. [DOI] [PubMed] [Google Scholar]
- 2.Perou CM, et al. Molecular portraits of human breast tumours. Nature. 2000;406:747–752. doi: 10.1038/35021093. [DOI] [PubMed] [Google Scholar]
- 3.Sorlie T, et al. Gene expression patterns of breast carcinomas distinguish tumor subclasses with clinical implications. Proc Natl Acad Sci USA. 2001;98:10869–10874. doi: 10.1073/pnas.191367098. [DOI] [PMC free article] [PubMed] [Google Scholar]
- 4.van ‘t Veer LJ, et al. Gene expression profiling predicts clinical outcome of breast cancer. Nature. 2002;415:530–536. doi: 10.1038/415530a. [DOI] [PubMed] [Google Scholar]
- 5.Chang HY, et al. Gene expression signature of fibroblast serum response predicts human cancer progression: Similarities between tumors and wounds. PLoS Biol. 2004;2:206–214. doi: 10.1371/journal.pbio.0020007. [DOI] [PMC free article] [PubMed] [Google Scholar]
- 6.Pollack JR, et al. Microarray analysis reveals a major direct role of DNA copy number alteration in the transcriptional program of human breast tumors. Proc Natl Acad Sci USA. 2002;99:12963–12968. doi: 10.1073/pnas.162471999. [DOI] [PMC free article] [PubMed] [Google Scholar]
- 7.Huang E, et al. Gene expression phenotypic models that predict the activity of oncogenic pathways. Nat Genet. 2003;34:226–230. doi: 10.1038/ng1167. [DOI] [PubMed] [Google Scholar]
- 8.Sweet-Cordero A, et al. An oncogenic KRAS2 expression signature identified by cross-species gene-expression analysis. Nat Genet. 2005;37:48–55. doi: 10.1038/ng1490. [DOI] [PubMed] [Google Scholar]
- 9.Dvorak HF. Tumors: wounds that do not heal. Similarities between tumor stroma generation and wound healing. N Engl J Med. 1986;315:1650–1659. doi: 10.1056/NEJM198612253152606. [DOI] [PubMed] [Google Scholar]
- 10.Bissell MJ, Radisky D. Putting tumours in context. Nat Rev Cancer. 2001;1:46–54. doi: 10.1038/35094059. [DOI] [PMC free article] [PubMed] [Google Scholar]
- 11.Cooper L, Johnson C, Burslem F, Martin P. Wound healing and inflammation genes revealed by array analysis of ‘macrophageless’ PU. 1 null mice. Genome Biol. 2005;6:R5. doi: 10.1186/gb-2004-6-1-r5. [DOI] [PMC free article] [PubMed] [Google Scholar]
- 12.Chang HY, et al. Robustness, scalability, and integration of a wound response gene expression signature in predicting survival of human breast cancer patients. Proc Natl Acad Sci USA. 2005;102:3738–3743. doi: 10.1073/pnas.0409462102. [DOI] [PMC free article] [PubMed] [Google Scholar]
- 13.Mootha VK, et al. PGC-1alpha-responsive genes involved in oxidative phosphorylation are coordinately downregulated in human diabetes. Nat Genet. 2003;34:267–273. doi: 10.1038/ng1180. [DOI] [PubMed] [Google Scholar]
- 14.Segal E, Friedman N, Koller D, Regev A. A module map showing conditional activity of expression modules in cancer. Nat Genet. 2004;36:1090–1098. doi: 10.1038/ng1434. [DOI] [PubMed] [Google Scholar]
- 15.Tusher VG, Tibshirani R, Chu G. Significance analysis of microarrays applied to the ionizing radiation response. Proc Natl Acad Sci USA. 2001;98:5116–5121. doi: 10.1073/pnas.091062498. [DOI] [PMC free article] [PubMed] [Google Scholar]
- 16.Cope GA, Deshaies RJ. COP9 signalosome: a multifunctional regulator of SCF and other cullin-based ubiquitin ligases. Cell. 2003;114:663–671. doi: 10.1016/s0092-8674(03)00722-0. [DOI] [PubMed] [Google Scholar]
- 17.Ginzinger DG, et al. Measurement of DNA copy number at microsatellite loci using quantitative PCR analysis. Cancer Res. 2000;60:5405–5409. [PubMed] [Google Scholar]
- 18.Iyer VR, et al. The transcriptional program in the response of human fibroblasts to serum. Science. 1999;283:83–87. doi: 10.1126/science.283.5398.83. [DOI] [PubMed] [Google Scholar]
- 19.Kelly K, Cochran BH, Stiles CD, Leder P. Cell-specific regulation of the c-myc gene by lymphocyte mitogens and platelet-derived growth factor. Cell. 1983;35:603–610. doi: 10.1016/0092-8674(83)90092-2. [DOI] [PubMed] [Google Scholar]
- 20.Frank SR, Schroeder M, Fernandez P, Taubert S, Amati B. Binding of c-Myc to chromatin mediates mitogen-induced acetylation of histone H4 and gene activation. Genes Dev. 2001;15:2069–2082. doi: 10.1101/gad.906601. [DOI] [PMC free article] [PubMed] [Google Scholar]
- 21.Felsher DW, Zetterberg A, Zhu J, Tlsty T, Bishop JM. Overexpression of MYC causes p53-dependent G2 arrest of normal fibroblasts. Proc Natl Acad Sci USA. 2000;97:10544–10548. doi: 10.1073/pnas.190327097. [DOI] [PMC free article] [PubMed] [Google Scholar]
- 22.Tomoda K, Kubota Y, Kato J. Degradation of the cyclin-dependent-kinase inhibitor p27Kip1 is instigated by Jab1. Nature. 1999;398:160–165. doi: 10.1038/18230. [DOI] [PubMed] [Google Scholar]
- 23.Fernandez PC, et al. Genomic targets of the human c-Myc protein. Genes Dev. 2003;17:1115–1129. doi: 10.1101/gad.1067003. [DOI] [PMC free article] [PubMed] [Google Scholar]
- 24.Soule HD, et al. Isolation and characterization of a spontaneously immortalized human breast epithelial cell line, MCF-10. Cancer Res. 1990;50:6075–6086. [PubMed] [Google Scholar]
- 25.Pear WS, Nolan GP, Scott ML, Baltimore D. Production of high-titer helper-free retroviruses by transient transfection. Proc Natl Acad Sci USA. 1993;90:8392–8396. doi: 10.1073/pnas.90.18.8392. [DOI] [PMC free article] [PubMed] [Google Scholar]
- 26.Ashburner M, et al. Gene ontology: tool for the unification of biology. The Gene Ontology Consortium. Nat Genet. 2000;25:25–29. doi: 10.1038/75556. [DOI] [PMC free article] [PubMed] [Google Scholar]
- 27.Schmidt EV. The role of c-myc in cellular growth control. Oncogene. 1999;18:2988–2996. doi: 10.1038/sj.onc.1202751. [DOI] [PubMed] [Google Scholar]
- 28.Lamb J, et al. A mechanism of cyclin d1 action encoded in the patterns of gene expression in human cancer. Cell. 2003;114:323–334. doi: 10.1016/s0092-8674(03)00570-1. [DOI] [PubMed] [Google Scholar]
- 29.Amati B. Myc degradation: dancing with ubiquitin ligases. Proc Natl Acad Sci USA. 2004;101:8843–8844. doi: 10.1073/pnas.0403046101. [DOI] [PMC free article] [PubMed] [Google Scholar]
- 30.Sears R, et al. Multiple Ras-dependent phosphorylation pathways regulate Myc protein stability. Genes Dev. 2000;14:2501–2514. doi: 10.1101/gad.836800. [DOI] [PMC free article] [PubMed] [Google Scholar]
- 31.Welcker M, et al. The Fbw7 tumor suppressor regulates glycogen synthase kinase 3 phosphorylation-dependent c-Myc protein degradation. Proc Natl Acad Sci USA. 2004;101:9085–9090. doi: 10.1073/pnas.0402770101. [DOI] [PMC free article] [PubMed] [Google Scholar]
- 32.Yada M, et al. Phosphorylation-dependent degradation of c-Myc is mediated by the F-box protein Fbw7. EMBO J. 2004;23:2116–2125. doi: 10.1038/sj.emboj.7600217. [DOI] [PMC free article] [PubMed] [Google Scholar]
- 33.Kim SY, Herbst A, Tworkowski KA, Salghetti SE, Tansey WP. Skp2 regulates Myc protein stability and activity. Mol Cell. 2003;11:1177–1188. doi: 10.1016/s1097-2765(03)00173-4. [DOI] [PubMed] [Google Scholar]
- 34.von der Lehr N, et al. The F-box protein Skp2 participates in c-Myc proteosomal degradation and acts as a cofactor for c-Myc-regulated transcription. Mol Cell. 2003;11:1189–1200. doi: 10.1016/s1097-2765(03)00193-x. [DOI] [PubMed] [Google Scholar]
- 35.Wee S, Geyer RK, Toda T, Wolf DA. CSN facilitates Cullin-RING ubiquitin ligase function by counteracting autocatalytic adapter instability. Nat Cell Biol. 2005;7:387–391. doi: 10.1038/ncb1241. [DOI] [PubMed] [Google Scholar]
- 36.Alt JR, Greiner TC, Cleveland JL, Eischen CM. Mdm2 haplo-insufficiency profoundly inhibits Myc-induced lymphomagenesis. EMBO J. 2003;22:1442–1450. doi: 10.1093/emboj/cdg133. [DOI] [PMC free article] [PubMed] [Google Scholar]
- 37.Slack A, et al. The p53 regulatory gene MDM2 is a direct transcriptional target of MYCN in neuroblastoma. Proc Natl Acad Sci USA. 2005;102:731–736. doi: 10.1073/pnas.0405495102. [DOI] [PMC free article] [PubMed] [Google Scholar]
- 38.Diehn M, et al. SOURCE: a unified genomic resource of functional annotations, ontologies, and gene expression data. Nucleic Acids Res. 2003;31:219–223. doi: 10.1093/nar/gkg014. [DOI] [PMC free article] [PubMed] [Google Scholar]
- 39.Wang ZC, et al. Loss of heterozygosity and its correlation with expression profiles in subclasses of invasive breast cancers. Cancer Res. 2004;64:64–71. doi: 10.1158/0008-5472.can-03-2570. [DOI] [PubMed] [Google Scholar]
- 40.Aguirre AJ, et al. High-resolution characterization of the pancreatic adenocarcinoma genome. Proc Natl Acad Sci USA. 2004;101:9067–9072. doi: 10.1073/pnas.0402932101. [DOI] [PMC free article] [PubMed] [Google Scholar]
- 41.Weber M, et al. Chromosome-wide and promoter-specific analyses identify sites of differential DNA methylation in normal and transformed human cells. Nat Genet. 2005;37:853–862. doi: 10.1038/ng1598. [DOI] [PubMed] [Google Scholar]
- 42.Elenbaas B, et al. Human breast cancer cells generated by oncogenic transformation of primary mammary epithelial cells. Genes Dev. 2001;15:50–65. doi: 10.1101/gad.828901. [DOI] [PMC free article] [PubMed] [Google Scholar]
- 43.Zhao JJ, et al. Human mammary epithelial cell transformation through the activation of phosphatidylinositol 3-kinase. Cancer Cell. 2003;3:483–495. doi: 10.1016/s1535-6108(03)00088-6. [DOI] [PubMed] [Google Scholar]
- 44.Bemis L, et al. Distinct aerobic and hypoxic mechanisms of HIF-alpha regulation by CSN5. Genes Dev. 2004;18:739–744. doi: 10.1101/gad.1180104. [DOI] [PMC free article] [PubMed] [Google Scholar]
- 45.Chi JT, et al. Genomewide view of gene silencing by small interfering RNAs. Proc Natl Acad Sci USA. 2003;100:6343–6346. doi: 10.1073/pnas.1037853100. [DOI] [PMC free article] [PubMed] [Google Scholar]
- 46.Kim BC, et al. Jab1/CSN5, a component of the COP9 signalosome, regulates transforming growth factor beta signaling by binding to Smad7 and promoting its degradation. Mol Cell Biol. 2004;24:2251–2262. doi: 10.1128/MCB.24.6.2251-2262.2004. [DOI] [PMC free article] [PubMed] [Google Scholar]
- 47.Chang HY, et al. Diversity, topographic differentiation, and positional memory in human fibroblasts. Proc Natl Acad Sci USA. 2002;99:12877–12882. doi: 10.1073/pnas.162488599. [DOI] [PMC free article] [PubMed] [Google Scholar]
Associated Data
This section collects any data citations, data availability statements, or supplementary materials included in this article.
Supplementary Materials
Supplementary Note
Supplementary Figure 1
Supplementary Figure 2
Supplementary Table 1
Supplementary Table 2
Supplementary Table 3
Supplementary Table 4