Downregulation in components of the mitochondrial electron transport chain in the postmortem frontal cortex of subjects with bipolar disorder (original) (raw)
. 2006 May;31(3):189–196.
Show available content in
Abstract
Objective
Many studies indicate a genetic predisposition to bipolar disorder (BD) and suggest that a number of abnormal genes are involved in its development. In this study, we used DNA microarray technology to analyze gene-expression profiles in the postmortem frontal cortex of subjects with BD.
Methods
Microarray hybridization was performed using human 19K microarray with universal human reference RNA in each hybridization. The reference cDNA was labelled with Cy3 and experimental cDNA, with Cy5. Glass array slides were cohybridized with equal amounts of mixed reference and experimental cDNA. Selected gene targets were further verified using real-time polymerase chain reaction (PCR).
Results
We found that 831 genes were differentially expressed in subjects with BD, including a number of genes in the mitochondrial electron transport chain (ETC), phosphatidylinositol-signalling system and glycolysis/ gluconeogenesis. Eight genes coding for the components of the mitochondrial ETC were identified along with 15 others related to mitochondrial function. Downregulation of NADH-ubiquinone oxidoreductase 20-kd subunit (ETC complex I), cytochrome c oxidase polypeptide Vic (ETC complex IV) and ATP synthase lipid-binding protein (ETC complex V) were further verified by real-time PCR. We also found that the expression of the NADH-ubiquinone oxidoreductase 20-kd subunit was increased in subjects with BD who were receiving mood-stabilizing treatment with lithium at the time of death, when compared with subjects with BD who were not being treated with lithium.
Conclusions
Because the mitochondrial ETC is a major source for the generation of reactive oxygen species, these findings suggest that oxidative damage may play an important role in the pathophysiology of BD and that neuroprotection against this damage may be involved in the effect of lithium treatment.
Medical subject headings: bipolar disorder, electron transport, genetics, lithium, mitochondria, polymerase chain reaction
Introduction
Bipolar disorder (BD) is a common psychiatric disease that affects about 1.5% of the population. It is characterized by episodes of mania and depression with significant morbidity and mortality.1,2 Although the cause of BD has not yet been identified, twin, adoption, family and linkage studies indicate that BD is a heterogeneous disease with multiple genetic and environmental risk factors. There is consensus that BD is caused not by a single gene abnormality but as the result of a number of susceptibility genes.2–4 Thus, analyzing gene-expression profiles in subjects with BD may help us to further understand the mechanism of the pathophysiological development of this disease. High-density oligonucleotide and cDNA spot microarray technologies have been developed to monitor the expression of thousands of genes simultaneously. Recently, this technology has been used to define gene-expression profiles in subjects with psychiatric disorders to further understand the role of specific genes in the pathophysiology of these disorders.5–8 In the present study, we analyzed genome-wide gene-expression profiles in the postmortem frontal cortex of a large group of subjects with BD by applying DNA microarray technology and found that many mitochondria-related genes were differentially expressed between control and BD subjects. We also report the differential effects of the major treatments for this illness on these mitochondria-related genes. Our experiments were performed in the frontal cortical region of the brain, because it plays a key role in processes that control mood, cognition and motor behaviour functions,9,10 and because cell loss and atrophy in this region have been reported in patients with BD.11–13
Methods
Postmortem brain samples
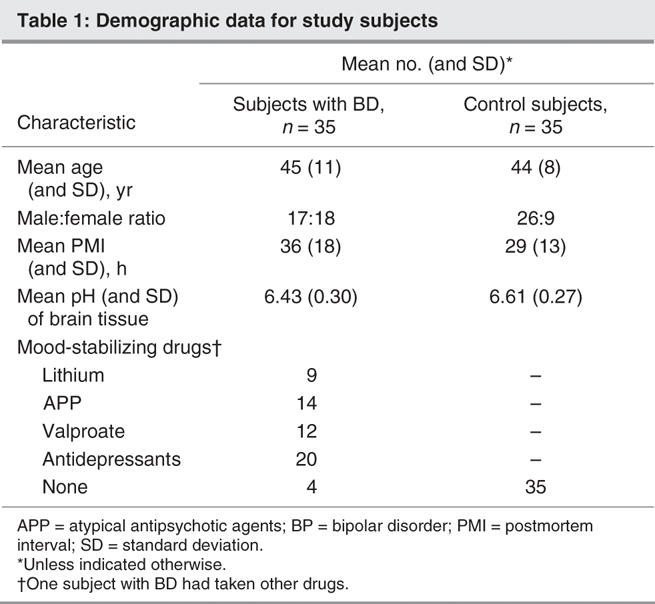
Total RNA from the dorsolateral prefrontal cortex of subjects with BD and unaffected control subjects was generously provided by the Stanley Foundation Array Collection. The families of the deceased were contacted by a pathologist for preliminary diagnoses, permission for brain-tissue donation and release of the deceased's medical records.14 Total RNA was isolated using Trizol by the Stanley Foundation. RNA integrity and purity were determined with an Agilent 2100 Bioanalyzer (Agilent Technologies, Palo Alto, Calif.). The bioanalyzer profiles have clear 28S and 18S rRNA peaks. Received RNA samples were further purified using RNeasy column (Qiagen, Mississauga, Ont.) in our laboratory. After RNA purification, the concentration of RNA for each sample was quantitated by measuring the optical density at 260 nm and the purity was determined by the 260/280 ratio. Our sample consisted of 35 subjects with BD and a control group of 35 subjects with no psychiatric disease. Criteria for sample collection were based on age, substance abuse, structural brain pathology, focal neurological signs before death, history of central nervous system disease, and documented IQ and RNA quality. Diagnoses were made by 2 senior psychiatrists using Diagnostic and statistical manual of mental disorders, fourth edition (DSM-IV),15 criteria. Details of the criteria are listed at www.stanleyresearch.org/programs/brain _collection.asp. Demographic information for these subjects is summarized in Table 1.
Table 1
DNA microarray analysis
Microarray analysis was performed using human 19K microarray containing 19 008 characterized and unknown human expressed sequence tags (University Health Network Microarray Centre, Toronto). Sequence information is available at www.microarrays.ca/support/glists.html. We used universal human reference RNA (Stratagene, La Jolla, Calif.) in each hybridization, which provided us with the ability to compare data sets from multiple experiments.16–18 Five micrograms of reference RNA and experimental RNA (from BD subjects or controls) were used as a template to generate cDNA probes by reverse transcription under Superscript II reverse transcriptase (Invitrogen, Carlsbad, Calif.) with AncT mRNA primer (Cortec, Kingston, Ont.). cDNA probes were purified from unincorporated nucleotides and small cDNA fragments in a Microcon polymerase chain reaction (PCR) purification column (Fisher, Ottawa, Ont.). During reverse transcription, amino allyl dUTP, an amine-modified nucleotide, was incorporated into cDNA probes and then labelled by monofunctional forms of cyanine 3 (Cy3) and cyanine 5 (Cy5), respectively. The reference cDNA was labelled with Cy3 and experimental cDNA, with Cy5. The glass-slide microarray was cohybridized with equal amounts of mixed reference and experimental cDNA probes at 37°C overnight in DIG Easy Hyb solution (Roche Diagnostics, Alameda, Calif.). After hybridization, slides were washed and scanned using the GenePix 4000B scanner (Axon Instruments, Union City, Calif.). Genepix 3.02 software (Axon Instruments) was used to determine the fluorescence intensities of Cy3 and Cy5 dyes for each DNA spot. Spots of poor quality (irregular shapes and contaminated with fluorescent specks) were removed from further consideration. Because microarray experiments are time-consuming and relatively expensive, and because we used relatively large samples for each group (n = 35), we did not replicate these experiments. However, some gene candidates were verified using real-time PCR analysis.
Analyses were performed using BRB ArrayTools developed by Dr. Richard Simon and Amy Peng Lam (http://linus.nci.nih.gov/BRB-ArrayTools.html, Biometric Research Branch, US National Cancer Institute). Local background was subtracted from the value of each spot on the array. The minimum intensity for array spots was raised to 200 for subsequent analyses. The intensity of each spot for Cy3 and Cy5 channels was normalized by (median of Cy5 intensity)/ (median of Cy3 intensity) = 1. The relative value for each experimental sample was acquired by E/R (E = intensity for experimental samples, R = intensity for reference). The expression value of all genes on the array was log-transformed (base 2). A univariate t test was used to determine significant differences between control and disease subjects. GenMapp (www.genmapp.org) was used to draw maps of genes in functionally related groups. Correlation between expression of 3 candidate genes (NDUFS7, COX6C and ATP5G3) and age, sex, postmortem interval, medication and psychosis symptoms was analyzed.
Real-time quantitative PCR
One microgram of total RNA was reverse transcribed to cDNA under MuLV reverse transcriptase with random hexamer (Applied Biosystems, Foster City, Calif.). Real-time quantitative reverse transcription (RT) PCR was performed with the ABI Prism 7300 sequence detection system (Applied Biosystems). Gene targets were amplified with TaqMan MGB probes and specific primer sets of candidate genes (Assay-on-demand), and the delta Ct method was used for quantification of amplified gene targets according to the manufacturer's protocol (Applied Biosystems).19 rRNA was used as an endogenous control for normalization. The PCR reaction for each gene was performed in triplicate. The delta Ct value was used to quantitate candidate genes according to the manufacturer's protocol. Because these data were log-transformed and not normally distributed, group differences were determined using the Mann–Whitney U test.
Results
Human 19K cDNA spot microarrays were used to analyze expression profiles in the postmortem prefrontal cortex of subjects with BD. For the purpose of further classifying candidate genes, 12 933 characterized and unknown human expressed sequence tags with unique gene cluster ID in this array were selected for analysis. The expression values of most genes were similar for both the control and BD groups (data not shown). We found that 831 of the total 12 933 genes were significantly differentially expressed between the control and BD groups (p < 0.05, n = 35 for each group). Two-hundred and ninety-seven genes were upregulated, while 534 genes were downregulated in the BD group when compared with the control group. Because we were interested in functionally related gene groups, we used a more liberal threshold (p < 0.05) to identify more gene candidates and increase the chance of identifying functionally related genes. Although we understand that the finding of differential gene expression in 831 genes is at a purely nominal level of p < 0.05, we verified a number of representative-interest candidate genes by real-time PCR.
We further classified these 831 BD-associated candidates based on the work of the Gene Ontology Consortium (www.geneontology.org/) and were particularly interested in pathways in which we found multiple genes. We found gene candidates in 3 major functional pathways: the mitochondrial electron transport chain (ETC), the phosphatidylinositol-signalling system and glycolysis/gluconeogenesis. More specifically, 8 genes that are components of the ETC, consisting of NDUFS7 (NADH-ubiquinone oxidoreductase 20-kd subunit), NDUFS8 (NADH-ubiquinone oxidoreductase 23-kd subunit), UQCRC2 (ubiquinol-cytochrome C reductase complex core protein 2), COX5A (cytochrome c oxidase polypeptide Va), COX6C (cytochrome c oxidase polypeptide Vic), ATP5C1 (ATP synthase gamma chain), ATP5J (ATP synthase coupling factor 6) and ATP5G3 (ATP synthase lipid-binding protein), were downregulated in subjects with BD (Table 2, Fig. 1). Five genes are involved in the phosphatidylinositol-signalling system, and 4 genes are involved in the process of glycolysis and gluconeogenesis (Fig. 1).
Table 2
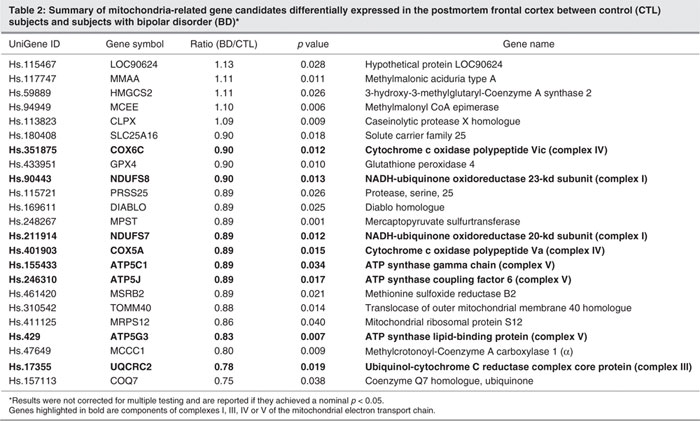
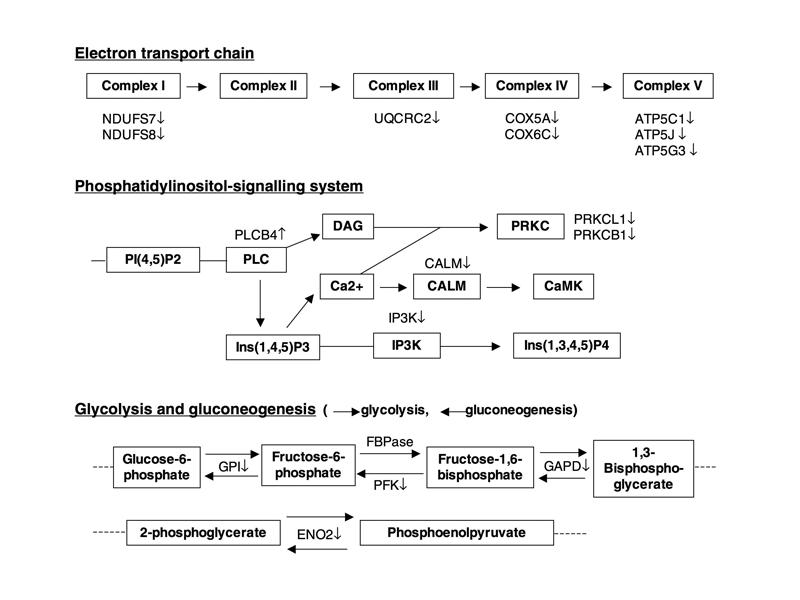
Fig. 1: Summary of altered expression of genes involved in the pathways of the electron transport chain, the phosphatidylinositol-signalling system, and glycolysis and gluconeogenesis. Pathways of the electron transport chain: ATP5 = adenosine triphosphate (ATP) synthase; COX = cytochrome c oxidase polypeptide; NDUF = NADH-ubiquinone oxidoreductase; UQCRC = ubiquinol-cytochrome c reductase complex core protein. Pathways of the phosphatidylinositol-signalling system: CALM = calmodulin; CaMK = calmodulin-dependent kinase; DAG = diacylglycerol; Ins(1,4,5)P3 = inositol 1,4,5-trisphosphate; Ins(1,3,4,5)P4 = inositol 1,3,4,5-tetrakisphosphate; IP3K = inositol-1,4,5-trisphosphate 3-kinase; Pl(4,5)P2 = phosphatidylinositol 4,5-bisphosphate; PLC = phospholipase C; PRKC = protein kinase C. The pathways of glycolysis and gluconeogenesis: ENO2 = gamma enolase; FBPase = fructose-1,6-bisphophosphatase; GAPD = glyceraldehyde-3-phosphate dehydrogenase; GPI = glucose-6-phosphate isomerase; PFK = 6-phosphofructokinase. ↑ = increase; ↓ = decrease.
Recent studies have suggested mitochondrial dysfunction in the brain of subjects with BD.20,21 The ETC is located in mitochondria. We, therefore, further determined the expression of other mitochondria-related genes and found that 15 additional mitochondria-related genes are also differentially expressed between control and BD subjects (Table 2). In contrast to the identified components of mitochondrial ETC listed above, the expression of which was decreased in each case, the expression of 5 of the additional mitochondria-related genes was increased, with expression of the remainder being decreased compared with control subjects. We also found that the antioxidant enzymes superoxide dismutase 1, glutathione peroxidase 4 and glutathione _S_-transferase pi1 are decreased in subjects with BD. The expression of superoxide dismutase 1 is decreased by 82% (n = 35, p = 0.003), glutathione peroxidase 4 is decreased by 90% (n = 35, p = 0.010) and glutathione _S_-transferase pi1 is decreased by 91% (n = 35, p = 0.034) in subjects with BD when compared with control subjects.
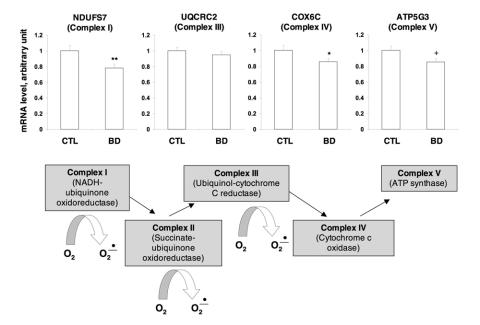
To verify BD-associated candidate genes identified by DNA microarray, the mRNA levels of NDUFS7, UQCRC2, COX6C and ATP5G3 representing complexes I, III, IV and V were further measured using real-time quantitative PCR. Compared with control subjects, the expression of NDUFS7 and COX6C was significantly decreased (p = 0.026 and p = 0.049, respectively). There was a trend (p = 0.05; statistical power to detect an 0.85-fold difference in differential expression was 52.2%) toward a decrease in ATP5G3 mRNA expression in subjects with BD compared with controls, while the UQCRC2 mRNA level did not show any change (p = 0.52) (Fig. 2). We further assessed the effect of sex, age and postmortem interval on the expression of NDUFS7, COX6C and ATP5G3. We found no difference in NDUFS7 (p = 0.22), COX6C (p = 0.13) and ATP5G3 (p = 0.61) expression between male and female subjects. We also found no correlation between age and expression of NDUFS7 (_r_62 = –0.021, p = 0.87), COX6C (_r_62 = 0.036, p = 0.78) or ATP5G3 (_r_62 = 0.13, p = 0.31) and no correlation between postmortem interval and expression of NDUFS7 (_r_62 = –0.092, p = 0.47), COX6C (_r_62 = –0.020, p = 0.88) and ATP5G3 (_r_62 = 0.018, p = 0.89). However, pH values were significantly correlated with expression of NDUFS7 (_r_62 = 0.4, p = 0.001), COX6C (_r_62 = 0.383, p = 0.002) and ATP5G3 (_r_62 = 0.499, p < 0.001). In addition, tissue pH values were significantly lower in subjects with BD than in control subjects (Table 1).
Fig. 2: The mRNA level of NADH-ubiquinone oxidoreductase 20-kd subunit (NDUFS7), ubiquinol-cytochrome c reductase complex core protein 2 (UQCRC2), cytochrome c oxidase polypeptide Vic (COX6C) and ATP synthase lipid-binding protein (ATP5G3) in control (CTL) subjects and subjects with bipolar disorder (BD). The mRNA level was measured by real-time quantitative polymerase chain reaction (PCR). rRNA was used as an endogenous control for normalization. The results presented indicate the mean mRNA level and standard error of the mean for each gene studied (n = 33). A schema illustrating the specific mitochondrial electron transport chain complexes in which gene regulation was altered in subjects with BD appears below the results of PCR analysis. Points at which electrons are transferred to molecular oxygen by complexes I, II and III are denoted by curved arrows. *indicates p < 0.05, **indicates p < 0.01 and + indicates 0.05 < p < 0.10 when compared with control subjects using the Mann–Whitney U test.
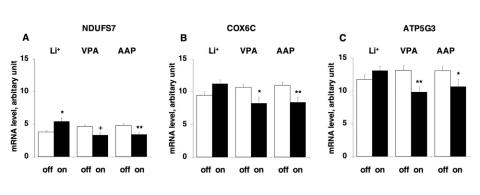
Next, we examined the effect of medication treatment at the time of death on these 3 genes: NDUFS7, COX6C and ATP5G3. On the basis of the medical records, we divided the subjects with BD into 2 groups, on or off treatment, with the treatment group being further subdivided according to the major mood-stabilizing drugs used to treat BD, namely, lithium, valproate and atypical antipsychotics, and also antidepressants. As shown in (Figure 3, subjects treated with lithium showed a significantly increased mRNA level of NDUFS7 (p = 0.016), when compared with subjects without lithium treatment, but no difference in the expression of the other 2 genes. However, subjects treated with valproate showed a decrease in the trend mRNA level of NDUFS7 (p = 0.06; statistical power to detect an 0.71-fold difference in differential expression was 65.3%) and significantly decreased mRNA levels of COX6C (p = 0.013) and ATP5G3 (p = 0.003) when compared with subjects not on valproate at the time of death. Subjects treated with atypical antipsychotics also showed significantly decreased mRNA levels of NDUFS7, COX6C and ATP5G3, when compared with subjects who were not receiving this treatment at the time of death (p = 0.007, p = 0.008 and p = 0.046, respectively). Antidepressants did not show any effects on the mRNA levels of these 3 genes.
Fig. 3: Effect of lithium (Li+), valproate (VPA) and atypical antipsychotics (AAP) on mRNA levels of NADH-ubiquinone oxidoreductase 20-kd subunit (NDUFS7), cytochrome c oxidase polypeptide Vic (COX6C) and ATP synthase lipid-binding protein (ATP5G3) in the postmortem frontal cortex of subjects with bipolar disorder. The mRNA level was measured by real-time quantitative polymerase chain reaction. rRNA was used as an endogenous control for normalization. The results are the mean and standard error of the mean (n = 9–24). *indicates p < 0.05, **indicates p < 0.01 and + indicates 0.05 < p < 0.10 using the Mann–Whitney U test.
Discussion
In the present study, we used high-density cDNA arrays to analyze gene-expression profiles in the postmortem prefrontal cortex obtained from subjects with BD. We found that a number of genes are differentially expressed between controls and subjects with BD, including genes that are clustered in ETC pathways. Because the ETC is located in mitochondria, we further examined the expression of other mitochondria-related genes in these subjects and found 15 additional genes that were also differentially expressed between control subjects and those with BD. These findings add to the growing body of evidence indicating mitochondrial dysfunction in the brain of subjects with BD.
Two other independent laboratories using microarray technology have also reported differential expression of mitochondria-related genes between controls and subjects with BD. Iwamoto et al22 used Affymetrix oligonucleotide arrays on the same postmortem frontal cortex brain tissue as used in our work, provided by Stanley Foundation Array Collection. They found that about 15% of mitochondrial probe sets were significantly altered and that 94% of these altered mitochondrial probe sets showed downregulation in BD when compared with control subjects. Konradi et al,7 also using Affymetrix oligonucleotide array in the postmortem hippocampus from another brain bank, found that expression of many mRNAs coding for complex I–V subunits was significantly decreased in subjects with BD, but not in those with schizophrenia. Four of these genes (COX5A, COX6C, ATP5J and ATP5C1) were also found in our studies to be downregulated in the postmortem frontal cortex of subjects with BD. In addition, Bosetti et al,23 using DNA microarray analysis, found that long-term lithium treatment regulates the expression of several mitochondrial enzymes in the rat brain. Here we report the differential expression of 23 mitochondria-related genes in BD, including 8 downregulated ETC components, using a different microarray technique, namely, DNA spot arrays. These findings from different tissue samples, brain regions and array methodologies provide converging evidence that mitochondrial dysfunction may underlie the pathophysiology of BD.
Mitochondria, whose major components include outer and inner membranes and ETC complexes I–V, play a pivotal role in regulating energy production. Protons from oxidation of fuel molecules are transferred by complex I, II, III and IV from outside the outer membrane to the cytosolic side of the inner membrane, a process that generates an electrochemical proton gradient. This proton gradient is essential in adenosine triphosphate (ATP) synthesis in complex V.24 When the ETC generates the electrochemical proton gradient that drives ATP synthesis, it also induces production of reactive oxygen species. The major sources of mitochondrial reactive oxygen species production are the ubiquinone sites in complexes I and III.25 We found, using both DNA array analysis and real-time PCR, that the expression of NDUFS7, a subunit of complex I, is decreased in the frontal cortex in subjects with BD, suggesting overproduction of reactive oxygen species in this disorder. We also found that ATP5G3, a subunit of complex V, is downregulated in subjects with BD. Downregulation of complex V may affect the synthesis of ATP and ATP-dependent processes. In addition, expression of the antioxidant superoxide dismutase 1, glutathione peroxidase 4 and glutathione _S_-transferase pi1 is decreased. Decreased expression may lead to deficiency of these antioxidant enzymes. Whether changes in mRNA levels of identified genes reflect changes in their protein levels, and whether decreased expression of components of the ETC complex and antioxidant enzymes in BD contributes to overproduction of reactive oxygen species and to synthesis of ATP, requires further investigation.
It is interesting that the average pH value in the postmortem frontal cortex of subjects with BD that we used in our study is significantly lower than in control subjects. It has been reported that the pH is lower in the postmortem brain of individuals who suffered prolonged agonal states, such as in respiratory arrest, multi-organ failure and coma.26 However, most subjects included in our study died from cardiac events and suicide. Only 1 of 35 subjects with BD and 2 of 35 control subjects died from respiratory arrest. This suggests that lower pH may be directly related to BD disease. Indeed, it has been reported that intracellular pH is lower in the frontal lobes and basal ganglia of patients with BD when compared with controls.27,28 We also found that expression of complex subunits was significantly correlated with tissue pH value. Expression of complex subunits was lower in subjects with lower brain pH. These findings also support the hypothesis that decreased pH in BD is the result of mitochondrial dysfunction and not due to differences in agonal state.
There is increasing evidence that mitochondrial dysfunction is important in the pathophysiology of BD. For example, Kato et al29 found in patients with BD in the euthymic state that phosphomonoester levels were decreased in the frontal and temporal lobes, whereas phosphodiester levels were increased in the frontal lobes. Mitochondrial dysfunction can result from abnormal expression of nuclear or mitochondrial genes coding for mitochondrial proteins. Kato and Kato21 also found increased deletion of mitochondrial DNA in the cerebral cortex of autopsied brain from subjects with BD. Mitochondrial dysfunction also increases anaerobic energy production and lactate production. Dager et al30 found increased levels of grey-matter lactate in patients with BD. Previous studies in our laboratory also found in the postmortem frontal cortex of subjects with BD that endogenous antioxidant microsomal glutathione _S_-transferase was downregulated.31 These findings, together with ours, suggest that the pathology of BD may involve mitochondrial dysfunction, resulting in abnormal energy metabolism and overproduction of reactive oxygen species. These findings also raise the possibility that neuroprotection against oxidative damage may be one of the mechanisms of action of mood-stabilizing drugs. Cell loss and damage in key brain regions such as the prefrontal cortex occur in BD, although the causes of the cellular changes remain unknown.32–34 There results also support the possibility that mitochondrial dysfunction may play a role in neuronal damage or loss in BD.
Long-term lithium treatment has been shown to protect against oxidative damage to lipid and protein in primary cultured rat cerebral cortical cells,16 suggesting that at least some targets of this treatment may be mitochondria. We therefore analyzed the effects of treatment on the expression of NDUFS7, COX6C and ATP5G3, subunits of complexes I, IV and V, respectively, at the time of death in subjects with BD. Treatment with lithium significantly increased the expression of NDUFS7, with the changes in the other 2 mitochondrial genes being in the same direction. This effect in subjects with BD was the opposite of that seen in controls. This suggests that complex I may be a potential target for lithium and lends further support to the antioxidant effects of lithium treatment already seen in animal studies. In contrast, both valproate and atypical antipsychotics have been shown to decrease expression of NDUFS7, COX6C and ATP5G3, which suggests potentially different targets for these mood-stabilizing drugs in patients with BD and also that there is no class effect of these drugs on these ETC intermediates. Further study of the potentially opposing effects of treatment with psychotropic drugs in animal studies and patient samples will help to clarify the effects of mood stabilizers on these pathways.
In summary, cDNA spot microarray technology was used to analyze gene-expression profiles in the postmortem frontal cortex of subjects with BD. We found that expression of 23 mitochondria-related genes, including 8 downregulated components of the mitochondrial ETC, were altered in subjects with BD. The similarities of findings by different independent laboratories, using different microarray platforms, and different postmortem brain collections provide convergent evidence that mitochondrial ETC function may play an important role in the pathophysiology of BD and its treatment. Mitochondrial ETC is a major source of reactive oxygen species that induce oxidative damage by causing DNA mutation, protein cleavage and lipid peroxidation, and these processes may be a target for lithium treatment. Further study of mitochondrial function and, in particular, the ETC will help to elucidate the precise molecular changes important to the development of BD.
Acknowledgments
This work is supported by grants from the Canadian Institutes of Health Research (L.T.Y. and J.F.W.), the Stanley Medical Research Institute (L.T.Y.), the Ontario Mental Health Foundation (J.F.W. and L.T.Y.) and NARSAD Young Investigator Awards (J.F.W.). Specimens were donated by The Stanley Medical Research Institute Brain Collection courtesy of Drs. Michael B. Knable, E. Fuller Torrey, Maree J. Webster and Robert H. Yolken
Footnotes
Contributors: Drs. Sun, Wang and Young designed the study. Dr. Sun acquired the data, and all the authors analyzed it. Drs. Sun, Wang and Young wrote the article. All the authors reviewed it and gave final approval for publication.
Competing interests: None declared.
Correspondence to: Dr. L. Trevor Young, Centre for Addiction and Mental Health, 250 College St., Rm. 814, Toronto ON M5T 1R8; fax 416 260-4189; trevor_young@camh.net
References
- 1.Tondo L, Isacsson G, Baldessarini R. Suicidal behaviour in bipolar disorder: risk and prevention. CNS Drugs 2003;17:491-511. [DOI] [PubMed]
- 2.Manji HK, Lenox RH. The nature of bipolar disorder. J Clin Psychiatry 2000;61(Suppl 13):42-57. [PubMed]
- 3.Bezchlibnyk Y, Young LT. The neurobiology of bipolar disorder: focus on signal transduction pathways and the regulation of gene expression. Can J Psychiatry 2002;47:135-48. [DOI] [PubMed]
- 4.Segurado R, Detera-Wadleigh SD, Levinson DF, et al. Genome scan meta-analysis of schizophrenia and bipolar disorder, part III: bipolar disorder. Am J Hum Genet 2003;73:49-62. [DOI] [PMC free article] [PubMed]
- 5.Hakak Y, Walker JR, Li C, et al. Genome-wide expression analysis reveals dysregulation of myelination-related genes in chronic schizophrenia. Proc Natl Acad Sci U S A 2001;98:4746-51. [DOI] [PMC free article] [PubMed]
- 6.Iwamoto K, Kakiuchi C, Bundo M, et al. Molecular characterization of bipolar disorder by comparing gene expression profiles of postmortem brains of major mental disorders. Mol Psychiatry 2004;9:406-16. [DOI] [PubMed]
- 7.Konradi C, Eaton M, MacDonald ML, et al. Molecular evidence for mitochondrial dysfunction in bipolar disorder. Arch Gen Psychiatry 2004;61:300-8. [DOI] [PubMed]
- 8.Prabakaran S, Swatton JE, Ryan MM, et al. Mitochondrial dysfunction in schizophrenia: evidence for compromised brain metabolism and oxidative stress. Mol Psychiatry 2004;9:684-97,643. [DOI] [PubMed]
- 9.Fuster JM. Frontal lobe and cognitive development. J Neurocytol 2002;31:373-85. [DOI] [PubMed]
- 10.Heilman KM, Gilmore RL. Cortical influences in emotion. J Clin Neurophysiol 1998;15:409-23. [DOI] [PubMed]
- 11.Drevets WC, Ongur D, Price JL. Neuroimaging abnormalities in the subgenual prefrontal cortex: implications for the pathophysiology of familial mood disorders. Mol Psychiatry 1998;3:220-6. [DOI] [PubMed]
- 12.Rajkowska G, Halaris A, Selemon LD. Reductions in neuronal and glial density characterize the dorsolateral prefrontal cortex in bipolar disorder. Biol Psychiatry 2001;49:741-52. [DOI] [PubMed]
- 13.Soares JC, Mann JJ. The functional neuroanatomy of mood disorders. J Psychiatr Res 1997;31:393-432. [DOI] [PubMed]
- 14.Torrey EF, Webster M, Knable M, et al. The Stanley Foundation brain collection and Neuropathology Consortium. Schizophr Res 2000;44:151-5. [DOI] [PubMed]
- 15.American Psychiatric Association. Diagnostic and statistical manual of mental disorders. 4th ed. Washington: the Association; 2000.
- 16.Shao L, Young LT, Wang JF. Chronic treatment with mood stabilizers lithium and valproate prevents excitotoxicity by inhibiting oxidative stress in rat cerebral cortical cells. Biol Psychiatry 2005;58:879-84. [DOI] [PubMed]
- 17.Novoradovskaya N, Whitfield ML, Basehore LS, et al. Universal Reference RNA as a standard for microarray experiments. BMC Genomics 2004;5:20. [DOI] [PMC free article] [PubMed]
- 18.Churchill GA. Fundamentals of experimental design for cDNA microarrays. Nat Genet 2002;32(Suppl):490-5. [DOI] [PubMed]
- 19.Higuchi R, Fodder C, Dollinger G, et al. Kinetic PCR analysis: real-time monitoring of DNA amplification reactions. Biotechnology (N Y) 1993;11:1026-30. [DOI] [PubMed]
- 20.Deicken RF, Weiner MW, Fein G. Decreased temporal lobe phosphomonoesters in bipolar disorder. J Affect Disord 1995;33:195-9. [DOI] [PubMed]
- 21.Kato T, Kato N. Mitochondrial dysfunction in bipolar disorder. Bipolar Disord 2000;2:180-90. [DOI] [PubMed]
- 22.Iwamoto K, Bundo M, Kato T. Altered expression of mitochondria-related genes in postmortem brains of patients with bipolar disorder or schizophrenia, as revealed by large-scale DNA microarray analysis. Hum Mol Genet 2005;14:241-53. [DOI] [PubMed]
- 23.Bosetti F, Seemann R, Bell JM, et al. Analysis of gene expression with cDNA microarrays in rat brain after 7 and 42 days of oral lithium administration. Brain Res Bull 2002;57:205-9. [DOI] [PubMed]
- 24.Alberts B, Bray D, Lewis J, et al. Molecular biology of the cell. 3rd ed. New York: Garland Publishing, Inc.; 1994.
- 25.Maher P, Schubert D. Signaling by reactive oxygen species in the nervous system. Cell Mol Life Sci 2000;57:1287-305. [DOI] [PMC free article] [PubMed]
- 26.Li JZ, Vawter MP, Walsh DM, et al. Systematic changes in gene expression in postmortem human brains associated with tissue pH and terminal medical conditions. Hum Mol Genet 2004;13: 609-16. [DOI] [PubMed]
- 27.Kato T, Takahashi S, Shioiri T, et al. Alterations in brain phosphorous metabolism in bipolar disorder detected by in vivo 31P and 7Li magnetic resonance spectroscopy. J Affect Disord 1993;27:53-9. [DOI] [PubMed]
- 28.Hamakawa H, Murashita J, Yamada N, et al. Reduced intracellular pH in the basal ganglia and whole brain measured by 31P-MRS in bipolar disorder. Psychiatry Clin Neurosci 2004;58:82-8. [DOI] [PubMed]
- 29.Kato T, Inubushi T, Kato N. Magnetic resonance spectroscopy in affective disorders. J Neuropsychiatry Clin Neurosci 1998;10:133-47. [DOI] [PubMed]
- 30.Dager SR, Friedman SD, Parow A, et al. Brain metabolic alterations in medication-free patients with bipolar disorder. Arch Gen Psychiatry 2004;61:450-8. [DOI] [PubMed]
- 31.Bezchlibnyk YB, Wang JF, McQueen GM, et al. Gene expression differences in bipolar disorder revealed by cDNA array analysis of post-mortem frontal cortex. J Neurochem 2001;79:826-34. [DOI] [PubMed]
- 32.Benes FM, Vincent SL, Todtenkopf M. The density of pyramidal and nonpyramidal neurons in anterior cingulate cortex of schizophrenic and bipolar subjects. Biol Psychiatry 2001;50:395-406. [DOI] [PubMed]
- 33.Rajkowska G, Halaris A, Selemon LD. Reductions in neuronal and glial density characterize the dorsolateral prefrontal cortex in bipolar disorder. Biol Psychiatry 2001;49:741-52. [DOI] [PubMed]
- 34.Vawter MP, Freed WJ, Kleinman JE. Neuropathology of bipolar disorder. Biol Psychiatry 2000;48:486-504. [DOI] [PubMed]
