Antioxidant activity of Ferrozine–iron–amino acid complexes (original) (raw)
Abstract
Amino acid–Fe(II)–chelator complexes exhibit strong antioxidant activity. Taking advantage of the unique spectral characteristics of the complexes formed when Ferrozine (Fz) is used as the chelator, we now show that the primary blue complex (ɛmax at 632 nm) decomposes by two independent pathways: (i) a nonoxidative pathway involving dissociation of the amino acid component and formation of a purple complex (ɛmax at 562 nm) and (ii) an oxidative pathway leading to Fe(III) and colorless products. Quantitative conversion of the blue to purple complex yields an isosbestic point (i.p.) at 601 nm, whereas no i.p. is formed during quantitative oxidation of the blue complex. However, under some experimental conditions, decomposition of the blue product occurs by both pathways, leading to occurrence of a clean i.p. at wavelengths varying from 601 to 574 nm. Results of simulation experiments, confirmed by direct analysis, demonstrate that shifts in the i.p. reflect differences in the fractions of blue compound that decompose by the oxidative and nonoxidative pathways. Indeed, the fraction of blue that is converted to the purple complex is readily deduced from the wavelength of the i.p. These results suggest that identification of a physiological chelator that can replace Ferrozine in amino acid–iron complexes might have important physiological and pharmacological applications.
The oxidation of amino acids by the Fenton reagent [H2O2 + Fe(II) or Fe(III)] leads to the production of NH4+, CO2, α-ketoacids, and aldehydes or carboxylic acids containing one less carbon atom (1, 2). The oxidation is almost completely dependent on the presence of bicarbonate ion and is greatly stimulated by stoichiometric amounts of any one of a variety of iron chelators, including desferioxamine, diethylenetriaminepentaacetic acid, EDTA, α,α-dipyridyl, nitrilotriacetic acid, Ferrozine (Fz), or ADP. On the basis of these observations, it was postulated that the metal ion-mediated oxidation of amino acids is a caged process that is optimized by the interaction of HCO3−, chelator, Fe(II), and amino acid to form a quaternary complex of favorable redox potential and in which Fe(II) undergoes cyclic hydrogen peroxide (H2O2)-mediated redox cycling with concomitant oxidation of the amino acid in the complex. The possibility that such redox cycling may contribute to cellular antioxidant capacity was suggested further by the demonstration that similar complexes in which Fe(II) is replaced by Mn(II) exhibit catalase-like activity (2–4). The potential physiological importance of such antioxidant activity is suggested by the results of subsequent studies showing that supplementation of culture media with Mn(II), bicarbonate, and an amino acid (glycine) protected endothelial cells from killing by H2O2 and prevented lung injury in rats provoked by intratracheal instillation of glucose and glucose oxidase (5).
A potentially useful model for mechanistic studies on the antioxidant activity of amino acid/Fe(II)/chelator complexes was suggested by the serendipitous observation (1, 6) that addition of Fe(II) to reaction mixtures containing an amino acid and the iron chelator Fz led to transient formation of a blue complex that decomposed to yield the well-characterized purple complex [Fe(II)Fz3]. Formation of the latter is the basis of a highly sensitive procedure for the estimation of Fe(II) concentrations in biological samples (7–9). Whereas the purple complex is resistant to oxidation, we show here that the amino acid-containing blue complex is highly sensitive to oxidation by H2O2 or O2. This further supports the possibility that complexes between amino acids, transition metals, and endogenous metal ion chelators may contribute to the antioxidant activity of the cell.
Experimental Procedures
Materials.
Fz was from Aldrich; hydrogen peroxide (30%), from Fisher; ferrous sulfate, from Baker; catalase (20 mg/ml), from Boehringer Mannheim; and superoxide dismutase (SOD), 2750 units/mg, from Sigma. Light absorption spectra were taken on a Cary 4 spectrophotometer. Immediately before use, stock solutions of 2 M FeSO4 in 2 M HCl were diluted to 1 or 2 mM with ice-cold water. Reaction mixtures with various amounts of Fz, amino acid, and Hepes buffer were added to the reference and sample cuvettes, and the reactions were started by addition of FeSO4 to the sample cuvette only. Spectra (750–400 nm) were recorded immediately and at various time intervals (usually 1 to 2 min) thereafter. Unless noted otherwise, pH was 7.6 and temperature was 25°C.
Methods.
The amounts of purple and blue compounds in reaction mixtures were determined from their absorption. On the basis of results summarized below, the millimolar extinction coefficients (_E_mM) of the blue compound at various wavelengths were determined (Table 1). The blue compound has significant absorption at 700 nm (_E_mM = 6.1 mM−1⋅cm−1), but not the purple compound. Thus, the concentration of the blue compound in reaction mixtures is
 |
1 |
|---|
The extinction coefficient of the purple complex is known (_E_mM = 27.9 mM−1⋅cm−1) (9). Thus, in the absence of the blue compound, the concentration of the purple compound is
 |
2 |
|---|
Because the blue compound also absorbs at 562 nm (_E_mM = 8.94 mM−1⋅cm−1), the concentration of purple complex in mixtures containing the blue complex is given by
 |
3 |
|---|
Table 1.
Extinction coefficients of the blue and purple complexes at various wavelengths
| Wavelength, nm | Extinction coefficient, mM−1⋅cm−1 | |
|---|---|---|
| Purple complex* | Blue complex† | |
| 562 | 27.9 | 8.94 |
| 600 | 12.1 | 12.1 |
| 635 | 3.8 | 15.3 |
| 700 | <0.2 | 6.1 |
Results
We confirmed that Fe(II) reacts with Fz to form a stable oxidation-resistant complex (_A_max = 562 nm) of the composition, Fe(II)Fz3, now designated the “purple complex.” However, when Fe(II) is added to reaction mixtures containing Fz and an amino acid, a blue complex (_A_max = 630–635 nm) of uncertain composition is the primary colored product. This “blue complex” may undergo conversion to the more stable purple complex at a rate controlled by the amino acid involved and by the relative concentrations of amino acid and Fz or, depending upon experimental conditions, may undergo oxidation to form Fe(III) and colorless products.
Amino Acid Specificity.
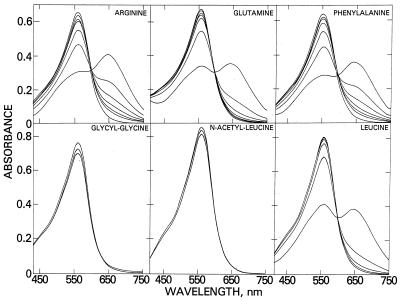
The time-dependent spectral changes when Fz and Fe(II) were incubated with arginine, glutamate, phenylalanine, and leucine are shown in Fig. 1. All other amino acids tested except proline exhibited similar spectral characteristics. The first spectrum recorded after addition of Fe(II) has peak of absorbance at 630 nm. The time-dependent decrease in amplitude at 630 nm was accompanied by an increase at 562 nm along with the appearance of an isosbestic point (i.p.) at 600 nm, suggesting a stoichiometric conversion of the blue to the purple complex. Semilogarithmic plots of the concentration of blue complex vs. time are linear (not shown), indicative of a pseudo-first-order process. The amounts of blue complex formed by various amino acids and the rate of conversion to the purple complex are shown in Table 2. The dipeptide glycylglycine and the _N-_acetyl amino acids (except_N-_acetylhistidine) failed to form blue complexes (Fig. 1, Table 2), suggesting that formation of the blue complex requires an α-amino group. The imidazole nitrogen of _N-_acetylhistidine may substitute for the α-amino group.
Figure 1.
Formation of a transient blue complex by interaction of amino acid, Fz, and Fe(II). Reaction mixtures (1 ml) initially contained 20 mM Hepes buffer (pH 7.6), 160 μM Fz, and 80 mM amino acid, peptide, or _N-_acetyl amino acid. Spectral changes were initiated and monitored as described in Experimental Procedures. The symbols * and # identify initial and 10-min spectra, respectively.
Table 2.
Dependency of blue complex formation and its subsequent decomposition on amino acid structure
| Amino acid | Blue complex, μM | _k_1, min−1 |
|---|---|---|
| Asparagine | 8.5 | 0.68 |
| Glycine | 14.0 | 0.94 |
| Serine | 19.8 | 0.69 |
| Glutamate | 10.3 | 0.69 |
| Leucine | 23.2 | 0.63 |
| Glutamine | 21.5 | 0.53 |
| Methionine | 23.5 | 0.46 |
| Lysine | 24.9 | 0.32 |
| Arginine | 25.5 | 0.28 |
| Phenylalanine | 22.5 | 0.26 |
| Histidine | 25.0 | 0.05 |
| Proline | 0.0 | — |
| _N_-Acetylglycine | 0.0 | — |
| _N_-Acetylleucine | 0.0 | — |
| _N_-Acetylhistidine | 13.4 | 0.58 |
| Glycylglycine | 0.0 | — |
Effect of Histidine Concentration on Conversion of the Blue to the Purple Complex.
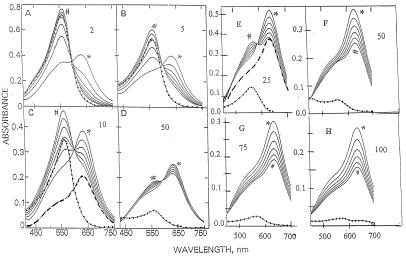
Because the blue complex formed with histidine is by far the most stable of all amino acid complexes studied (Table 2), it was selected for more extensive studies. Fig. 2 shows spectral changes induced by addition of Fe(II), Fz, and various concentrations of histidine. Panels A to D summarize results from experiments in which 95 μM Fe(II) was added to mixtures containing 380 μM Fz and 2–50 mM histidine. The first spectrum obtained immediately after addition of Fe(II) exhibits a maximum at 630 nm and a shoulder at 562 nm. Spectra recorded at 2-min intervals exhibit decreases in absorbance at 630 nm and increases at 562 nm. For the other amino acid complexes (Fig. 1), the i.p. at 600 nm reflects conversion of the primary blue complex of unknown composition to the more stable purple complex [Fe(II)Fz3].
Figure 2.
Effect of histidine concentration on formation and decomposition of the blue complex. For A–D, reaction mixtures (1 ml) contained 20 mM Hepes buffer (pH 7.6), 380 μM Fz, 100 μM FeSO4, and various concentrations (2–50 mM) of histidine as indicated by the numbers in the panel. For E–H, the reaction mixtures contained 150 μM Fz and 50 μM FeSO4. Spectral changes were initiated and monitored as described in_Experimental Procedures_. The dotted lines represent the spectra obtained immediately after addition of 30 mM H2O2 following the 10-min recording. The heavy broken lines in C and E illustrate the calculated difference spectrum obtained by subtracting the 10-min spectrum from the initial (zero-time) spectrum. The initial (zero-time) and 10-min spectra are identified by * and #, respectively.
Results with 50 μM Fe(II) and 150 μM Fz and 25–100 mM histidine are summarized in Fig. 2 E–H. Under these conditions, the time-dependent spectral changes are significantly different. Only at 25 mM histidine was the time-dependent decrease at 630 nm associated with the formation of an i.p. At higher histidine concentrations, the time-dependent decrease in absorbance is due almost entirely to a decrease in amplitude reflecting conversion to colorless derivatives. The fact that very little, if any, purple complex is formed was verified by results of studies on the effects of H2O2 (discussed below).
Effect of Oxygen.
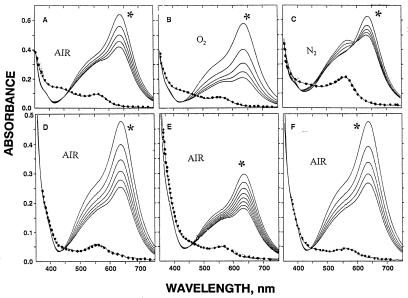
Although the amplitude of the spectra shown in Fig. 2 decreases with time, the spectra at each time point are qualitatively similar. This, the absence of an i.p., and detection of only small amounts of purple complex after H2O2 treatment indicate that decomposition of the blue complex occurs by a pathway that does not lead to a colored product. That the loss of blue compound is due to oxidation by molecular oxygen is supported by the data in Fig. 3 A–C, in which mixtures were incubated under air, oxygen, or 100% nitrogen. The time-dependent spectral changes observed in 100% oxygen are due almost entirely to changes in amplitude; moreover, the rate of change in 100% oxygen is very much faster than in air. In the absence of O2, the time-dependent loss of at 630 nm is much slower and is associated with an increase in absorbance at 562 nm and the appearance of an i.p. at 600 nm. Thus, the spectral changes observed in the presence of air or 100% O2 are due almost entirely to oxidation of the blue compound, whereas the changes observed in the absence of O2 are due to conversion of the blue compound to the purple compound. These conclusions are further supported by the effect of adding H2O2 10 min after starting the reactions: little purple compound was detected in reactions in air or oxygen, whereas the amount of blue compound that disappeared in the nitrogen atmosphere was fully accounted for as the purple complex (Fig.3C).
Figure 3.
Effect of oxygen on decomposition of the blue complex. For data in_A–C_, reaction mixtures contained 80 mM histidine, 150 μM Fz, 50 μM Fe(II), and 50 mM Hepes buffer (pH 7.6). The gas phase was as follows: air, A; 100% O2,B; 100% N2, C. For data in_D–F_, reaction mixtures (in air) contained 50 mM histidine, 150 μM Fz, and 150 μM Fe(II). In addition, in_D_ and F mixtures contained 1 μM catalase and 50 μg of SOD, and in E and_F_ mixtures contained 75 μM H2O2. All reactions were initiated by addition of iron and spectra were recorded at 2-min intervals. Immediately after the 10-min spectra had been recorded, 30 mM H2O2 was added and the spectra were recorded again (dotted lines) to disclose the amount of purple compound formed. Symbols as in Fig 2.
That O2-dependent oxidation involves conversion of the Fe(II) in the blue complex to Fe(III) is supported by the fact that addition of an iron-reducing agent (either hydroxylamine or ascorbate) after the reaction has stopped leads to regeneration of an amount of blue compound that had disappeared by the oxidation route, and it is almost quantitatively converted to the purple derivative (data not shown). Furthermore, if the reaction is initiated by addition of Fe(III) rather than Fe(II), no colored products are observable unless either hydroxylamine or ascorbate is also present; then the blue compound is formed and is almost quantitatively converted to the purple compound–even in the presence of air.
Because the blue compound is sensitive to oxidation by H2O2, it appeared possible that the observed O2-dependent oxidation involves the intermediate formation of H2O2 by the Haber–Weiss mechanism:
 |
4 |
|---|
 |
5 |
|---|
 |
6 |
|---|
This possibility was discounted by the data in Fig. 3D, showing that the presence of catalase and SOD did not prevent the destruction of the blue complex by O2. The decrease in amplitude observed was indistinguishable from with no catalase or SOD. To be confident that the amounts of catalase and SOD used were sufficient to prevent the loss of blue complex by an H2O2-dependent mechanism, a study was carried out in which 75 μM H2O2 was added to the reaction mixtures before addition of the Fe(II). This level of H2O2 is sufficient to oxidize one-half of the added Fe(II) and thereby reduce the yield of blue compound by about 60% (compare Fig. 3 D and_E_). With 75 μM H2O2 and catalase and SOD, the yield of blue compound (Fig. 3F) was identical to that observed in Fig. 3D. Thus, free H2O2 is not involved in the time-dependent, oxygen-dependent loss of blue complex. Furthermore, if the oxidation of Fe(II) by O2 does occur under these experimental conditions, it does not lead to the production of H2O2.
Effect of Hydrogen Peroxide on the Spectra.
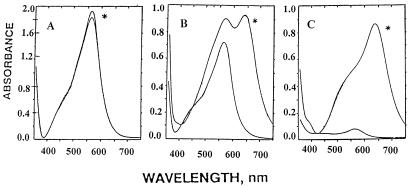
To study the effect of H2O2 on the complexes formed in the presence and absence of amino acids, Fe(II) was added to reaction mixtures containing 400 μM Fz and 0, 8, or 80 mM histidine. Immediately after each spectrum had been recorded, 30 mM H2O2 was added and the spectrum was recorded again. As shown in Fig.4A, H2O2 had no effect on the purple complex, [Fe(II)–(Fz)3], formed in the absence of histidine. However, addition of H2O2 to the sample with 8 mM histidine led to complete loss of the 630-nm-absorbing species and the unmasking of a substantial amount of the 562-nm-absorbing material that was formed at this low histidine level (Fig. 4B). This observation indicates rapid conversion of the blue to the purple compound before addition of H2O2 when the histidine/Fz ratio is low. In contrast, the spectrum obtained in the presence of 80 mM histidine (Fig. 4C) was completely quenched by H2O2, indicating that the blue complex is rapidly oxidized to colorless products. This interpretation is supported also by the results in Fig. 2 showing that addition of H2O2 after 10-min incubation leads to complete loss of residual blue complex and to unmasking of the purple complex (λmax = 562 nm) that formed during the 10-min incubation period (Fig. 2, dotted lines). As noted above, very little purple complex was detected after H2O2 treatment of the samples Fig. 2 F, G, and H, confirming that under these conditions the blue complex is converted almost entirely to colorless derivatives. Significantly, there is an inverse relationship between the initial histidine concentration and the rate of blue compound disappearance and the amount of purple complex detected after addition of H2O2.
Figure 4.
Oxidation of the blue complex by H2O2. Reaction mixtures contained 50 mM Hepes buffer (pH 7.55), 400 μM Fz, 60 μM FeSO4, and no (A), 8 (B), or 80 (C) mM histidine. Immediately after each spectrum was first recorded, 30 mM H2O2 was added and the spectrum was recorded again.
Extinction Coefficients of the Blue Complex.
The heavy dashed line in Fig. 2 C and E is the calculated difference spectrum between those obtained immediately before and after addition of H2O2. With the assumption that H2O2 oxidizes only the blue complex, this difference spectrum is the true spectrum of the blue complex. The assumption is validated by the fact that, when normalized to account for differences in amplitude, the difference spectra between untreated and H2O2-treated samples (Fig. 2 C and E) are the same as obtained for the initial spectrum of reaction mixtures (Fig.2H) in which little, if any, purple derivative is formed.
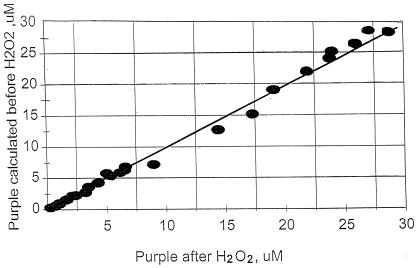
If the presence of the i.p. at 600 nm (Fig. 2 A–E) reflects quantitative conversion of the blue complex to the purple complex, then the extinction coefficients for the purple and blue complexes at the i.p. should be identical and equal to that of the purple complex alone at 600 nm (_E_600 = 12.1 mM−1⋅cm−1). Coupled with the assumption that the difference spectrum in Fig.2E is the spectrum of the blue complex, the extinction coefficients of the blue complex at other wavelengths were calculated as described in Experimental Procedures (Table1). The validity of these constants is supported by the fact that the amounts of purple complex formed in various reaction mixtures calculated with Eqs. 2 and 3 are in good agreement with the amounts calculated for the spectra of the purple compound observed immediately after the addition of H2O2 (Fig.5).
Figure 5.
Estimation of purple complex before and after H2O2 treatment. Reaction mixtures contained various amounts of Fz, FeSO4, and histidine, and reactions were initiated as described in the legend of Fig. 1. Immediately after the 10-min spectra were recorded, 30 mM H2O2 was added and the spectra were recorded again. The amount of purple complex present after the 10-min incubation period was calculated from the spectra obtained immediately before and after the H2O2 addition on the basis of Eqs. 3 and 2, respectively, as described in Experimental Procedures.
Effect of Reaction Conditions on Rates of Blue Compound Formation and Its Oxidation or Conversion to the Purple Complex.
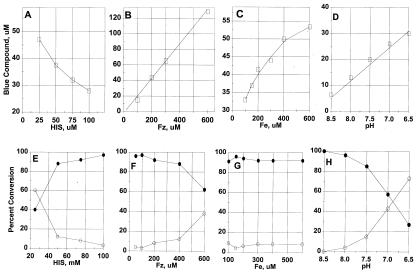
The yield of blue compound formation and its subsequent oxidation by O2 or conversion to the purple compound are complex functions of pH and the relative concentrations of reactants. Data summarized in Fig. 6 illustrate how composition of the reaction mixture affects the synthesis of the blue compound and its subsequent conversion to the purple compound or to oxidized colorless products. Fig. 6A shows that the amount of blue complex formed decreases with increasing concentrations of histidine when Fz and Fe(II) are held constant. In contrast, the amount of blue compound formed increases with increasing concentrations of either Fz (B) or iron (C) with the concentrations of the other two reactants held constant. Results summarized in Fig. 6 E, F, and G are from the same experiments as in Fig. 6 A, B, and C, respectively. They show how composition of the reaction mixture affects the fractions of the blue compound that are converted to the purple compound or to oxidized products during a 10-min incubation period after its initial formation. As shown in Fig. 6E, the fraction of blue that is converted to the purple compound decreases with increasing concentration of histidine and at high concentrations (100 mM) the blue compound is almost quantitatively decomposed by the oxidative pathway. To the contrary, increasing the concentration of Fz favors conversion to the purple complex (Fig. 6F). Under the conditions of these experiments, variations in the level of iron had little or no effect on the pathway of blue compound decomposition (Fig.6G).
Figure 6.
Effect of Fe, histidine, and Fz concentrations and pH on blue compound formation and its subsequent conversion to purple and colorless products. Concentrations of reactants were as follows: (A and E) 150 μM Fe(II), 150 μM Fz, and histidine as indicated; (B and F) 150 μM Fe, 150 mM histidine, and Fz as indicated; (C and_G_) 150 μM Fz, 150 mM histidine, and Fe(II) as indicated; (D and H) 100 μM Fz, 100 μM Fe(II), 100 mM histidine, and pH varied as indicated. □, initial blue; ○, % purple compound; ●, % colorless products.
Effect of pH.
Other data in Fig. 6 show that the formation of blue compound (D) and the pathway of its decomposition (H) are both strongly affected by the pH of the reaction mixture. Production of the blue compound increases as the pH is decreased over the range of 8.5 to 6.5. Although relatively little blue compound is formed at pH 8.0–8.5, its decomposition at these higher pHs is almost entirely due to oxidation; there is little or no purple compound formed. The fraction that is converted to purple complex increases dramatically as the pH is decreased from 8.0 to 6.5 (Fig. 6H). When the fixed concentrations of reactants are different from those used in the experiments summarized in Fig. 6, the results obtained may be quantitatively different, but the responses to increasing concentrations of a given reactant are qualitatively similar.
Variations in the i.p. Wavelength.
In the course of these investigations, it was observed that, under some conditions, the time-dependent conversion of the blue to the purple complex is associated with the presence of an i.p. at 600–603 nm. This observation was initially interpreted to indicate that the blue compound is quantitatively converted to the purple compound. However, it was subsequently noted that, under some experimental conditions, the i.p. was shifted to lower wavelengths (598 to 573 nm). A shift in i.p. could occur if variations in the experimental conditions caused changes in the extinction coefficient of either the blue or purple complexes. We found that the_E_mM of the purple complex is not altered by variations in any of the experimental conditions used in this study, but a change in the _E_mM of the blue complex with variations in experimental conditions could not be ruled out. However, if the observed shifts in the i.p. were due only to an increase in the _E_m of the blue complex, it would not account for the fact that the yield of purple complex is influenced by the availability of oxygen or the fact that under some conditions decomposition of the blue compound is not associated with a stoichiometric amount of purple complex.
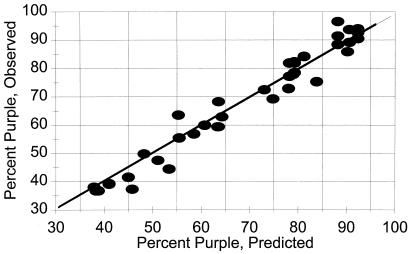
Because the blue complex can undergo decomposition by two very different pathways—namely, oxidation to yield Fe(III) and unidentified colorless products or conversion to the purple complex, it seemed possible that differences in the i.p. observed under various experimental conditions might reflect differences in the proportion of blue compound that is oxidized compared with that converted to the purple complex. To examine this hypothesis, simulations were carried out based on the assumption that, during its time-dependent decomposition, a constant fraction of the blue compound is converted to the purple product. These simulations revealed that the wavelength of the i.p. will decrease from 602 to 574 nm as the assumed fraction of purple product decreases from 100% to 38.4%. Evidence that this model can account for the i.p. shifts observed in our studies is supported by the data in Fig. 7 showing that, for any experimental condition in which an i.p. is observed, the fraction of purple product that is formed (as calculated directly from the changes in absorbance at 700 and 562 nm by using Eqs. 1 and2 in Experimental Procedures) are in good agreement with the values that are predicted for the observed i.p. based on the simulation studies. The data summarized in Fig. 7 are from experiments in which the pH, oxygen availability, and ratios of histidine, Fz, and Fe(II) were varied over a wide range, yielding i.p. values from 574 to 601 nm.
Figure 7.
Shifts in i.p. reflect fractional conversion of blue to purple compound. Data are from various experiments in which the i.p. was shown to vary from 603 to 573 nm. Observed values represent the fraction of blue compound converted to the purple compound as calculated from spectral changes by using Eqs. 1 and 2. Predicted values represent the values deduced from simulation studies showing that the i.p. may reflect the fraction of blue to purple conversion.
Discussion
We took advantage of the observation that Fe(II) reacts rapidly with amino acids and the iron chelator Fz to form a ternary blue complex (ɛmax at 630 nm) that undergoes spontaneous decomposition by oxygen-dependent or oxygen-independent pathways, leading to formation of Fe(III) and colorless products or to dissociation of the amino acid and formation of the well-known Fz3Fe(II) purple complex (ɛmax at 562 nm), respectively. Most, if not all, amino acids are able to form the blue complex. Of 10 different amino acids examined, including the aromatic, hydrophobic, and dicarboxylic amino acids, all but proline reacted almost instantaneously to form a blue complex (Table 2). No blue complex was formed with the dipeptide glycylglycine or with any of several_N-_acetyl amino acid derivatives, except_N-_acetylhistidine, indicating that a free α-amino carboxylic acid structure or an imidazole nitrogen atom is important for blue compound formation. Histidine was selected for more extensive studies because its blue complex was by far the most stable to decomposition. The yield of blue compound formation is a complex function of pH and the relative concentrations of amino acid, Fz, and Fe(II) (Fig. 6). At high (millimolar) concentrations of histidine, the yield of blue complex is proportional to the Fz concentration and is limited only by the amount of Fe(II) present (not shown). The blue compound contains only one mole of Fe(II) per mole of complex. In contrast, at micromolar concentrations of Fe(II) and Fz, the amount of blue compound decreases with increasing concentration of histidine, suggesting that the formation of a colorless histidine–Fe(II)-containing complex may compete with formation of the blue complex. At fixed concentrations of all three reactants, the amount of blue compound formed increases almost linearly as the pH is decreased from 8.5 to 6.5. No blue compound was formed when Fe(III) was substituted for Fe(II); however addition of Fe(III) did lead to a detectable decrease in the amount of blue compound formed in the presence of Fe(II) (not shown).
Immediately after its initial formation, the blue complex undergoes a time-dependent decomposition by either or both of two different pathways. Depending upon the experimental conditions, the amino acid may dissociate from the blue complex, converting it to the stable Fz3Fe(II) purple complex, and/or it may also undergo oxygen-dependent oxidation to form Fe(III) by an undefined mechanism. High concentrations of histidine and high pH values favor decomposition by the oxidation pathway, whereas high Fz concentrations favor the blue to purple pathway.
The antioxidant potential of this class of ternary amino acid–Fe(II)–chelate complexes is evident from the fact that the blue complexes, but not the purple complexes, are almost instantaneously oxidized by H2O2 to form Fe(III) and other colorless products. The blue complex is also oxidized by O2 but by a different mechanism that does not involve H2O2, as indicated by the fact that catalase prevents oxidation by H2O2 but not by O2.
Unpublished results from Job-plot and mass spectral analyses by M.C., H. Fales, and P.B.C. provide evidence that Fe(II), Fz, and histidine interact to form complexes with compositions: Fe(II)Fz3, Fe(II)FzHis, FeFz2His, and FeFz2His2. The first of these is definitely the purple complex, but whether one or both of the latter two complexes represent(s) the blue complex remains to be established.
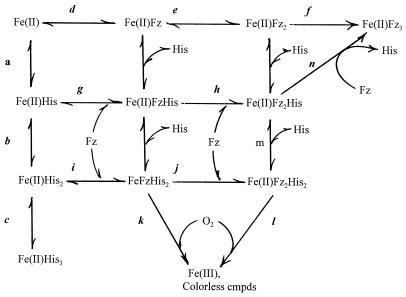
Overall, the results presented here are consistent with the reaction pathways illustrated in Scheme S1, in which Fe(II) interacts with an amino acid (histidine) to form colorless complexes containing 1 to 3 equivalents of histidine (reactions a, b, and c) or with Fz to form the stable purple complex of the composition Fe(II)Fz3 (reactions d, e, and f) with the spectrum shown in Fig.3A. However, in the presence of histidine at the high concentrations used in the present experiments, only negligible amounts of purple compound would be formed by the latter pathway. Instead, Fz would more likely react with the Fe(II)His and Fe(II)His2 complexes (reactions g and_i_) to form the Fe(II)FzHis and Fe(II)FzHis2 derivatives, which upon further reaction with Fz (reactions h and j) would yield complexes of the composition Fe(II)Fz2His and Fe(II)Fz2His2. Any one of the Fe(II) complexes containing both Fz and histidine could be the blue compound. However, at high histidine concentrations the blue compound is more stable and is not converted to the purple compound, so that it is more likely to contain a higher equivalent of histidine. Therefore, we propose that Fe(II)FzHis2 and/or Fe(II)Fz2His2 represent(s) the blue complex having the spectrum illustrated in Fig. 2 F–H and Fig. 3C. Although it is not converted to the purple compound at high histidine concentrations, the blue compound is oxidized by O2 to form Fe(III) and colorless products (reactions k and l). A complex of the composition Fe(II)Fz2His2 was in fact detected among the products identified by mass spectral analysis by M.C., H. Fales, and P.B.C. (unpublished work), whereas no complex of the structure Fe(II)FzHis2 was detected. This does not preclude its role as an intermediate, since failure to detect could be due to its rapid conversion to the Fe(II)Fz2His2 or to being so sensitive to oxidation that its steady-state concentration is below the limit of detection. The fact that small amounts of Fe(II)Fz2His2 were detected by mass spectrometry is somewhat surprising in view of the fact that histidine probably forms a bidentate complex with Fe(II). Nevertheless, data presented in Fig. 6 are readily explained by the reactions shown in Scheme I. The observations that the yield of blue compound decreases with increasing histidine concentrations (Fig. 6A) or with changes in pH that favor the interaction of histidine with Fe(II) (Fig. 6D) are consistent with the fact that these conditions favor formation of the Fe(II)–His complexes (reactions a, b, and c, Scheme I) and thus compete with reactions_d, g,_ and i, which lead to formation of the purple and blue complexes. Consequently, high concentrations of histidine will favor lower [Fe(II)FzHis]/[FeFzHis2] (or Fe(II)Fz2His2) ratios and hence (as shown in Fig. 6 E and H) will favor formation of the blue compound (reactions i and/or_j_) and its preferential oxidation by O2 to Fe(III) and colorless products (reactions_k_ and l) rather than its conversion to the purple compound by reactions d, e, and f or by reactions_j, m,_ and n. To the contrary, it follows from Scheme I that, when the concentration of histidine is held constant, an increase in the concentration of Fz will lead to an increase in the level of blue compound produced (Fig. 6B) and in the [Fe(II)Fz2His]/[Fe(II)Fz2His2] ratio. Consequently, one might expect that, with increasing concentration of Fz, the fraction of blue compound that is converted to the purple compound would increase and that the fraction that is oxidized to colorless products would decrease (cf. Fig.6F). It also follows from Scheme I that, at fixed concentrations of histidine and Fz, increasing the concentration of Fe(II) should lead to an increase in the amount of blue compound formed, but should have little, if any, effect on the [Fe(II)Fz2His]/[FeFzHis2] ratio and therefore would not alter the percentage of blue that is converted to purple and colorless products (Fig. 6 C and_G_).
Scheme 1.
In the course of these studies, it was noted that the time-dependent conversion of the blue to the purple compound is associated with the appearance of an i.p., a phenomenon that is commonly assumed to reflect the quantitative conversion of one compound to another. However, in this case, it was observed that the wavelength of the i.p. shifted from 602 to 574 nm with changes in the experimental conditions. On the basis of results of simulation studies, it was established that the shifts in i.p. could reflect differences in the contributions of the two pathways of blue compound decomposition. It was confirmed that this is the case and further established that the shift in i.p. can actually be used to calculate the fractions of blue compound that are decomposed by each of the two pathways. Thus, for any given experimental condition, the proportion of blue compound that was converted to the purple compound, as calculated from changes in the spectrum, was found to be in excellent agreement with that deduced from the location (wavelength) at the i.p. Generalizing, these studies demonstrate that for reactions that can be followed spectrally, and in which a given precursor compound is converted to different products by two different pathways, a shift in the i.p. point may serve as a useful measure of the relative amounts of products formed by the two pathways.
Since Fz is not present in biological systems, the results summarized here are of no direct physiological significance. However, results of these and previous (1–6) studies highlight the possibility that ternary complexes between redox-active metals, amino acids, and metal chelators could serve as antioxidant systems. The search for physiological chelating agents that can mimic the effects of Fz might therefore be rewarding.
Abbreviations
Fz
Ferrozine [3-(2-pyridyl)-5,6-diphenyl-1,2,4-triazine-_p,p_′-disulfonic acid]
i.p.
isosbestic point
SOD
superoxide dismutase
Footnotes
Article published online before print: Proc. Natl. Acad. Sci. USA, 10.1073/pnas.021552298.
Article and publication date are at www.pnas.org/cgi/doi/10.1073/pnas.021552298
References
- 1.Stadtman E R, Berlett B S. J Biol Chem. 1991;266:17201–17211. [PubMed] [Google Scholar]
- 2.Berlett B S, Chock P B, Yim M B, Stadtman E R. Proc Natl Acad Sci USA. 1990;87:389–393. doi: 10.1073/pnas.87.1.389. [DOI] [PMC free article] [PubMed] [Google Scholar]
- 3.Stadtman E R, Berlett B S, Chock P B. Proc Natl Acad Sci USA. 1990;87:384–388. doi: 10.1073/pnas.87.1.384. [DOI] [PMC free article] [PubMed] [Google Scholar]
- 4.Yim M B, Berlett B S, Chock P B, Stadtman E R. Proc Natl Acad Sci USA. 1990;87:394–398. doi: 10.1073/pnas.87.1.394. [DOI] [PMC free article] [PubMed] [Google Scholar]
- 5.Varani J, Ginsburg I, Gibbs D F, Mukhopadhyay P S, Sulavaik C, Johnson K J, Weinberg J M, Ryan U S, Ward P A. Immunology. 1991;15:291–301. doi: 10.1007/BF00917314. [DOI] [PubMed] [Google Scholar]
- 6.Stadtman E R, Berlett B S. In: Oxygen Radicals in Biology and Medicine. Simic M G, Taylor K A, Ward J F, von Sonntag C, editors. New York: Plenum; 1989. pp. 131–136. [Google Scholar]
- 7.Stooky L. Anal Chem. 1970;42:779–784. [Google Scholar]
- 8.Carter P. Anal Biochem. 1971;40:450–458. doi: 10.1016/0003-2697(71)90405-2. [DOI] [PubMed] [Google Scholar]
- 9.Gibbs C R. Anal Biochem. 1976;48:1197–1201. [Google Scholar]
