Metabolic alkalosis reduces exercise-induced acidosis and potassium accumulation in human skeletal muscle interstitium (original) (raw)
Abstract
Skeletal muscle releases potassium during activity. Interstitial potassium accumulation is important for muscle function and the development of fatigue resulting from exercise. In the present study we used sodium citrate ingestion as a tool to investigate the relationship between interstitial H+ concentration and K+ accumulation during exercise. Seven healthy subjects performed one-legged knee-extensor exercise on two separate days with and without sodium citrate ingestion. Interstitial H+ and K+ concentrations were measured with the microdialysis technique. Citrate ingestion reduced the plasma H+ concentration and increased the plasma HCO3− concentration. Citrate had no effect on interstitial H+ at rest. The increase in interstitial H+ concentration during intense exercise was significantly lower (P < 0.05) with citrate ingestion compared to control (peak interstitial H+ concentration 79 versus 131 nm). After 3 min of exercise interstitial K+ concentration was reduced (P < 0.05) in the citrate (alkalosis) compared to the control experiment (8.0 ± 0.9 versus 11.0 ± 2 mm) and interstitial K+ concentration remained lower during the rest of the exercise period. The present study demonstrated a link between interstitial H+ and K+ accumulation, which may be through the ATP-sensitive K+ channels (KATP channels), which are sensitive to changes in H+.
Skeletal muscle releases K+ during activity; during high-intensity exercise venous plasma K+ concentration may reach approximately 7 mm (Juel et al. 1990). The accumulation of K+ in the interstitium may have important physiological effects. For example, K+ accumulation reduces muscle excitability (Clausen, 2003) and is considered to be involved in both the development of muscle fatigue and blood flow regulation (Kjellmer, 1965; Fitts, 1994). The activity-induced efflux of K+ is due to the opening of voltage-dependent K+ channels (Kv channels), which are activated during the action potential. However, other K+ channels such as the ATP- (and pH-) sensitive K+ channels (KATP channels) may also contribute to K+ efflux (Nielsen et al. 2003). The release of K+ is counterbalanced by the activity of the Na+–K+ pump (Clausen, 2003), and the Na+–K+–Cl− cotransporter (NKCC) may also be involved (Lindinger et al. 2002). The capacity for K+ re-uptake is exceeded during muscle activity and consequently K+ accumulates in the interstitium (Clausen, 2003). The K+ transporting pumps, channels and transporters are therefore of great importance for the interstitial K+ accumulation.
Muscle activity is also associated with an increase in both intracellular and extracellular H+ concentration (Street et al. 2001). It is not known whether H+ influences the K+ balance. However, it can be hypothesized from the fact that the KATP channels are H+ sensitive that changes in intracellular and interstitial H+ concentrations during muscle activity are of importance for K+ homeostasis. The role of interstitial H+ is not well understood because of the difficulties in quantifying the muscle interstitial H+ concentration both at rest and during exercise. Recently, we have combined the use of fluorometry and the microdialysis technique to rectify this problem (Street et al. 2001).
At rest, the ingestion of sodium citrate has been shown to reduce plasma H+ concentration without a concurrent effect on intracellular H+ concentration (Linossier et al. 1997) and to improve performance (Greenleaf et al. 1997; Shave et al. 2001; Oopik et al. 2003). Sodium citrate ingestion increases venous lactate concentration, which has been associated with an enhanced transport of lactate from the muscle cell, across the interstitium and into the venous circulation (Lindinger et al. 1990). As the movement of lactate ions is followed stoichiometrically by H+ ions (Juel & Halestrap, 1999), it follows that a similar increase in acid efflux should be detectable in the venous circulation with sodium citrate ingestion. However, this phenomenon has not been observed. The lack of large changes in blood H+ level is probably a result of the higher blood buffering capacity due to a high HCO3− concentration associated with sodium citrate ingestion. Intracellular buffer capacity is unaltered by alkali ingestion and therefore has no influence on intracellular H+ concentration (Nielsen et al. 2002). It is unknown what effect sodium citrate ingestion has on interstitial H+ concentration at rest and during exercise. In light of the possibility that lactate and H+ transport from the muscle cell may be H+ dependent (Lindinger et al. 1990), alterations in interstitial H+ concentration have the potential to improve ionic transport. A higher activity of the involved transport mechanisms may help to explain the observations of increased venous lactate levels during exercise.
Therefore, the aim of the present study was to use citrate ingestion as a tool to change plasma H+ and probably also interstitial H+ concentration at rest and during intense exercise. As some K+ channels are H+ sensitive, it was hypothesized that changes in plasma and interstitial H+ concentration influence interstitial K+ accumulation during exercise, which could have an effect on muscle performance.
Methods
Subjects
Seven male subjects with a mean age of 31 ± 4 years participated in this study. All subjects were active with no health-related problems. Mean height, body mass and body mass index (BMI) was 180.8 ± 5.4 cm, 81.7 ± 4.1 kg and 25.0 ± 3.1 kg m-2, respectively. Prior to any testing each subject was informed of the risks and discomforts of the experiment and signed a written consent form. The experiment was carried out in accordance with the Declaration of Helsinki and approved by a local ethics committee.
Assessment of experimental exercise intensity
The subjects performed one-legged knee extension exercise with the left leg as previously described (Andersen et al. 1985) in a supine position and were secured via a series of two shoulder, one waist and one thigh strap, so as to isolate the quadriceps muscle for the exercise. Visual feedback in the form of a digital display showed the subjects their cadence at all times. Subjects were required to maintain a cadence of 60 r.p.m. In order to determine the workload to be used in the main experiment the subjects performed an incremental test. The initial workload was 30 W and was increased by 10 W every 3 min. The test was stopped and time recorded when the subject was unable to maintain the desired cadence for a period of 15 s. Verbal encouragement was given to each subject at the higher intensities. The resistance at the last incomplete stage was used to establish the resistance for the constant load test (main experiment).
Main experiment
The main experiments consisted of two trials separated by 1–2 weeks: one day with ingestion of sodium citrate (300 mg (kg body weight)−1) (CIT) and another day with ingestion of placebo (PLA). Each experiment consisted of a 2.5-h ingestion period and a constant-load exercise test to exhaustion. Exhaustion for this test was defined as a drop in cadence from 60 r.p.m and the inability to return to it within 15 s. Blood and microdialysis samples were obtained every 30 min during the ingestion period, at 0.5, 3, 5 and 6 min (if possible) during exercise and at exhaustion. In the recovery period samples were obtained at 1, 2, 3, 4, 5, 6, 9 and 12 min after exhaustion.
Blood analysis
Duplicate venous blood samples taken from the forearm were immediately analysed for _P_CO2, pH and HCO3− levels using a Radiometer ABL510 analyser (Copenhagen, Denmark).
Perfusate preparation
The perfusate contained freeze-dried pH-sensitive dye 2′,7′-bis(carboxyethyl)-5-carboxyfluorescein (BCECF) (0.1 mg ml−1) coupled to dextran (molecular weight, 70 000) dissolved in a sterile saline (9 g l−1 NaCl) containing 25 mm HCO3−. The perfusate was then placed into a sterile 1-ml syringe mounted with a 0.2 μm filter. The syringe and filter were connected to a CMA microdialysis pump (Solma, Sweden) set at a rate of 5 μl min−1.
Microdialysis probes
Two types of probes were used: CMA 60 (Solna, Sweden) and home-made probes. The CMA 60 has a molecular mass cut-off of 20 kDa. The semi-permeable fibres used to construct the home-made microdialysis probes for measurements of K+ concentration had a cut-off and inner/outer diameter of 5 kDa and 0.20/0.22 mm (Gambro AB, Lund, Sweden), respectively. The probe was made by gluing each end of a fibre to a 6–0 suture. The fibre and suture were then inserted and glued to an 11-cm inlet and 6-cm outlet nylon tube (0.50 mm inner diameter and 0.63 mm outer diameter) (Portex SIMS, Kent, UK) exposing 4 cm of the membrane.
Probe insertion
Prior to the insertion of the microdialysis probes, the skin, subcutaneous tissue and fascia close to both the insertion and exit points were anaesthetized with lidocaine (lidocaine) (20 mg ml−1). Using a 17G/45 mm Venflon IV, four microdialysis probes (two home-made and two CMA 60) were inserted into the vastus lateralis muscle of the left leg. The directions of the microdialysis probes were aligned with the muscle fibre direction. The probes were perfused using a microdialysis pump (CMA 102, CMA Microdialysis, Sweden) for approximately 1 h after insertion at a rate of 5 μl min−1 before the experiments started. The perfusate was an isotonic Ringer acetate solution (Pharmacia, Stockholm Sweden) in which 3 mm glucose and 1 mm lactate were dissolved as well as [201Tl]thallous chloride injection (Nycomed, Amersham, Buckinghamshire, UK) resulting in an activity of < 7000 Bq ml−1. Collection tubes were weighed before and after sampling, to determine the actual flow rate. Samples were taken at 75-s intervals, starting at the beginning of exercise and recovery, respectively, taking into account the time delay in the outlet tube. Only probes with a calculated continued perfusion rate in the range of 4.5–5.5 μl min−1 were used. Samples were immediately frozen at −80°C until the analyses were performed.
K+ and Na+ analysis
Dialysate sample (5 μl) was transferred to a tube containing 1 ml distilled H2O with 3 mm lithium chloride, counted on a Packard autogamma counter and then stored at −20°C. Microdialysis and venous pslasma samples were analysed for K+ and Na+ concentration on a flame photometer (FLM3, Radiometer, Denmark), running CIT and PLA trials for each subject on the same day. The K+ concentration in the perfusate was also measured.
Calculation of interstitial K+ concentration
The relative loss (RL) of 201Tl was calculated as RLTl = perfusate activity – perfusate activity/dialysate activity. The interstitial K+ concentration ([K+]0) was calculated from the dialysate samples assuming that fractional loss of 201Tl from the perfusate equals fractional gain of K+ in the perfusate (Juel et al. 2000):

Fluorometry and measurement of H+ concentration
The method used has been previously described (Street et al. 2001). After insertion of the probe (CMA 60) into the vastus lateralis muscle, the probe was secured with tape and the outlet cut at a maximal length of 10 mm from the skin. A stainless steel tube was connected to the outlet, by inserting into the internal diameter of the CMA outlet, which then continued directly into a glass microflow through a cuvette (volume, 8 μl) within a fluorometer (Hitachi F-2000, Japan).
With the emission wavelength constant at 530 nm, the fluorescence spectrophotometer switched every second between the excitation wavelengths of 440 and 500 nm with a bandpass of 10 nm. The excitation intensity at 440 nm was insensitive to pH but dependent on the dye concentration. However, the excitation intensity at 500 nm was sensitive to pH. Thus, the excitation intensity ratio 500/440 nm was proportional to pH while being independent of changes in dye concentration and insensitive to any water movements to or from the probe. The temperature in the fluorescence spectrophotometer was kept constant by circulating thermostatically controlled water (37°C).
For calibration, a microdialysis probe was placed in a beaker with magnetic stirring and connected to a pump (CMA 102) and the fluorometer. The beaker contained saline and bicarbonate in which pH was monitored using a laboratory pH meter (Radiometer, Denmark). The H+ concentration in the beaker was changed in a stepwise manner by adding HCl/NaOH (5 m) and the excitation ratio recorded. A calibration curve was obtained by plotting the excitation intensity ratio versus external pH. The parameters obtained from a linear regression to the calibration curve were used to convert fluorescence signals obtained in human experiments to interstitial pH. The sampling frequency used was 10 Hz. The time scales were corrected for the delay due to the volume of the tubing and cuvette. The time-corrected raw data were then converted to interstitial pH values from which average minute values were determined.
Statistics
Values presented are mean ± s.e.m. To identify differences between conditions data were analysed using a two-way repeated measures analysis of variance test. The level of significance was set at 0.05 and if achieved the data were then subjected to a Tukey's test for post hoc analysis. Performance with and without citrate was compared using paired t test.
Results
Exercise duration
The mean exercise duration was 418 ± 57 and 356 ± 23 s in CIT and PLA, respectively. The difference did not reach significance (_P_= 0.1), although six out of seven subjects performed better after citrate ingestion.
Venous plasma [HCO3−], [H+] and [K+]
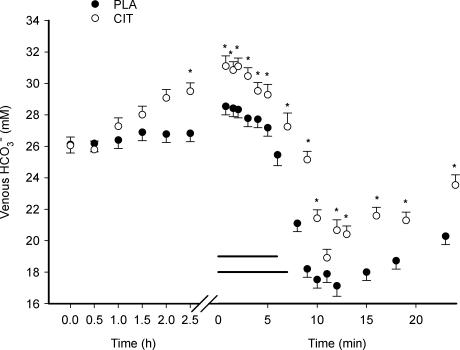
The ingestion of sodium citrate increased (P < 0.05) venous [HCO3−] from 26.1 ± 0.4 to 29.8 ± 0.5 mm during the infusion period (Fig. 1). Once elevated, this increase of approximately 15% persisted throughout the remaining experiment. Intense exercise was associated with a decrease (P < 0.05) in venous [HCO3−] under both treatments. Although the magnitude of decrease was similar (39 and 38% for CIT and PLA, respectively), time to the exercise-induced nadir was greater (P < 0.05) in the alkaline condition (10.5 ± 0.4 min) compared to the placebo (9.4 ± 0.5 min). The 15-min recovery period was not of sufficient length to restore [HCO3−] to resting values in either condition (P < 0.05).
Figure 1. Venous [HCO3−] during ingestion, exercise and recovery from exercise with (CIT) and without (PLA) citrate ingestion.
The _x_-axis is broken into two segments: ingestion (ingestion at time 0, time axis in hours) and exercise/recovery (time axis in minutes). The last value during exercise represents the mean value at exhaustion. The two horizontal lines represent the exercise period (which differ in CIT and PLA due to differences in endurance), consequently the last value in exercise (value at exhaustion) has a different time-value in CIT and PLA. The time axis in recovery from exercise is not corrected for the different exercise durations. *Significant difference between CIT and PLA values. The values represent mean ± s.e.m. (n = 7).
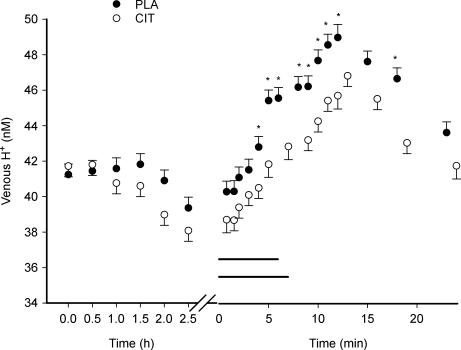
After 4 min of exercise the venous [H+] was lower (P < 0.05) in CIT than in the PLA. This difference remained throughout the rest of the exercise period and for 10 min into recovery (P < 0.05) with the exception of 5 and 7.5 min of recovery (Fig. 2). The amplitudes of changes in [H+] (approximately 10 nm) during exercise were similar in CIT compared to PLA.
Figure 2. Venous H+ concentration during ingestion, exercise and recovery from exercise.
The _x_-axis is broken into two segments: ingestion (ingestion at time 0, time axis in hours) and exercise/recovery (time axis in minutes). The last value during exercise represents the mean value at exhaustion. The horizontal lines represent the exercise period in CIT and PLA. *Significant difference between CIT and PLA values. The values represent mean ± s.e.m. (n = 7).
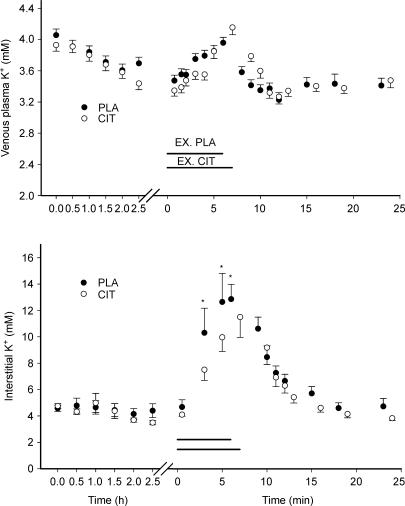
Venous plasma [K+] during infusion, exercise and recovery was not different in CIT compared to PLA (see Fig. 4).
Figure 4. Venous plasma (upper graph) and interstitial (lower graph) K+ concentrations during ingestion, intense exercise and recovery from exercise in placebo (PLA) and citrate ingestion (CIT) experiments.
Note different x-axes. The horizontal lines represent the exercise period for control (EX. PLA) and citrate experiments (EX.CIT). *Significant difference between CIT and PLA values.
Interstitial [H+] and [K+]
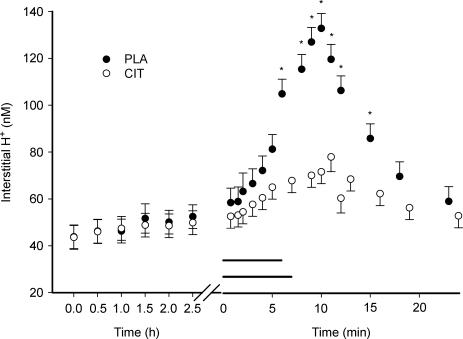
Interstitial [H+] ([H+]o) did not change during the ingestion period. [H+]o was lower (P < 0.05) in CIT (68 ± 5 nm) compared to PLA (105 ± 6 nm) at the end of exercise. Consequently, a smaller interstitial to venous plasma H+ concentration gradient was obtained in CIT compared to PLA. A difference in [H+]o was observed until 7.5 min into the recovery period (P < 0.05) (Fig. 3).
Figure 3. Interstitial H+ concentration during ingestion, exercise and recovery from exercise.
The horizontal lines represent the exercise period in CIT and PLA. *Significant difference between CIT and PLA values. The values represent mean ± s.e.m. (n = 7).
[K+]o at rest was the same in CIT and PLA. During intense exercise interstitial [K+]o was lower (P < 0.05) in CIT than in PLA after 3 min (8.0 versus 11.0 mm) and 5 min (10.7 versus 13.5 mm) of exercise (Fig. 4). Also, at exhaustion [K+]o was lower (P < 0.05) in CIT compared to PLA (12.2 ± 1.6 versus 13.7 ± 2.3 mm).
Interstitial and venous plasma [Na+]
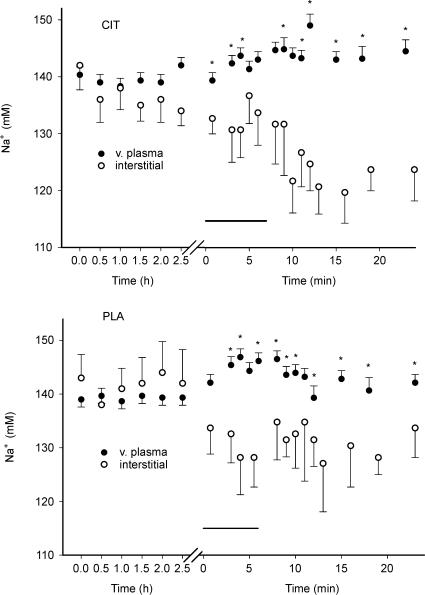
Interstitial [Na+] ([Na+]o) was not different in CIT compared to PLA (however, the mean [Na+]o was lower in CIT compared to PLA if the recovery period was tested separately). Venous plasma and [Na+]o was similar during the ingestion period. During exercise [Na+]o was lower (P < 0.05) than venous plasma [Na+] both for CIT and PLA, and the difference remained during the recovery from exercise both in CIT and PLA (Fig. 5).
Figure 5. Venous plasma and interstitial Na+ concentrations during ingestion, intense exercise and recovery from exercise in CIT and PLA.
The horizontal lines represent the exercise periods. *Significantly different venous plasma and interstitial Na+ concentrations.
Discussion
The results of the present study demonstrated that citrate-induced alkalosis reduces the amplitude of the exercise-induced increase in interstitial H+ concentration. The reduction in interstitial acidification was associated with a lower exercise-induced accumulation of interstitial K+.
Interstitial [H+]
We found no difference in the amplitude of the exercise-induced change of H+ concentration in CIT compared to PLA (Fig. 2). Furthermore, the amplitudes of the changes in venous plasma HCO3− concentration during exercise were similar for the two exercise series (Fig. 1). Although the blood buffer capacity is slightly changed with citrate ingestion, the data suggest that the total amount of acid released to the blood was similar between the two conditions. Therefore, a different release of acid from muscle does not seem to explain either the pronounced difference in [H+]o at exhaustion and in the first part of recovery nor the difference in the H+ gradient from interstitium to plasma. This citrate-induced reduction of the interstitial acidosis associated with intense exercise (Fig. 3), is probably due to several mechanisms. Firstly, the venous HCO3− concentration after citrate ingestion was approximately 4 mm or 15% higher. Assuming HCO3− equilibrates between the capillary and interstitial space, this increase in blood buffer capacity probably resulted in an increase in the buffering capacity of the interstitial compartment. As there is less soluble protein (albumin) in the interstitium than in blood plasma, HCO3− will make up a larger fraction of the buffer capacity in the interstitium than in plasma. Therefore, a given amount of acid will affect the interstitium to a greater extent than the plasma, and the additional buffering capacity with a high HCO3− concentration (as with CIT) will have a greater effect in the interstitium. This mechanism can probably explain a part of the difference in interstitial acidification with and without citrate ingestion.
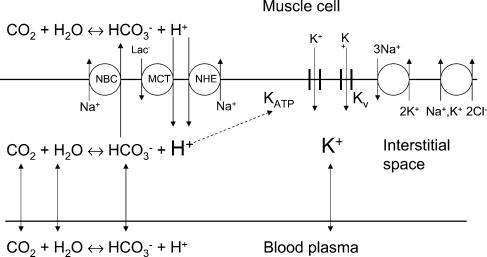
Secondly, changes in membrane transport mechanisms may be involved. It has been repeatedly shown that oral alkali ingestion does not influence intracellular [H+] at rest (Costill et al. 1984; Hollidge-Horvat et al. 2000; Nielsen et al. 2002; Bishop et al. 2004). On the other hand, it is well documented that alkali ingestion decreases venous [H+] at rest (Kowalchuk et al. 1989; Hausswirth et al. 1995; Schabort et al. 2000; Raymer et al. 2004). A lower venous [H+] with CIT was also seen during exercise (Fig. 2). Therefore, with a constant intracellular [H+] and a lower venous [H+] a larger muscle to plasma H+ concentration gradient was created in the citrate experiments. An increased H+ concentration gradient probably increased the activity of the transport systems involved in H+ regulation (Fig. 6): Na+–H+ exchange (NHE), Na+–HCO3− cotransport (NBC) and the lactate–H+ transporters MCT1 and MCT4 (Juel, 1998). In addition, it has been demonstrated in a rat model that an increase in [HCO3−] directly increased the activity of the Na+–HCO3− cotransporter (Kristensen et al. 2004). Together, these mechanisms will increase the efficiency of H+ transport from muscle to plasma and thereby explain some of the observed reduction in interstitial acidification at exhaustion in the citrate experiments.
Figure 6. Interstitial H+ and K+ concentrations.
The figure illustrates the ion movements between the three compartments: muscle cell, interstitial space and blood plasma. The interstitial [H+] is determined by the CO2–HCO3− system and transport systems in the sarcolemma: Na+–HCO3− cotransport (NBC), Na+–H+ exchange (NHE) and the lactate–H+ cotransport (MCT). The potassium balance is influenced by the NKCC cotransporter, the Na+–K+ pump, and the K+ channels Kv and KATP. The dashed arrow represents the suggested interaction between interstitial [H+] and the K+ channel (KATP). The capillary wall probably also contains a number of transport systems, but these have been omitted.
Interstitial Na+ changes
Interstitial [Na+] was significantly lower than venous plasma [Na+] during exercise and in the recovery period after exercise both in CIT and PLA (Fig. 5). This difference is most probably due to an exercise-induced movement of water from plasma to the interstitial space, which is generally observed in human exercise experiments (Sjøgaard et al. 1985). The possibility exists that water movements are also induced by sodium citrate, as interstitial [Na+] also tended to be reduced during the infusion period in the CIT experiment. The Na+ concentration gradients between plasma and interstitial space were not significantly different in CIT compared to PLA (although the gradient tended to be larger in CIT compared to PLA; Fig. 5). A difference in water movements could have contributed to the lower interstitial H+ and K+ concentrations in CIT compared to PLA during exercise. However, differences in water movements cannot explain the main part of the large and fast appearing difference in interstitial [K+] in CIT compared to PLA observed during the early part of exercise (Fig. 4). Likewise, the finding that the interstitial [H+] increase during exercise in CIT was only one-third of the increase in PLA, can only partly be explained by differences in water movements.
The lower [Na+]o compared to plasma both in CIT and PLA may partly be caused by another mechanism; a high activity of the Na+-dependent pH-regulating transport systems (Fig. 6), which induce Na+ transport from the interstitial space to the cell (see above), may contribute to the low [Na+]o.
Interstitial H+ and K+ concentrations
Alkalosis associated with citrate ingestion reduced the interstitial K+ accumulation during intense exercise (Fig. 4), although the exercise duration tended to be longer in CIT. In a previous study by Bangsbo et al. (1996) one-legged exercise with and without a preceding bout of intense arm exercise was used to investigate the effect of muscle acidity on K+ release and fatigue. Arm exercise resulted in a higher leg venous plasma lactate concentration before exercise, a higher leg muscle lactate concentration at exhaustion and a higher muscle [H+]. K+ release per time unit was higher with preceding arm exercise and endurance time was reduced. These observations suggest that K+ release and presumably also interstitial K+ accumulation is increased by raising [H+]. This connection is further supported by the present study in which a lower decrease in interstitial [H+] during exercise reduced the interstitial [K+]. However, the time scales for the increase in interstitial concentrations K+ and H+ are different: the increase in [H+] reached the highest level approximately 3 min into recovery, whereas [K+] was reduced immediately after exercise. The K+ recovery can be ascribed to the high capacity of the Na+–K+ pump, which starts to normalize interstitial K+ as soon as the contraction-induced release of K+ stops.
The link between interstitial H+ and K+ accumulation remains speculative. The activity of the Na+–K+ pump has not been reported to be H+ sensitive (Clausen, 2003) and the NKCC cotransporter is independent of external pH (Russell, 2000); the re-uptake of K+ mediated by these pathways is therefore not expected to be effected by moderate changes in [H+]. It is more likely that K+ release is influenced by interstitial [H+]. One candidate is the KATP channel, which is known to be less inhibited by ATP if cellular [H+] is increased (Spruce et al. 1985). The interstitial K+ concentration in resting human muscle is lowered by the KATP channel inhibitor glibenclamide, but inhibition of the channel at normal extracellular H+ failed to demonstrate an effect on interstitial [K+] during exercise (Nielsen et al. 2003). Thus, the study by Nielsen et al. (2003) confirms that KATP channels are involved in K+ regulation, although this was not evident during knee-extensor exercise at 60 W.
A lowering of interstitial [K+] during exercise has been suggested to be associated with an increased performance (Nielsen et al. 2004). In the present study we did not find an effect of alkalosis on performance although a trend was observed. In the study by Bangsbo et al. (1996), a correlation between [H+] and endurance was identified, and citrate ingestion has been reported to increase performance in other studies (Greenleaf et al. 1997; Shave et al. 2001; Oopik et al. 2003). It is therefore tempting to speculate about a possible link between [H+] and performance. The present findings suggest that interstitial [H+] influences the interstitial K+ accumulation during exercise; therefore, the coupling between [H+] and performance may be explained by changes in interstitial [K+].
In conclusion, interstitial K+ accumulation influences muscle performance. In the present study citrate ingestion reduced both plasma [H+] and the exercise-induced accumulation of interstitial H+. In addition, the interstitial K+ accumulation during muscle activity was reduced, suggesting that the interstitial K+ accumulation is influenced by [H+]. This connection between interstitial acidification and interstitial K+ may form a link between H+ accumulation and muscle performance.
Acknowledgments
The study was supported by Copenhagen Muscle Research Centre and The NOVO Nordisk Foundation.
References
- Andersen P, Adams RP, Sjogaard G, Thorboe A, Saltin B. Dynamic knee extension as model for study of isolated exercising muscle in humans. J Appl Physiol. 1985;59:1647–1653. doi: 10.1152/jappl.1985.59.5.1647. [DOI] [PubMed] [Google Scholar]
- Bangsbo J, Madsen K, Kiens B, Richter EA. Effect of muscle acidity on muscle metabolism and fatigue during intense exercise in man. J Physiol. 1996;495:587–596. doi: 10.1113/jphysiol.1996.sp021618. [DOI] [PMC free article] [PubMed] [Google Scholar]
- Bishop D, Edge J, Davis C, Goodman C. Induced metabolic alkalosis affects muscle metabolism and repeated-sprint ability. Med Sci Sports Exerc. 2004;36:807–813. doi: 10.1249/01.mss.0000126392.20025.17. [DOI] [PubMed] [Google Scholar]
- Clausen T. Na+K+ pump regulation in skeletal muscle contractility. Physiol Rev. 2003;83:1269–1324. doi: 10.1152/physrev.00011.2003. [DOI] [PubMed] [Google Scholar]
- Costill DL, Verstappen F, Kuipers H, Janssen E, Fink W. Acid-base balance during repeated bouts of exercise: influence of HCO3. Int J Sports Med. 1984;5:228–231. doi: 10.1055/s-2008-1025910. [DOI] [PubMed] [Google Scholar]
- Fitts RH. Cellular mechanisms of muscle fatigue. Physiol Rev. 1994;74:49–94. doi: 10.1152/physrev.1994.74.1.49. [DOI] [PubMed] [Google Scholar]
- Greenleaf JE, Looft-Wilson R, Wisherd JL, McKenzie MA, Jensen CD, Whittam JH. Pre-exercise hypervolemia and cycle ergometer endurance in men. Biol Sport. 1997;14:103–114. [PubMed] [Google Scholar]
- Hausswirth C, Bigard AX, Lepers R, Berthelot M, Guezennec CY. Sodium citrate ingestion and muscle performance in acute hypobaric hypoxia. Eur J Appl Physiol Occup Physiol. 1995;71:362–368. doi: 10.1007/BF00240418. [DOI] [PubMed] [Google Scholar]
- Hollidge-Horvat MG, Parolin ML, Wong D, Jones NL, Heigenhauser GJ. Effect of induced metabolic alkalosis on human skeletal muscle metabolism during exercise. Am J Physiol Endocrinol Metab. 2000;278:E316–E329. doi: 10.1152/ajpendo.2000.278.2.E316. [DOI] [PubMed] [Google Scholar]
- Juel C. Muscle pH regulation: role of training. Acta Physiol Scand. 1998;162:359–366. doi: 10.1046/j.1365-201X.1998.0305f.x. [DOI] [PubMed] [Google Scholar]
- Juel C. Skeletal muscle Na+/H+ exchange in rats: pH dependency and the effect of training. Acta Physiol Scand. 1998;164:135–140. doi: 10.1046/j.1365-201X.1998.00417.x. [DOI] [PubMed] [Google Scholar]
- Juel C, Bangsbo J, Graham T, Saltin B. Lactate and potassium fluxes from human skeletal muscle during and after intense, dynamic, knee extensor exercise. Acta Physiol Scand. 1990;140:147–159. doi: 10.1111/j.1748-1716.1990.tb08986.x. [DOI] [PubMed] [Google Scholar]
- Juel C, Halestrap AP. Lactate transport in skeletal muscle – role and regulation of the monicarboxylate transporter. J Physiol. 1999;517:633–642. doi: 10.1111/j.1469-7793.1999.0633s.x. [DOI] [PMC free article] [PubMed] [Google Scholar]
- Juel C, Pilegaard H, Nielsen JJ, Bangsbo J. Interstitial K(+) in human skeletal muscle during and after dynamic graded exercise determined by microdialysis. Am J Physiol Regul Integr Comp Physiol. 2000;278:R400–6. doi: 10.1152/ajpregu.2000.278.2.R400. [DOI] [PubMed] [Google Scholar]
- Kjellmer I. The potassium ion as a vasodilator during muscular exercise. Acta Physiol Scand. 1965;63:460–468. doi: 10.1111/j.1748-1716.1965.tb04089.x. [DOI] [PubMed] [Google Scholar]
- Kowalchuk JM, Maltais SA, Yamaji K, Hughson RL. The effect of citrate loading on exercise performance, acid-base balance and metabolism. Eur J Appl Physiol Occup Physiol. 1989;58:858–864. doi: 10.1007/BF02332219. [DOI] [PubMed] [Google Scholar]
- Kristensen JM, Kristensen M, Juel C. Expression of Na+/HCO3− co-transport proteins (NBCs) in rat and human skeletal muscle. Acta Physiol Scand. 2004;182:69–76. doi: 10.1111/j.1365-201X.2004.01297.x. [DOI] [PubMed] [Google Scholar]
- Lindinger MI, Hawke TJ, Lipskie SL, Schaefer HD, Vickery L. K+ transport and volume regulatory responses by NKCC in resting rat hindlimb skeletal muscle. Cell Physiol Biochem. 2002;12:279–292. doi: 10.1159/000067898. [DOI] [PubMed] [Google Scholar]
- Lindinger MI, Heigenhauser GJ, Spriet LL. Effects of alkalosis on muscle ions at rest and with intense exercise. Can J Physiol Pharmacol. 1990;68:820–829. doi: 10.1139/y90-125. [DOI] [PubMed] [Google Scholar]
- Linossier MT, Dormois D, Bregere P, Geyssant A, Denis C. Effect of sodium citrate on performance and metabolism of human skeletal muscle during supramaximal cycling exercise. Eur J Appl Physiol Occup Physiol. 1997;76:48–54. doi: 10.1007/s004210050211. [DOI] [PubMed] [Google Scholar]
- Nielsen HB, Hein L, Svendsen LB, Secher NH, Quistorff B. Bicarbonate attenuates intracellular acidosis. Acta Anaesthesiol Scand. 2002;46:579–584. doi: 10.1034/j.1399-6576.2002.460516.x. [DOI] [PubMed] [Google Scholar]
- Nielsen JJ, Kristensen M, Hellsten Y, Bangsbo J, Juel C. Localization and function of ATP-sensitive potassium channels in human skeletal muscle. Am J Physiol Regul Integr Comp Physiol. 2003;284:R558–R563. doi: 10.1152/ajpregu.00303.2002. [DOI] [PubMed] [Google Scholar]
- Nielsen OB, Ortenblad N, Lamb GD, Stephenson DG. Excitability of the T-tubular system in rat skeletal muscle: roles of K+ and Na+ gradients and Na+–K+ pump activity. J Physiol. 2004;557:133–146. doi: 10.1113/jphysiol.2003.059014. [DOI] [PMC free article] [PubMed] [Google Scholar]
- Oopik V, Saaremets I, Medijainen L, Karelson K, Janson T, Timpmann S. Effects of sodium citrate ingestion before exercise on endurance performance in well trained college runners. Br J Sports Med. 2003;37:485–489. doi: 10.1136/bjsm.37.6.485. [DOI] [PMC free article] [PubMed] [Google Scholar]
- Raymer GH, Marsh GD, Kowalchuk JM, Thompson RT. Metabolic effects of induced alkalosis during progressive forearm exercise to fatigue. J Appl Physiol. 2004;96:2050–2056. doi: 10.1152/japplphysiol.01261.2003. [DOI] [PubMed] [Google Scholar]
- Russell JM. Sodium-potassium-chloride cotransport. Physiol Rev. 2000;80:211–296. doi: 10.1152/physrev.2000.80.1.211. [DOI] [PubMed] [Google Scholar]
- Schabort EJ, Wilson G, Noakes TD. Dose-related elevations in venous pH with citrate ingestion do not alter 40-km cycling time-trial performance. Eur J Appl Physiol. 2000;83:320–327. doi: 10.1007/s004210000264. [DOI] [PubMed] [Google Scholar]
- Shave R, Whyte G, Siemann A, Doggart L. The effects of sodium citrate ingestion on 3,000-meter time-trial performance. J Strength Cond Res. 2001;15:230–234. [PubMed] [Google Scholar]
- Sjøgaard G, Adams RP, Saltin B. Water and ion shifts in skeletal muscle of humans with intense dynamic knee exercise. Am J Physiol Regul Integr Comp Physiol. 1985;248:R190–R196. doi: 10.1152/ajpregu.1985.248.2.R190. [DOI] [PubMed] [Google Scholar]
- Spruce AE, Standen NB, Stanfield PR. Voltage- dependent ATP-sensitive potassium channels of skeletal muscle membrane. Nature. 1985;316:736–738. doi: 10.1038/316736a0. [DOI] [PubMed] [Google Scholar]
- Street D, Bangsbo J, Juel C. Interstitial pH in human skeletal muscle during and after dynamic graded exercise. J Physiol. 2001;537:993–998. doi: 10.1111/j.1469-7793.2001.00993.x. [DOI] [PMC free article] [PubMed] [Google Scholar]
