Targeted disruption of the Chop gene delays endoplasmic reticulum stress–mediated diabetes (original) (raw)
Abstract
Overload of pancreatic β cells in conditions such as hyperglycemia, obesity, and long-term treatment with sulfonylureas leads to β cell exhaustion and type 2 diabetes. Because β cell mass declines under these conditions, apparently as a result of apoptosis, we speculated that overload kills β cells as a result of endoplasmic reticulum (ER) stress. The Akita mouse, which carries a conformation-altering missense mutation (Cys96Tyr) in Insulin 2, likewise exhibits hyperglycemia and a reduced β cell mass. In the development of diabetes in Akita mice, mRNAs for the ER chaperone Bip and the ER stress–associated apoptosis factor Chop were induced in the pancreas. Overexpression of the mutant insulin in mouse MIN6 β cells induced Chop expression and led to apoptosis. Targeted disruption of the Chop gene delayed the onset of diabetes in heterozygous Akita mice by 8–10 weeks. We conclude that ER overload in β cells causes ER stress and leads to apoptosis via Chop induction. Our findings suggest a new therapeutic approach for preventing the onset of diabetes by inhibiting Chop induction or by increasing chaperone capacity in the ER.
Introduction
Type 2 diabetes is characterized by insulin resistance and pancreatic β cell dysfunction. Hyperglycemia occurs by a progressive failure of pancreatic β cells to secrete sufficient amounts of insulin to compensate for the insulin resistance. Thus, dysfunction of β cell secretion is a key element in the pathophysiology of type 2 diabetes. Increased demand for insulin secretion under certain conditions, such as obesity and long-term treatment with sulfonylureas, may result in β cell overload and insulin secretion deficiency. β cell dysfunction under these conditions is often termed “pancreatic β cell exhaustion.” Several studies have shown that β cell mass (both number and individual volume of cells) is reduced in patients with type 2 diabetes (1, 2), an event possibly due to apoptotic death of β cells and to a reduction of cell proliferation. Precise mechanisms remain to be determined.
One of the characteristic features of β cells is a highly developed endoplasmic reticulum (ER), apparently due to heavy engagement in insulin secretion. The ER serves several important functions, including posttranslational modification, folding, and assembly of newly synthesized secretory proteins, and its proper function is essential to cell survival. The ER is regulated by signaling pathways that respond to an accumulation of unfolded or misfolded proteins in the organelle. At least four functionally distinct responses have been identified (3–5). The first response involves upregulation of genes encoding ER chaperone proteins, such as Bip/GRP78 and GRP94, to increase protein folding activity and prevent protein aggregation. The second response consists of translational attenuation, to reduce the load of new protein synthesis and prevent further accumulation of unfolded proteins. The third is degradation of misfolded proteins in the ER, a process known as ER-associated degradation. The misfolded proteins are transported from the ER to the cytosol, where ubiquitin-conjugating enzymes target them for degradation by the 26S proteasome. The last response is apoptosis, which occurs when functions of the ER are extensively impaired. This apoptotic event is mediated by transcriptional activation of the gene for Chop (C/EBP homologus protein, also known as GADD153), a member of the C/EBP family of transcription factors (6, 7), and by activation of ER-associated caspase-12 (8). The upstream components of these response pathways consist of several transmembrane proteins in the ER that transmit stress signals in response to perturbation of protein folding. ER stress transducer proteins, including Ire1α and PERK, are expressed at high levels in β cells. Mice lacking PERK were found to exhibit β cell death and to develop diabetes (9). Mice with a homozygous mutation at the eIF2α phosphorylation site have a β cell deficiency (10). These data suggest that β cells are affected by ER stress under conditions lacking any sign of insulin resistance (such as obesity). Moreover, we found that nitric oxide–induced apoptosis in β cells is mediated by the ER-stress pathway (11). Nitric oxide depletes ER Ca2+, causes ER stress, and leads to apoptosis through Chop induction. Pancreatic islets from Chop knockout mice showed resistance to nitric oxide. High expression of these ER stress transducer proteins may be necessary for strict quality control of secretory proteins in β cells, and the disturbance in protein traffic in the ER may lead to cell death.
A mutant mouse line, called the Akita mouse, which spontaneously develops hyperglycemia with reduced β cell mass, but without insulitis or obesity, was established (12, 13). Genetic analysis revealed that a mutation of the insulin 2 gene (Ins2) (Cys96Tyr) is responsible for the diabetic phenotype in this mouse (14). This mutation disrupts a disulfide bond in insulin between the A and B chains and is thought to induce a drastic conformational change of this molecule. We speculated that this mouse could serve as a diabetic model related to ER stress. We now report that progressive hyperglycemia in the Akita mouse is accompanied by Chop induction and β cell apoptosis. Targeted disruption in the Chop gene delayed the onset of disease in heterozygous Akita mice. These results highlight the importance of chronic ER stress in β cell apoptosis and in the reduced islet mass observed in type 2 diabetes.
Methods
Generation of animal models.
All procedures involving these animals were approved by the Animal Care and Use Committee of Kumamoto University. Mice lacking the Chop gene (C57BL/6 background) were generated as described (11). Akita mice, which carry the Cys96Tyr (C96Y) missense mutation in the Ins2 gene, were established on a C57BL/6 background and characterized as described (12, 13). Heterozygous mutants for Ins2 (Ins2WT/C96Y) were crossed with homozygous mutants for the Chop gene (Chop–/–), generating Ins2WT/WTChop+/– and Ins2WT/C96YChop+/– mice. Ins2WT/C96YChop+/– mice were crossed with Ins2WT/C96YChop+/– or Ins2WT/WTChop–/– mice, which yielded nine genotypes of mice: Ins2WT/WTChop+/+, Ins2WT/WTChop+/–, Ins2WT/WTChop–/–, Ins2WT/C96YChop+/+, Ins2WT/C96YChop+/–, Ins2WT/C96YChop–/–, Ins2C96Y/C96YChop+/+, Ins2C96Y/C96YChop+/–, and Ins2C96Y/C96YChop–/–.
Genotyping of the double-mutant mice.
The genotype for Ins2 was determined by RFLP, as described (14). The genotype for Chop was determined by PCR. The following primers were used: the sense primer was 5′-GAGAAAAAAAGAGTACAAATGGCCTGG-3′, and the antisense primers were 5′-AATTTCATCTGAGGACAGG-ACCTCCTG-3′ (derived from the neomycin resistance gene), and 5′-ATCGCCTTCTATCGCCTTCTTGACGAG-3′ (derived from the Chop gene). The thermal cycle reaction was performed as follows: 94°C for 2 minutes, followed by 35 cycles at 94°C for 15 seconds, 55°C for 30 seconds, 68°C for 2 minutes, and 72°C for 7 minutes. The wild-type and recombinant alleles each yielded a transcript of 1.3 kb.
Northern blot analysis.
Total RNA (2.0 μg per lane) was electrophoresed in formaldehyde-agarose gels, and blotted onto nylon membranes. Northern blot analysis was done as described (15). Digoxigenin-labeled antisense RNA probes for mouse insulin 2 (nucleotides 2344–3026; GenBank accession number NM_008387), mouse Chop (11), and mouse Bip (nucleotides 1629–1859; GenBank accession number AJ002387) were synthesized using a DIG RNA labeling kit (Roche Molecular Biochemicals, Indianapolis, Indiana, USA). Chemiluminescence signals were quantified using a chemiluminescence image analyzer (LAS-1000plus; Fuji Photo Film Co., Tokyo, Japan).
Concentrations of blood glucose and plasma insulin.
Blood glucose concentration was measured by the mutarotase/glucose dehydrogenase method, using a glucose analyzer (HemoCue AB, Ängelholm, Sweden). Plasma insulin concentration was measured by a sandwich-type enzyme immunoassay using an insulin ELISA kit (Shibayagi Co., Shibukawa, Japan).
Insulin content in the pancreas.
Pancreata were removed from mice and immediately frozen in liquid nitrogen. Protein extracts were prepared using the acid/ethanol method (16). Briefly, the tissue was homogenized in acid/ethanol (0.18 M HCl in 70% ethanol), and the homogenate was sonicated for 15 seconds and kept at 4°C for 24 hours. Homogenates were then centrifuged at 500 g for 10 minutes at 4°C, and the supernatant was stored at –20°C. After neutralization, insulin in the extracts was measured using insulin ELISA as described above. Protein in tissue extracts was determined by the Bradford method.
Immunostaining and TUNEL assay.
Pancreas specimens were fixed with buffered 4% paraformaldehyde solution, and embedded in paraffin. Blocks were cut into 5-μm-thick sections. Sections were stained with a rabbit anti-insulin polyclonal antibody (Santa Cruz Biotechnology Inc., Santa Cruz, California, USA) or a mouse anti-Chop monoclonal antibody (Santa Cruz Biotechnology Inc.) as the primary antibody; Cy3-labeled anti–rabbit IgG (Amersham Pharmacia Biotech, Piscataway, New Jersey, USA) or Alexa Fluor 488–labeled anti–mouse IgG (Molecular Probes Inc., Eugene, Oregon, USA) was used as the secondary antibody. For apoptosis detection, the TUNEL assay was performed using an in situ apoptosis detection kit (Takara Shuzo Co., Otsu, Japan). The tissues were viewed under an Olympus fluorescence microscope equipped with a krypton-argon laser, and images were acquired using a C5810 color chilled 3CCD video camera system (Hamamatsu Photonics KK, Hamamatsu, Japan).
Cell culture, transfection, and apoptosis analysis.
Mouse insulinoma MIN6 cells were cultured in 60-mm collagen-coated dishes in DMEM supplemented with 25 mM glucose and 10% FCS, as described (11).
Plasmid DNAs (5 μg in total) were transfected into MIN6 cells using LipofectAMINE 2000 (Invitrogen Corp., Carlsbad, California, USA). An expression vector for enhanced green fluorescent protein (pEGFP) and an ER localization vector that expresses enhanced yellow fluorescent protein (pEYFP-ER) were purchased from Clontech Laboratories Inc. (Emeryville, California, USA). The mouse insulin 2 cDNA clone was isolated by RT-PCR, using mRNA from MIN6 cells. To introduce the Cys96Tyr substitution, overlap extension PCR mutagenesis was done using the mutant primers 5′-AGCGTGGCATTGTAGATCAGTGCTACACCA-3′ and 5′-TGGTGTAGCACTGATCTACAATGCCACGCT-3′. The mutation was confirmed by DNA sequencing. Construction of pcDNA-Ins2WT and pcDNA-Ins2C96Y was performed by inserting the full-length cDNA fragment for mouse wild-type or Cys96Tyr, mutant insulin 2 respectively, into the mammalian expression vector pcDNA3.1(–) (Invitrogen Corp.) after linker attachment. To generate the p_Ins2WT_-EGFP and the p_Ins2C96Y_-EGFP constructs, in which EGFP was located at the C-terminus of insulin, the full-length cDNA fragment, full-length except for its termination codon, was inserted into the mammalian expression vector pEGFP-N1 (Clontech Laboratories Inc.).
For the apoptosis assay, 48 hours after transfection, the medium was carefully removed to collect detached cells. Adherent cells were recovered by trypsinization and mixed with the separated medium. Cells were pelleted and resuspended. To analyze apoptotic changes of nuclei, cells were fixed in 4% formaldehyde in PBS for 30 minutes, stained with Hoechst 33258, and observed under a fluorescence microscope. To detect DNA ladder formation, DNA was extracted from cells, electrophoresed in 2% agarose gel, stained with SYBR Green I (Molecular Probes Inc.), and visualized by UV transillumination. Annexin V staining was performed using the Annexin V–Cy3 apoptosis detection kit (Medical and Biological Laboratories Co., Nagoya, Japan) according to the manufacturer’s instructions.
Statistical analysis.
Data were expressed as mean ± SD. Statistical significance of differences between groups was evaluated using the unpaired Student t test. When the P value was less than 0.05, the difference was considered to be statistically significant.
Results
Diabetic phenotype of mice with Ins2 mutation.
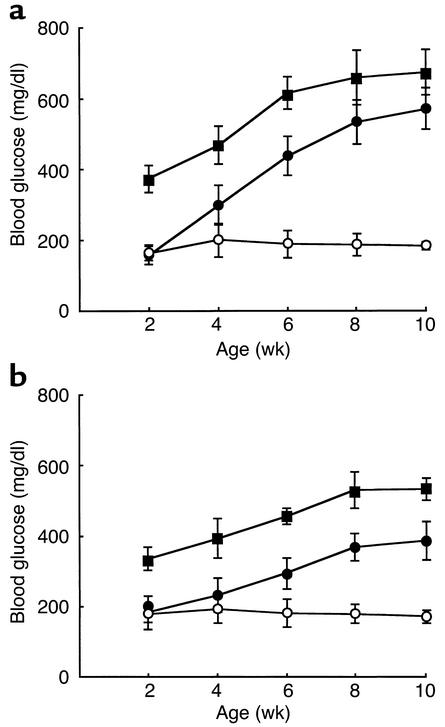
To examine the phenotypic consequences of Ins2 mutation in the Akita mouse, we monitored blood glucose levels in each genotype (Figure 1). Ins2C96Y/C96Y mice developed hyperglycemia at 2 weeks of age, and blood glucose levels continued to increase up to 700 mg/dl at 10 weeks of age. At 2 weeks of age, Ins2WT/C96Y mice had euglycemia. They developed diabetes between 4 and 8 weeks of age. Thus, the severity and the onset of disease correlated well with number of the mutant allele. All Akita mice developed diabetes (100% penetration) and showed the simultaneous onset of disease in each genotype. There was no gender difference in onset of the disease. However, the increase in blood glucose levels was more marked in male than in female mice, both Ins2C96Y/C96Y and Ins2WT/C96Y.
Figure 1.
Development of diabetes in Akita mice. Mice were provided food ad libitum, and blood glucose was measured between 9:00 a.m. and 10:00 a.m. at indicated age. (a) Male. (b) Female. Wild-type Ins2WT/WT mice (open circles), heterozygous Ins2WT/C96Y mice (filled circles), and homozygous Ins2C96Y/C96Y mice (filled squares) are represented. Data are shown as mean ± SD (n = 10).
Induction of ER stress–associated genes in the pancreas of Akita mice.
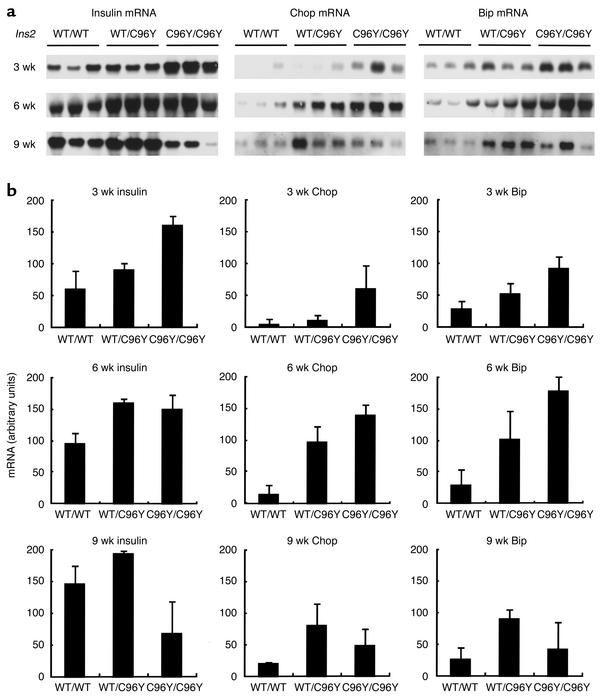
The Ins2 mutation in Akita mice disrupts a disulfide bond between the A and B chains of insulin, and can induce a drastic conformational change in the molecule. We speculated that this misfolded insulin could cause ER stress. To check ER stress in the Akita mice, Northern blot analysis for insulin and ER stress–associated proteins in pancreas was done (Figure 2). In Ins2WT/WT mice, insulin mRNA gradually increased with age (data not shown). At 3 weeks of age, insulin mRNA was higher in Ins2WT/C96Y mice than in Ins2WT/WT mice, and was higher yet in Ins2C96Y/C96Y mice. At 6 weeks of age, insulin mRNA was higher in Ins2WT/C96Y mice than in controls, but was similar between Ins2WT/C96Y mice and Ins2C96Y/C96Y mice. In contrast, at 9 weeks of age, the mRNA was slightly higher in Ins2WT/C96Y mice than in controls, and was much lower in Ins2C96Y/C96Y mice than in controls. This decrease in insulin mRNA in Ins2C96Y/C96Y mice appears to be due to a loss of β cells (see below). Of note is that the onset of diabetes is associated with an increase in insulin mRNA. This suggests that insulin mRNA is induced to compensate for the deficiency in secretion of active insulin. Chop/GADD153, a transcription factor that plays a role in growth arrest and cell death, and Bip/GRP78, an ER chaperone, are induced by ER stress. Chop mRNA was much higher in Ins2C96Y/C96Y mice than in controls at 3 weeks of age. It was also much higher than that in controls in both Ins2WT/C96Y mice and Ins2C96Y/C96Y mice at 6 weeks of age, and in Ins2WT/C96Y mice at 9 weeks of age. The profile of fluctuation in Chop mRNA was similar to that of insulin mRNA. Bip mRNA and Chop mRNA changed in a similar manner. These results indicate that β cells in both heterozygous and homozygous mutant mice are subjected to ER stress, and that the ER stress is closely associated with the induction of insulin mRNA.
Figure 2.
Northern blot analysis for insulin, Chop, and Bip mRNAs in the pancreas of male Akita mice. (a) Chemiluminescent images for insulin, Chop, and Bip mRNAs at the indicated ages are shown. Total RNAs (2.0 mg) from the pancreas of each genotype were subjected to Northern blot analysis. The results at 3, 6, and 9 weeks of age were obtained under essentially identical conditions. (b) Quantification of the results obtained in a, shown as mean ± SD (n = 3).
Overexpression of insulin 2C96Y leads to apoptosis in MIN6 cells.
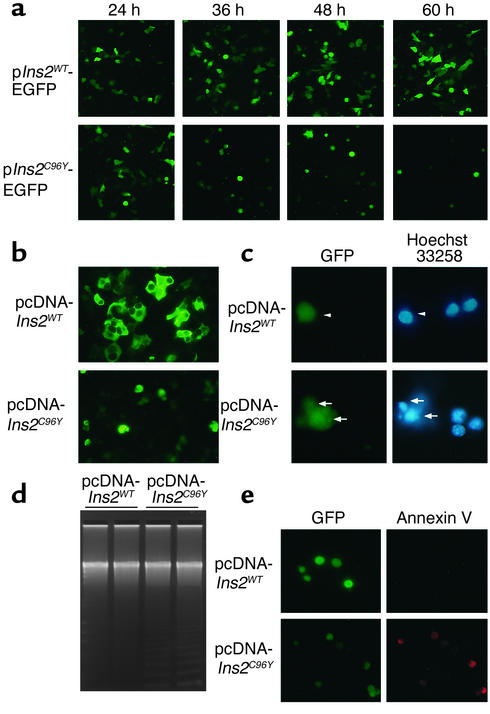
Induction of Chop and postnatal hyperglycemia in Ins2C96Y mice suggests that the mutant insulin causes ER stress and leads to apoptosis in β cells via Chop induction. To test this hypothesis, we overexpressed wild-type and Cys96Tyr mutant insulin 2 in MIN6 cells (Figure 3). We generated fusions of mouse insulin and EGFP for real-time monitoring of apoptosis (Figure 3a). When cells were transfected with the p_Ins2WT_-EGFP plasmid, fluorescence was observed in transfected cells 24 hours after transfection, and apparently increased with time up to 60 hours (Figure 3a). When cells were transfected with the p_Ins2C96Y_-EGFP plasmid, fluorescent cells were morphologically similar to those expressing _Ins2WT_–EGFP at 24 hours. However, cells expressing _Ins2C96Y_–EGFP became round and detached from dishes at 36 hours and thereafter. These results indicate that cells expressing _Ins2C96Y_–EGFP undergo cell death.
Figure 3.
Apoptosis in MIN6 cells overexpressing Ins2C96Y–EGFP and Ins2C96Y. (a) Cells were transfected with p_Ins2WT_-EGFP or p_Ins2C96Y_-EGFP. At the indicated times after transfection, cells were observed under a fluorescence microscope. Original magnification: ×100. (b) Cells were cotransfected with pEYFP-ER and either pcDNA-Ins2WT or pcDNA-Ins2C96Y. Forty-eight hours after transfection, cells were observed under a fluorescence microscope. Original magnification: ×200. (c) Cells were cotransfected with pEGFP and either pcDNA-Ins2WT or pcDNA-Ins2C96Y. The transfected cells and apoptotic cells were visualized by GFP fluorescence and Hoechst 33258 staining, respectively. pcDNA-_Ins2WT_–transfected cells were not apoptotic (arrowheads), whereas pcDNA-_Ins2C96Y_–transfected cells were apoptotic (arrows). Original magnification: ×400. (d) Cells were transfected with pcDNA-Ins2WT or pcDNA-Ins2C96Y. DNA was extracted, electrophoresed in 2% agarose gel, stained with SYBR Green I, and visualized by UV transillumination. (e) Cells were cotransfected with pEGFP and either pcDNA-Ins2WT or pcDNA-Ins2C96Y. The transfected cells and apoptotic cells were visualized by GFP fluorescence and annexin V staining, respectively. Original magnification: ×200.
To exclude artificial effects of fusion proteins, cells were cotransfected with an EYFP-ER expression plasmid and either the pcDNA-Ins2WT plasmid or the pcDNA-Ins2C96Y plasmid. Cells expressing Ins2WT showed ER-like fluorescence, whereas cells expressing Ins2C96Y became round and detached from dishes (Figure 3b). Staining with Hoechst 33258 revealed that cells expressing Ins2C96Y undergo apoptosis (Figure 3c). Transfection with pcDNA-Ins2C96Y plasmid led to formation of DNA ladders, which is characteristic of apoptotic cells (Figure 3d). Annexin V staining revealed that cells expressing Ins2C96Y undergo apoptosis (Figure 3e). Considering these results together, we conclude that overexpression of Ins2C96Y causes ER stress and leads to Chop-mediated apoptosis.
Characteristics of double-mutant mice with Ins2 mutation and Chop disruption.
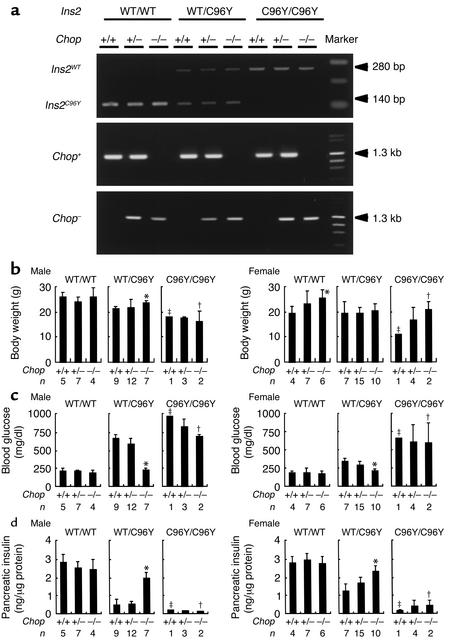
To further investigate the involvement of Chop in ER stress–mediated diabetes, we generated double-mutant mice with mutation in the Ins2 gene and disruption in the Chop gene. Progeny were obtained by crossing Chop–/– mice with Ins2WT/C96Y mice. Figure 4a shows typical examples of genotyping. Nine genotypes of mice were generated: Ins2WT/WTChop+/+, Ins2WT/WTChop+/–, Ins2WT/WTChop–/–, Ins2WT/C96YChop+/+, Ins2WT/C96YChop+/–, Ins2WT/C96YChop–/–, Ins2C96Y/C96YChop+/+, Ins2C96Y/C96YChop+/–, and Ins2C96Y/C96YChop–/–, all of which had the same genetic background (C57BL/6). As shown in Figure 1, Ins2WT/C96Y and Ins2C96Y/C96Y mice developed hyperglycemia by 8 weeks of age. Therefore, we measured body weights, blood glucose levels, and pancreatic insulin content of each genotype at 8 weeks of age (Figure 4b). Ins2C96Y/C96Y mice of all Chop genotypes showed loss of body weight, severe hyperglycemia, and reduced pancreatic insulin content. There was no statistically significant difference among Chop+/+, Chop+/–, and Chop–/– mice. Ins2C96Y/C96Y mice were often perinatally lethal due to defective insulin secretion in response to glucose (data not shown). In contrast, among the Ins2WT/C96Y mice, the Chop–/– mice did not develop hyperglycemia and had significantly higher body weights and pancreatic insulin content than did Chop+/– and Chop+/+ mice. There was little difference in these parameters between Chop+/– and Chop+/+ mice. These results are consistent with our previous finding that pancreatic islets from Chop–/– mice are much more resistant to nitric oxide than are those from Chop+/+ and Chop+/– animals (11). These results indicate that disruption of the Chop gene delays the onset of diabetes in Ins2WT/C96Y mice but not in Ins2C96Y/C96Y mice.
Figure 4.
Characteristics of the double-mutant mice with Ins2 mutation and Chop disruption. (a) Genotyping of double-mutant mice. Representative genotyping of the Ins2 gene by RFLP; the Chop gene from nine mutant lines is shown by PCR. Ins2 exon 3 was amplified by PCR using genomic DNA. The Ins2C96Y mutation in Akita mice disrupts an _Fnu4H_I site in exon 3 of Ins2. Digestion with Fnu4H_I did not change the size of the PCR product from the mutated allele (280 bp), but it decreased that of the wild-type allele to 140 bp. Primers for wild-type and mutated Chop mice are described in Methods. The left lane shows 100-bp DNA ladder markers (top panel) and λDNA/Hind III + φ×174DNA/Hae III fragment markers (middle and bottom panels). (b–d) Phenotypic characterization of double-mutant mice at 8 weeks of age. (b) Body weight. (c) Morning blood glucose. (d) Pancreatic insulin content. Data are shown as mean ± SD. Significant differences among the genotype of the CHOP gene were evaluated by the Student t test: *P < 0.001 versus Chop+/+. ‡_Ins2C96Y/C96YChop+/+ mice died within days of birth. Therefore, †data are shown as only one mouse and ‡data are shown as means ± ranges (n = 2).
There was no statistically significant difference in body weight among Chop+/+, Chop+/–, and Chop–/– male mice. The female Chop–/– mice were seen to have higher body weight than female Chop+/+ animals had. In addition, the development of obesity and fat deposits in the Chop–/– mice after 16 weeks of age appeared to be accelerated (data not shown). It has been suggested that Chop inhibits adipose differentiation by interfering with the accumulation of adipogenic C/EBP isoforms (17, 18). Therefore, we speculate that targeted disruption of the Chop gene results in obesity by increasing adipocyte differentiation. In this study, the Chop–/– mice, generated on a C57BL/6 strain, were backcrossed only two generations from the original 129/Sv × C57BL/6 mice. Therefore, it is also possible that the 129/Sv background influences body weight.
Disruption of the Chop gene protects islet cells of Ins2WT/C96Y mice from apoptosis.
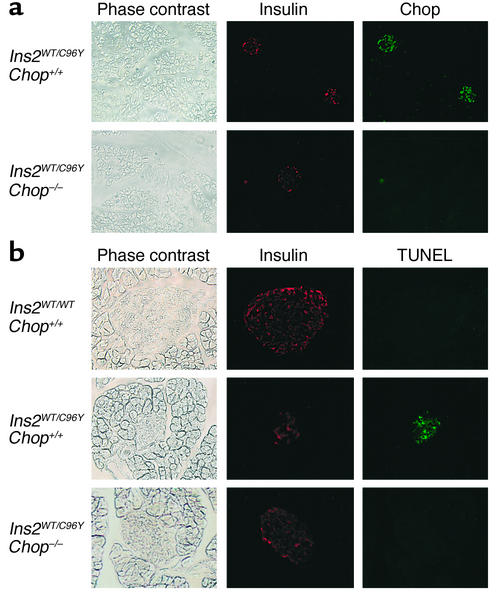
The effect of disruption of the Chop gene in apoptosis of β cells in Ins2WT/C96Y mice was examined histologically (Figure 5). At 4 weeks of age, Chop induction was observed in Ins2WT/C96YChop+/+ islets. Distribution of Chop-positive cells was similar to that of insulin-positive cells, suggesting that Chop-positive cells are β cells. In Ins2WT/C96Y mice, the size of islets decreased markedly, and the mass of insulin-positive cells diminished. Apoptotic (TUNEL-positive) cells were clearly observed in islets. In contrast, in Ins2WT/C96YChop–/– mice, islet size was fairly well retained, and the number of TUNEL-positive cells was much smaller. The number of TUNEL-positive cells per islet in Ins2WT/C96YChop+/+ mice was 10.50 ± 10.73 (n = 20), whereas that in Ins2WT/C96YChop–/– mice was 1.10 ± 1.74 (n = 20). In Ins2C96Y/C96Y mice, disruption of the Chop gene failed to protect islets from apoptosis (data not shown). These data indicate that the hyperglycemia in Ins2C96Y mutant mice was primarily due to a specific decrease of β cells through ER stress–mediated apoptosis, and that disruption of the Chop gene rescues β cells of Ins2WT/C96Y mice from apoptosis.
Figure 5.
Immunohistochemical detection of Chop and apoptosis in islets of male Ins2WT/WTChop+/+, Ins2WT/C96YChop+/+, and Ins2WT/C96YChop–/– mice. (a) Immunostaining of insulin and Chop. The pancreata from Ins2WT/C96YChop+/+ and Ins2WT/C96YChop–/– male mice at 4 weeks of age were fixed and then costained for insulin (red) and Chop (green). Phase-contrast images and fluorescence images of the same fields are shown. Original magnification: ×100. (b) Apoptosis detection by the TUNEL method. The pancreata from Ins2WT/WTChop+/+, Ins2WT/C96YChop+/+, and Ins2WT/C96YChop–/– male mice were obtained and costained for insulin (red) and TUNEL-positive cells (green). Phase-contrast images and fluorescence images of the same fields are shown. Original magnification: ×200.
Disruption of the Chop gene delays the onset of diabetes in Ins2WT/C96Y mice.
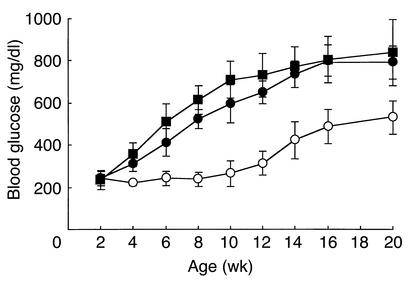
To determine whether disruption of the Chop gene would block or delay the onset of diabetes in Ins2WT/C96Y mice, we monitored blood glucose levels in Ins2WT/C96YChop+/+, Ins2WT/C96YChop+/–, and Ins2WT/C96YChop–/– mice (Figure 6). Both Ins2WT/C96YChop+/+ and Ins2WT/C96YChop+/– mice developed hyperglycemia beginning at 4 weeks of age. Blood glucose levels in these mice increased up to about 800 mg/dl, at which point mice were 20 weeks of age. In contrast, blood glucose in Ins2WT/C96YChop–/– mice remained unchanged (less than 250 mg/dl) until the mice reached 8 weeks of age. At that point levels began to increase; at 20 weeks the blood glucose level in these mice was about 500 mg/dl. Thus, disruption of the Chop gene delayed the onset of diabetes in Ins2WT/C96Y mice by 8–10 weeks; hyperglycemia was somewhat overcome but was not prevented.
Figure 6.
Development of diabetes in male Ins2WT/C96YChop+/+, Ins2WT/C96YChop+/–, and Ins2WT/C96YChop–/– mice. Mice were provided food ad libitum, and blood glucose was measured between 9:00 a.m. and 10:00 a.m. Ins2WT/C96YChop+/+ mice (filled squares), Ins2WT/C96YChop+/– mice (filled circles), and Ins2WT/C96YChop–/– mice (open circles) are represented. Data are shown as mean ± SD (n = 7).
Discussion
We obtained evidence that mutation in Akita mice causes ER stress, induces Chop mRNA, and leads to the apoptosis of β cells. Targeted disruption of the Chop gene significantly prevented _Ins2C96Y_–induced diabetes by decreasing ER stress–mediated apoptosis in β cells. Therefore, perturbation in functions of the ER in β cells leads to diabetes through Chop induction.
The ER has a mechanism to monitor protein folding called “quality control” (19). In Ins2C96Y mutant mice, the mutant insulin is not secreted; it is trapped in the ER and is intracellularly degraded (14). This mouse has two nonallelic insulin genes (Ins1 and Ins2). In wild-type mice, Ins2 transcripts represent the majority of total insulin. Although Ins2C96Y mice develop severe diabetes, single-mutant mice that are either Ins1–/– or Ins2–/– do not, and plasma insulin levels in these mice are normal (20). Hence, we speculated that diabetes in Ins2C96Y mice is induced by β cell disruption mediated by ER stress, rather than by the loss of active insulin. This notion is supported by evidence of apoptosis and the induction of Chop mRNA in the pancreas of Ins2C96Y mutant mice. In Ins2–/– mutant mice, to overcome insulin deficiency, the β cell mass is increased and synthesis of insulin 1 is enhanced (20). In Ins2C96Y mice, on the other hand, expression of the insulin gene is upregulated to compensate for insulin deficiency, but synthesized mutant insulin induces ER stress, β cell death follows, and glucose metabolism is decreased (Figure 2).
β cells are strongly engaged in protein secretion and have highly developed ER. ER stress transducer proteins, including Ire1α and PERK, are expressed at high levels in β cells. This high expression may be necessary for strict quality control of secretory proteins in β cells, and disturbance of protein traffic in ER may lead to cell death. Two recent studies using genetically engineered mice revealed that PERK disruption and defective eIF2α phosphorylation results in β cell insufficiency, thereby demonstrating that the PERK-eIF2α pathway plays an important role in translational control in ER stress (9, 10). Postnatally increased apoptosis in β cells was observed in PERK–/– mice. Electron micrographs of islets in PERK–/– mice revealed dilated ER in β cells, and a reduced number and size of secretory granules. Similar changes are observed in islets of Akita mice (14). Mutations in the human PERK gene cause Wolcott-Rallison syndrome, an autosomal recessive disease with severe diabetes that develops in infancy (21). Patients have pancreatic hypoplasia and a reduced number of β cells (22). Taken together, these results suggest that chronic ER stress results in hyperglycemia due to reduction in β cell mass, and that β cells are most susceptible to ER stress.
In contrast to patients with type 1 diabetes, those with type 2 diabetes are often hyperinsulinemic during the prediabetic or early diabetic phase. Overload of pancreatic β cells under conditions such as hyperglycemia, obesity, and long-term treatment with sulfonylureas is often observed in type 2 diabetes. This increased demand of insulin may exhaust the secretory capacity of β cells. Indeed, when MIN6 cells were transfected with wild-type insulin, highly overexpressed cells were prone to apoptosis (data not shown). These findings support the idea that chronic ER stress caused by excessive demand of insulin is responsible for β cell exhaustion. However, disruption of the Chop gene failed to prevent diabetes in Ins2WT/C96Y mice, although it did delay the onset of disease. In the case of Ins2C96Y/C96Y mice, disruption of the Chop gene could not delay the onset of diabetes. Chop induction in response to ER stress is highly dependent on PERK (23). In islets of PERK–/– mice, induction of Chop is attenuated, but β cells undergo apoptosis (9). Thus, the involvement of other death pathways, such as activation of JNK via Ire1α (24) and activation of caspase-12 (8), seems likely.
There are similarities in development between type 1 and type 2 diabetes. Once mild hyperglycemia occurs, a common pathway of diabetes leads to further severe hyperglycemia. Our results provide evidence suggesting that the ER in β cells modifies the development of diabetes. We propose that overload of β cells causes chronic ER stress and leads to apoptosis of β cells via Chop induction. Therefore, targeted suppression of Chop expression or its function in β cells may be a new therapeutic approach for preventing the onset of both type 1 and type 2 diabetes.
Acknowledgments
We thank J. Miyazaki (Osaka University) for providing MIN6 cells, R. Shindo (this laboratory) for technical assistance, and N.J. Hoogenraad (La Trobe University) and M. Ohara (Fukuoka, Japan) for comments on the manuscript. This work was supported in part by a Grant-in-Aid from the Ministry of Education, Science, Sports and Culture of Japan.
Footnotes
See the related Commentary beginning on page 443.
References
- 1.Stefan Y, et al. Quantitation of endocrine cell content in the pancreas of nondiabetic and diabetic humans. Diabetes. 1982;31:694–700. doi: 10.2337/diab.31.8.694. [DOI] [PubMed] [Google Scholar]
- 2.Rahier J, Goebbels RM, Henquin JC. Cellular composition of the human diabetic pancreas. Diabetologia. 1983;24:366–371. doi: 10.1007/BF00251826. [DOI] [PubMed] [Google Scholar]
- 3.Kaufman RJ. Stress signaling from the lumen of the endoplasmic reticulum: coordination of gene transcriptional and translational controls. Genes Dev. 1999;13:1211–1233. doi: 10.1101/gad.13.10.1211. [DOI] [PubMed] [Google Scholar]
- 4.Mori K. Tripartite management of unfolded proteins in the endoplasmic reticulum. Cell. 2000;101:451–454. doi: 10.1016/s0092-8674(00)80855-7. [DOI] [PubMed] [Google Scholar]
- 5.Travers KJ, et al. Functional and genomic analyses reveal an essential coordination between the unfolded protein response and ER-associated degradation. Cell. 2000;101:249–258. doi: 10.1016/s0092-8674(00)80835-1. [DOI] [PubMed] [Google Scholar]
- 6.Barone MV, Crozat A, Tabaee A, Philipson L, Ron D. Chop (GADD153) and its oncogenic variant, TLS-Chop, have opposing effects on the induction of G1/S arrest. Genes Dev. 1994;8:453–464. doi: 10.1101/gad.8.4.453. [DOI] [PubMed] [Google Scholar]
- 7.Matsumoto M, Minami M, Takeda K, Sakao Y, Akira S. Ectopic expression of Chop (GADD153) induces apoptosis in M1 myeloblastic leukemia cells. FEBS Lett. 1996;395:143–147. doi: 10.1016/0014-5793(96)01016-2. [DOI] [PubMed] [Google Scholar]
- 8.Nakagawa T, et al. Caspase-12 mediates endoplasmic-reticulum-specific apoptosis and cytotoxicity by amyloid-b. Nature. 2000;403:98–103. doi: 10.1038/47513. [DOI] [PubMed] [Google Scholar]
- 9.Harding HP, et al. Diabetes mellitus and exocrine pancreatic dysfunction in perk–/–mice reveals a role for translational control in secretory cell survival. Mol Cell. 2001;7:1153–1163. doi: 10.1016/s1097-2765(01)00264-7. [DOI] [PubMed] [Google Scholar]
- 10.Scheuner D, et al. Translational control is required for the unfolded protein response and in vivo glucose homeostasis. Mol Cell. 2001;7:1165–1176. doi: 10.1016/s1097-2765(01)00265-9. [DOI] [PubMed] [Google Scholar]
- 11.Oyadomari S, et al. Nitric oxide-induced apoptosis in pancreatic β cells is mediated by the endoplasmic reticulum stress pathway. Proc Natl Acad Sci USA. 2001;98:10845–10850. doi: 10.1073/pnas.191207498. [DOI] [PMC free article] [PubMed] [Google Scholar]
- 12.Kayo T, Koizumi A. Mapping of murine diabetogenic gene Mody on chromosome 7 at D7Mit258 and its involvement in pancreatic islet and β cell development during the perinatal period. J Clin Invest. 1998;101:2112–2118. doi: 10.1172/JCI1842. [DOI] [PMC free article] [PubMed] [Google Scholar]
- 13.Yoshioka M, Kayo T, Ikeda T, Koizumi A. A novel locus, Mody4, distal to D7Mit189 on chromosome 7 determines early-onset NIDDM in nonobese C57BL/6 (Akita) mutant mice. Diabetes. 1997;46:887–894. doi: 10.2337/diab.46.5.887. [DOI] [PubMed] [Google Scholar]
- 14.Wang J, et al. A mutation in the insulin 2 gene induces diabetes with severe pancreatic β-cell dysfunction in the Mody mouse. J Clin Invest. 1999;103:27–37. doi: 10.1172/JCI4431. [DOI] [PMC free article] [PubMed] [Google Scholar]
- 15.Oyadomari S, et al. Coinduction of endothelial nitric oxide synthase and arginine recycling enzymes in aorta of diabetic rats. Nitric Oxide. 2001;5:252–260. doi: 10.1006/niox.2001.0344. [DOI] [PubMed] [Google Scholar]
- 16.Davalli AM. Function, mass, and replication of porcine and rat islets transplanted into diabetic nude mice. Diabetes. 1995;44:104–111. doi: 10.2337/diab.44.1.104. [DOI] [PubMed] [Google Scholar]
- 17.Tang QQ, Lane MD. Role of C/EBP homologous protein (Chop-10) in the programmed activation of CCAAT/enhancer-binding protein-b during adipogenesis. Proc Natl Acad Sci USA. 2000;97:12446–12450. doi: 10.1073/pnas.220425597. [DOI] [PMC free article] [PubMed] [Google Scholar]
- 18.Batchvarova N, Wang XZ, Ron D. Inhibition of adipogenesis by the stress-induced protein Chop (Gadd153) EMBO J. 1995;14:4654–4661. doi: 10.1002/j.1460-2075.1995.tb00147.x. [DOI] [PMC free article] [PubMed] [Google Scholar]
- 19.Kopito RR. ER quality control: the cytoplasmic connection. Cell. 1997;88:427–430. doi: 10.1016/s0092-8674(00)81881-4. [DOI] [PubMed] [Google Scholar]
- 20.Leroux L, et al. Compensatory responses in mice carrying a null mutation for Ins1 or Ins2. Diabetes. 2001;50(Suppl. 1):S150–S153. doi: 10.2337/diabetes.50.2007.s150. [DOI] [PubMed] [Google Scholar]
- 21.Delepine M, et al. EIF2AK3, encoding translation initiation factor 2-a kinase 3, is mutated in patients with Wolcott-Rallison syndrome. Nat Genet. 2000;25:406–409. doi: 10.1038/78085. [DOI] [PubMed] [Google Scholar]
- 22.Thornton CM, Carson DJ, Stewart FJ. Autopsy findings in the Wolcott-Rallison syndrome. Pediatr Pathol Lab Med. 1997;17:487–496. [PubMed] [Google Scholar]
- 23.Harding HP, et al. Regulated translation initiation controls stress-induced gene expression in mammalian cells. Mol Cell. 2000;6:1099–1108. doi: 10.1016/s1097-2765(00)00108-8. [DOI] [PubMed] [Google Scholar]
- 24.Urano F, et al. Coupling of stress in the ER to activation of JNK protein kinases by transmembrane protein kinase IRE1. Science. 2000;287:664–666. doi: 10.1126/science.287.5453.664. [DOI] [PubMed] [Google Scholar]
