A role for p53 in terminal epithelial cell differentiation (original) (raw)
Abstract
Terminal epithelial cell differentiation is a crucial step in development. In the kidney, failure of terminal differentiation causes dysplasia, cystogenesis, and cancer. The present study provides multiple lines of evidence implicating the tumor suppressor protein p53 in terminal differentiation of the renal epithelium. In the developing kidney, p53 is highly enriched in epithelial cells expressing renal function genes (RFGs), such as receptors for vasoactive hormones, the sodium pump, and epithelial sodium and water channels. In comparison, proliferating renal progenitors express little if any p53 or RFGs. p53 binds to and transactivates the promoters of RFGs. In contrast, expression of a dominant negative mutant form of p53 inhibits endogenous RFG expression. Moreover, binding of endogenous p53 to the promoters of RFGs coincides with the differentiation process and is attenuated once renal epithelial cells are fully differentiated. Finally, p53-null pups exhibit a previously unrecognized aberrant renal phenotype and spatial disorganization of RFGs. Interestingly, the p53-related protein p73 is unable to functionally compensate for the loss of p53 and fails to efficiently activate RFG transcription. We conclude that p53 promotes the biochemical and morphological differentiation of the renal epithelium. Aberrations in p53-mediated terminal differentiation may therefore play a role in the pathogenesis of nephron dysgenesis and dysfunction.
Introduction
Terminal differentiation is characterized by cell cycle arrest and activation of the cellular function gene expression program. The genetic programs that couple cellular growth to functional differentiation are a subject of intense investigation (for a review, see ref. 1). While there has been much progress in understanding the early steps involved in renal epithelial cell differentiation, a major gap remains in our knowledge of the factors that control the steps of terminal differentiation. There is increasing appreciation that although formation of adequate numbers of nephrons (i.e., renal mass) is critical for achieving optimal renal function capacity, the signals that determine how, when, and which renal epithelial cells should acquire a given functional phenotype are equally essential. Aberrant terminal differentiation is a hallmark of dysplasia and cancer. Therefore identification of factors that couple cellular growth to functional differentiation is of great clinical importance.
The tumor suppressor protein, p53, prevents tumorigenesis via its capacity as a transcription factor for cell cycle, apoptosis, and DNA repair genes (2–4). p53 activates transcription of its target genes through binding to a consensus DNA element that consists of two copies of the inverted repeat sequence [RRRC(A/T)(T/A)GYYY] separated by 0–13 nucleotides. Wild-type p53 also represses the transcription of some genes. The repression can be mediated via specific DNA binding or by an effect on the basal transcription machinery. Among the well characterized p53 target genes are p21Waf1/Cip1, GADD45, IGF-BP3, Bax, cyclin G, and proliferating cell nuclear antigen (PCNA) (2–4). Human p53 consists of 393 amino acids and is composed of three regions: an N-terminal activation domain that interacts with coactivators and proteins, a core DNA-binding domain, and a C-terminal activation/oligomerization domain. Mutations in the p53 protein are present in more than 50% of all human cancers, and most affect the sequence-specific binding of p53 to its target promoters. Mutant p53 molecules retain their capacity to oligomerize with wild-type p53, thus acting to suppress transcription in a dominant negative (DN) fashion.
There is evidence supporting a role for p53 in development and differentiation. For example, p53-induced differentiation is well documented in a number of cell lineages such as myogenic cells, osteogenic cells, keratinocytes, neurons, and thyroid cells (5, 6). Moreover, p53 is expressed at high levels during embryogenesis, with persistent expression in some tissues undergoing differentiation (7–12). Whereas earlier reports did not identify a specific developmental defect in p53-null mice (13, 14), more recent reports have described excess embryonic lethality and aberrant neural development on related mouse backgrounds (15–17). The related p53 family members p63 and p73 have clear roles in skin, limb, and neural development (18–20).
Differential gene expression analyses have recently revealed that the list of p53 target genes is considerably larger than previously recognized and includes a number of enzymes and substrates necessary for normal cellular metabolism and function (21–23). Therefore, in addition to tumor surveillance, p53 likely regulates specific cellular functions. We report here that p53 regulates the transcription of several genes expressed in the kidney and whose function is required for the maintenance of body salt and water homeostasis. Like p53, the products of these renal function genes (RFGs) are enriched in differentiated epithelial cells, and p53 is capable of activating the RFG promoters. We also report that developing p53 mutant mice exhibit a renal phenotype that is consistent with aberrant terminal differentiation. Based on these results, we conclude that p53 plays a key role in the transcriptional control of terminal epithelial differentiation.
Methods
Plasmids and promoter constructs.
Rat bradykinin B2 receptor (B2R) promoter constructs and the p53 expression vectors have been described (24). Human Na,K-ATPase-α1 (25) and rat angiotensin II type 1a receptor (AT1A) (26) reporter plasmids were generously provided by J. Lingrel (University of Cincinnati, Cincinnati, Ohio, USA) and T.J. Murphy (Emory University, Atlanta, Georgia, USA), respectively. A ten-kilobase _EcoR_I-_Eco_47III DNA fragment from a mouse aquaporin-2 (AQP-2) genomic clone, encompassing the transcription start site (a generous gift of D. Kohan, University of Utah, Salt Lake City, Utah, USA), was inserted into the _Sma_I site of the pCAT3-basic reporter construct (Promega Corp., Madison, Wisconsin, USA). The human and simian pCMV-p73β expression plasmids were kindly provided by G. Melino (University Tor Vergata, Rome, Italy) and W. Kaelin (Dana Farber Cancer Institute, Boston, Massachusetts, USA), respectively. Deletion of the p53 binding sites in the B2R and Na,K-ATPase-α1 promoter constructs was performed using the QuickChange site-directed mutagenesis system (Stratagene, La Jolla, California, USA) following the manufacturer’s protocol. All constructs were subjected to DNA sequencing to verify the sequence and orientation. Primers used for mutagenesis of p53 binding sites were as follows (forward primers): rat B2R (nucleotide position –50), 5′-CTGGCCGGTGATGTCACCCCTCCACTTCCAG-3′; human Na,K-ATPase-α1 (nucleotide position –159), 5′-CTCCTGCCGGGAGCCACGCTGTCCGG-3′.
Cell culture, transient transfection, and reporter assays.
Mouse ureteric bud (UB) cells (27) were a kind gift from J. Barasch of Columbia University (New York, New York, USA). HeLa cells and IMCD3 cells were obtained from American Type Culture Collection (Rockville, Maryland, USA) and were maintained in MEM supplemented with 10% FBS, penicillin (100 U/ml), and streptomycin (100 μg/ml) (Life Technologies Inc., Gaithersburg, Maryland, USA) at 37°C in a humidified incubator with 5% CO2. Cells were plated in duplicate in six-well plates at 1.3 × 10⁵ cells/well in DMEM containing 10% FBS 1 day prior to transfection. Cells were transfected with 1.2 μg of DNA per well of promoter-reporter vectors along with pCMV-p53 (wild-type or mutant) expression plasmids (10 ng or 50 ng DNA). A control β-galactosidase–encoding vector, pSV-lacZ (0.5 μg DNA/well; Promega Corp.), was cotransfected to measure transfection efficiency. Controls included transfections with pCMV-CAT or pCMV empty vectors. Transfection was performed using LipofectAMINE PLUS reagent (Life Technologies Inc.) according to the manufacturer’s recommendations. Four hours after transfection, the medium was replaced with fresh medium, and cell extracts were prepared 24–48 hours later using a reporter lysis reagent (Promega Corp.). Aliquots of cell lysate were analyzed for CAT activity after normalization for protein content or β-galactosidase activity as described (24).
Nuclear extracts and electrophoretic mobility shift assay (EMSA).
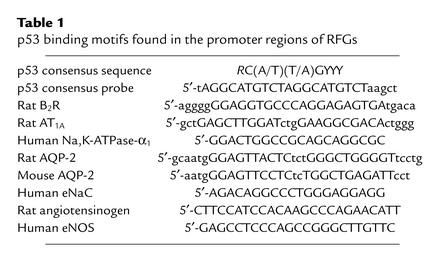
Tissue nuclear extract preparation was performed as described (28). Double-stranded oligonucleotides were 5′ end labeled with [32P]γ-dATP with T4 kinase for use as probes in EMSA with nuclear extracts or with 0.5–2 μg of bacterially expressed recombinant human p53 (1-393; Santa Cruz Biotechnology Inc., Santa Cruz, California, USA). EMSA was performed as described (24). The sequences of oligonucleotides used for EMSA are shown in Table 1.
Table 1.
p53 binding motifs found in the promoter regions of RFGs
Animals, tissues, and immunohistochemistry.
Breeding pairs of p53+/– mice (14) on a C57BL/6 genetic background were obtained from The Jackson Laboratory (Bar Harbor, Maine, USA). Genotyping of the progeny was performed by multiplex PCR following a protocol established by The Jackson Laboratory. Kidneys were harvested on day 1–3 after birth and were immersion-fixed in 10% buffered formalin dehydrated in graded concentrations of alcohol and embedded in paraffin blocks. Serial sections (5–7 μm) were immunostained by the immunoperoxidase technique using the ABC Elite Vectastain kit (Vector Laboratories Inc., Burlingame, California, USA), as previously described (29). The primary antibodies against PCNA (clone PC10, 1:200; DAKO Corp., Carpinteria, California, USA), p53 (FL-393, 1:50–1:100; Santa Cruz Biotechnology Inc.), Pax-2 (1:400; Zymed Laboratories Inc., South San Francisco, California, USA), bradykinin B2R (1:500; Transduction Laboratories, Lexington, Kentucky, USA), AT1 (1:1500; Santa Cruz Biotechnology Inc.), Na,K-ATPase-α1 (1:1,000; Upstate Biotechnology Inc., Lake Placid, New York, USA), and AQP-2 (1:50; Chemicon International Inc., Temecula, California, USA) were used. In negative controls, the primary antibody was omitted or replaced by nonimmune serum.
RT-PCR.
Total RNA was isolated from murine IMCD3 cells 24 hours after transfection with pSV-lacZ pCMV–DN p53 (mutant), or pCMV-p53 (wild-type) expression plasmids using Trizol reagent (Invitrogen Corp., San Diego, California, USA). After DNase digestion, 5 μg of total RNA was reverse transcribed using Reverse Transcriptase (Life Technologies Inc.) in a 20-μl volume. Three to ten microliters of the reaction volume was used in a PCR volume of 50 μl using the Superscript Amplification Set (Life Technologies Inc.). The primer sequences for B2R were: upstream, 5′-AGAACATCTTTGTCCTCAGCG-3′; downstream, 5′-CGTCTGGACCTCCTTGAACT-3′. The product size was 572 bp, and PCR was performed at 94°C for 1 minute, 58°C for 1 minute, and 72°C for 2 minutes, with 1.5 mM MgCl2 in PCRbuffer, for 30 cycles. The primer sequences for AT1A were: upstream, 5′-GCATCATCTTTGTGGTGGG-3′; downstream, 5′-GAAGAAAAGCACAATCGCC-3′. The product size was 603 bp, and PCR was performed at 94°C for 1 minute, 55°C for 1 minute, and 72°C for 2 minutes, with 2.5 mM MgCl2, for 30 cycles. The primer sequences for Na,K-ATPase-α1 were: upstream, 5′-GACCATAAACTCAGCCTGGATG-3′; downstream, 5′- TCTTGATAATAGGAGAAACAGCC-3′. The product size was 325 bp, and PCR was performed at 94°C for 1 minute, 55°C for 2 minutes, and 72°C for 2 minutes, with 2.5 mM MgCl2, for 30 cycles. The primer sequences for GAPDH were: upstream, 5′-AATGCATCCTGCACCACCAACTGC-3′; downstream, 5′- GGCGGCCATGTAGGCCATCTGGAG-3′. The product size was 555 bp, and PCR was performed at 94°C for 1 minute, 58°C for 1 minute, and 72°C for 2 minutes, with 1.5 mM MgCl2, for 30 cycles.
Western blot analysis.
Protein extraction, SDS-PAGE, and Western blotting were performed as described (30).
Results
Spatial correlation of p53 with renal cell differentiation.
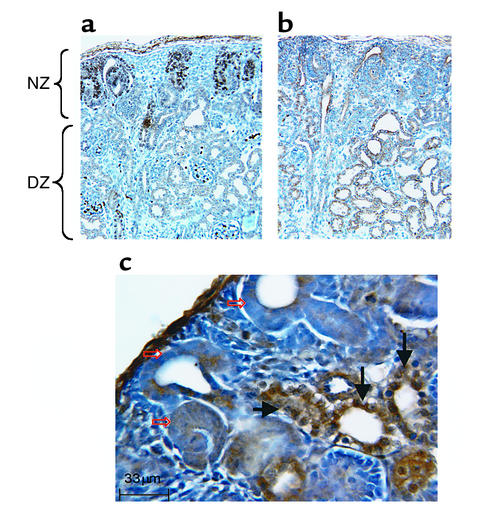
Upon analysis of the rat bradykinin B2R promoter for potential regulatory elements involved in developmental regulation, we found two consensus p53 binding sites and reported that the B2R promoter is a target for p53-mediated transcriptional activation (24). This finding intrigued us because B2R regulates several aspects of renal homeostasis (e.g., blood flow and salt excretion). In the developing kidney, B2R is enriched in differentiated tubular epithelial cells (29). We therefore examined whether the distribution of p53 in the developing rat kidney correlates with biochemical and morphological differentiation. Two distinct zones can be distinguished histologically in the developing kidney: a nephrogenic zone (NZ) and a differentiated zone (DZ) (Figure 1). The NZ contains nephron progenitors that express high levels of the transcription factor Pax-2 (Figure 1a). In comparison, the NZ contains only small amounts of p53 (Figure 1b), and the bulk of p53 is concentrated in the DZ within both proximal and distal nephron segments (Figure 1, b and c). The lack of spatial congruence between p53 and Pax-2 supports previous data showing that Pax-2 represses the p53 promoter (31). Time-course studies that we conducted during fetal development revealed that the p53 protein is not detectable during nephrogenesis until tubular differentiation has advanced to embryonic day 16.5 (data not shown).
Figure 1.
Pax-2 and p53 exhibit nonoverlapping spatial expression in the developing kidney. Immunohistochemical localization of Pax-2 (a) and p53 (b and c) in a fetal rat kidney (day 18 of gestation). Open red arrows denote early immature nephrons; black arrows denote more differentiated tubular epithelial cells.
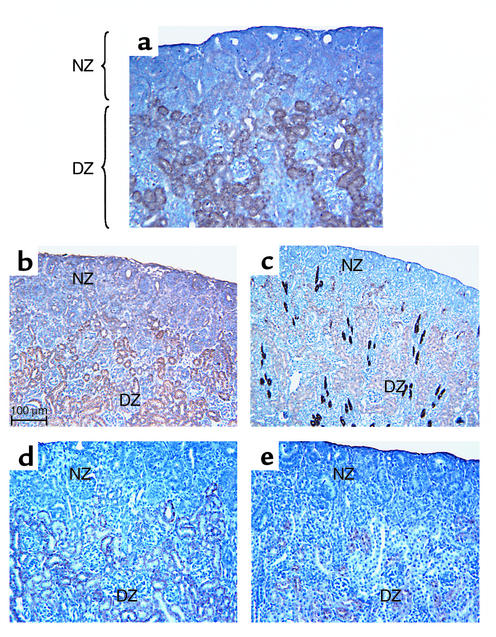
Figure 2 shows the overlap in the distribution patterns of p53 and RFGs (B2R, AT1A, Na,K-ATPase-α1, and AQP-2) within the DZ. Additional RFGs such as the epithelial sodium channel (eNaC) and angiotensinogen are expressed, like p53, in the DZ (data not shown). Collectively, these results demonstrate that p53 expression is spatially associated with differentiated renal epithelial cells, raising the intriguing possibility of a regulatory pathway linking p53 and RFGs in vivo.
Figure 2.
Expression of p53 correlates with terminal epithelial differentiation. Consecutive tissue sections from a 5-day-old newborn rat kidney were immunostained for p53 (a), bradykinin B2R (b), AQP-2 (c), Na,K-ATPase-α1 (d), and AT1A (e). The bulk of p53 is concentrated in the DZ within both proximal and distal nephron segments. Similarly, the RFGs (B2R, AT1A, Na,K-ATPase-α1, and AQP-2) are expressed in the DZ. The NZ contains immature nephron elements and exhibits little immunoreactivity for p53 or RFGs.
RFGs are a novel group of p53-responsive genes.
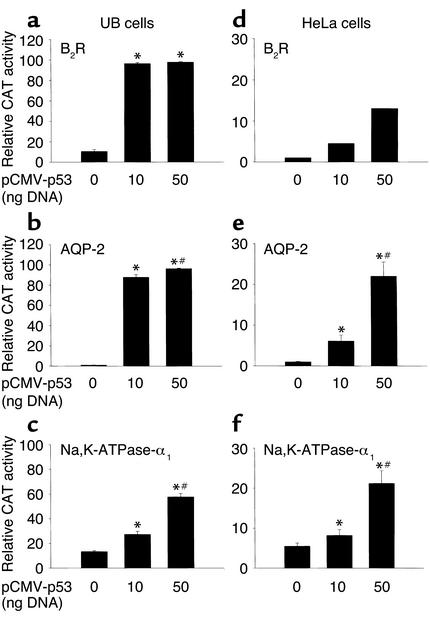
Analysis of published RFG DNA sequences using the TRANSFAC program (-) revealed the presence of one or more consensus p53-like motifs in the promoters of the B2R, AT1A, Na,K-ATPase-α1, AQP-2, angiotensinogen, eNaC, cyclooxygenase-2, and eNOS genes (Table 1). Accordingly, we tested whether the promoters of RFGs are regulated by exogenous wild-type p53 using a ureteric bud cell line derived from embryonic mouse kidney (UB cells). UB cells were transiently transfected with promoter-reporter constructs for rat B2R (–1.2 kb/CAT construct), rat AT1A (–3.2 kb/luciferase), human Na,K-ATPase-α1 (–6.0 kb/CAT), or mouse AQP-2 (–10.0 kb/CAT), along with a pCMV promoter-enhancer–driven p53 expression vector. Figure 3, a–c, demonstrates that p53 strongly activates the promoters of B2R, Na,K-ATPase-α1, and AQP-2. A more modest but significant p53-mediated activation of RFGs was also observed in HeLa cells, a human cervical carcinoma cell line lacking functional endogenous p53 (Figure 3, d–f). p53 did not activate the rat AT1A promoter (–3.2 kb/CAT) in UB or HeLa cells (data not shown). However, as shown below, expression of a DN p53 had the effect of repressing endogenous AT1A mRNA and protein expression, suggesting that regulation of the AT1A promoter by p53 may require additional factors.
Figure 3.
Exogenous wild-type p53 transactivates the RFG promoters. UB or HeLa cells were cotransfected with 0, 10, or 50 ng of pCMV-p53 plasmid DNA and 1.2 μg each of promoter-reporter constructs for rat B2R (a and d), mouse AQP-2 (b and e), and human Na,K-ATPase-α1 (c and f). pSV-lacZ (0.5 μg) was cotransfected to measure transfection efficiency. Cellular extracts were harvested 24 hours after transfection and assayed for CAT activity (percent acetylation). The results are mean ± SE of three experiments performed in duplicate. *P < 0.001 versus 0 ng p53; #P < 0.05 versus 10 ng p53.
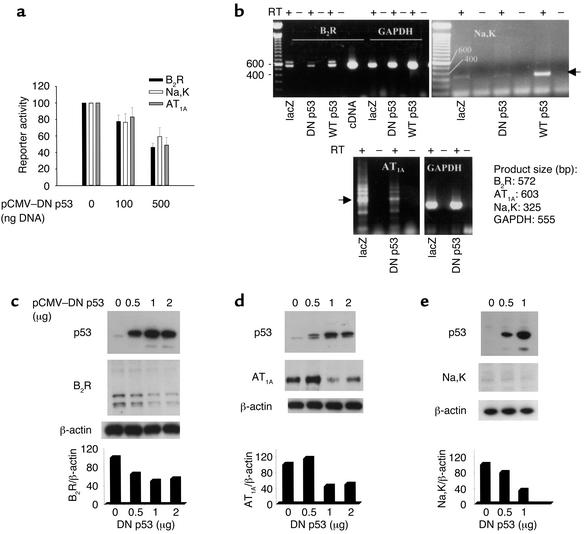
To further examine the p53-mediated regulation of RFGs, we evaluated the effects of overexpressing a DN mutant form of p53, p53E258K, on RFG promoter activity in IMCD3 cells. The RFG promoters, with the exception of AQP-2, exhibit measurable basal activities in these cells. p53E258K encodes a p53 protein that is defective in DNA binding but retains its ability to oligomerize with and inactivate endogenous wild-type p53. As shown in Figure 4a, overexpression of DN p53 suppressed the basal activities of the B2R, AT1A, and Na,K-ATPase-α1 promoters. In addition, semiquantitative RT-PCR showed that overexpression of DN p53 by transient transfection suppressed expression of endogenous B2R, AT1A, and Na,K-ATPase-α1 mRNA compared with that occurring in pSV-lacZ–transfected cells (Figure 4b) or a control pCMV empty vector (not shown).
Figure 4.
DN p53 inhibits RFG expression and promoter activity. (a) IMCD3 cells were cotransfected with increasing amounts (0, 100, and 500 ng) of a viral promoter–driven DN p53 plasmid and a fixed amount (1.2 μg) of B2R, AT1A, and Na,K-ATPase-α1 promoter-reporter constructs. Cell lysate was harvested 24 hours after transfection and was assayed for CAT or luciferase activity. (b) Representative RT-PCR assays of RFG mRNA expression. Transfection of IMCD3 cells with DN p53 plasmid (1.0 μg DNA) represses endogenous B2R (range 1.5- to 4-fold; n = 3), Na,K-ATPase-α1 (2.5- to 4-fold; n = 3), and AT1A (2- to 4-fold; n = 3) mRNA expression relative to that found in control pSV-lacZ–transfected cells. Transfection of pCMV-p53 (wild-type) plasmid (1.0 μg DNA) activates B2R and Na,K-ATPase-α1 mRNA expression. A full-length rat B2R cDNA template (lane labeled cDNA) was used as positive control in the PCR amplification reaction for B2R. GAPDH expression was not affected by wild-type or DN p53. (c–e) Effects of DN p53 on endogenous RFG expression evaluated by Western blot analysis using B2R (c), AT1A (d), and Na,K-ATPase-α1 (e) antibodies. Transfection efficiency in these experiments ranged between 30% and 40%. Western blotting with PAb240 shows evidence of overexpression of human DN p53. Probing for β-actin assessed equal loading of proteins on the gel. RT: reverse transcriptase; WT: wild-type; Na,K: Na,K-ATPase-α1.
To assess whether these changes in gene transcription are paralleled by changes in protein expression, whole cell lysate was collected 24 hours after transfection and was subjected to Western blotting. The pSV-lacZ vector was used to measure transfection efficiency. Overexpression of DN p53 resulted a dose-dependent downregulation of endogenous B2R, AT1A, and Na,K-ATPase-α1 protein levels (Figure 4, c–e). Collectively, these results suggest that cellular p53 regulates RFG expression under physiological conditions.
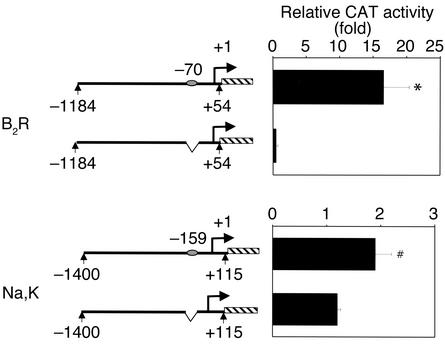
To determine whether p53-mediated promoter activation is dependent on sequence-specific DNA binding, the p53 binding sites in the B2R and Na,K-ATPase-α1 promoters were deleted using a site-directed mutagenesis approach. As shown in Figure 5 (top), deletion of the p53 binding site at nucleotide position –50 to –69 in the rat B2R promoter abolished p53-mediated transactivation. Truncation of the Na,K-ATPase-α1 promoter (–6.0 kb/CAT construct) to approximately 1.4 kb upstream of the transcription start site did not affect the promoter responsiveness to p53. However, deletion of the p53 binding motif at nucleotide position –159 to –178 significantly suppressed p53-mediated activation, by about 50% (Figure 5, bottom). The residual activity is probably mediated by p53 binding to additional unidentified p53 binding sites, since a DNA-binding mutant of p53 is incapable of activating this promoter (data not shown).
Figure 5.
Deletion of p53 binding sites in RFG promoters inhibits p53-mediated activation. UB cells were transfected with 50 ng of pCMV-p53 and the B2R or Na,K-ATPase-α1 promoter-reporter constructs (1.2 μg each). Cell extracts were harvested 24 hours after transfection and were assayed for CAT activity. Results are expressed as fold difference and are mean ± SE of three experiments performed in duplicate. *P < 0.001; #P < 0.05.
Recent studies have identified two new members in the p53 gene family, p63 and p73. The three proteins share some target genes. We assessed whether p73 has any effects on RFG promoter activity. Expression of either human or simian p73β in HeLa or UB cells failed to transactivate the AQP-2 and Na,K-ATPase-α1 promoters and modestly activated B2R (twofold) compared with the effect of p53 treatment, which increased B2R activity up to 15-fold. This indicates that the RFGs respond selectively to p53 (data not shown).
Binding of p53 to RFG promoters.
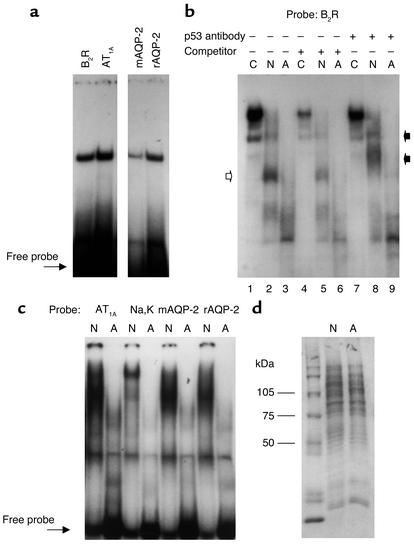
p53 activates gene transcription through binding to a consensus DNA element consisting of two copies of the inverted repeat sequence RRRC(A/T)(T/A)GYYY, separated by 0–13 nucleotides (32, 33). We used EMSA to examine whether the putative p53 motifs found in the RFG promoters bind to recombinant human p53 or kidney-derived nuclear extracts. Radiolabeled oligoduplexes corresponding to the p53 sites in the RFGs produced specific DNA-protein complexes with p53, albeit with varying intensity, in the following order: B2R > AT1A > rat AQP-2 > mouse AQP-2 > Na,K-ATPase-α1 (Figure 6, a–c).
Figure 6.
Binding of recombinant p53 or kidney nuclear extracts to the p53 binding sites in RFGs. (a) EMSA shows binding of full-length recombinant human p53 protein (500 ng for B2R and 2 μg for AT1A and AQP-2) to 32P-labeled oligoduplexes corresponding to the p53 motifs in RFG promoters. (b) EMSA showing that the binding of B2R p53 oligoduplex to nuclear extracts derived from newborn kidney (N) is considerably higher than that of the adult kidney (A). Lanes 1, 4, and 7 contain nuclear extracts from a control (C) p53-positive SVT-2 cell line. The specificity of DNA-protein interactions (open arrow) is indicated by attenuation of binding in the presence of a 100-fold excess of unlabeled consensus p53 sequence (lanes 4, 5, and 6) or by producing either a supershift (lane 8, black arrows) or a decrease in complex intensity (lane 7) after treatment with a p53 antibody (2 μg FL-393). (c) EMSA showing that the binding of kidney nuclear extracts to the AT1A, Na,K-ATPase-α1, and AQP-2 p53 oligoduplexes is higher in the newborn (N) than the adult (A) rat. (d) Coomassie blue staining of nuclear proteins in newborn and adult kidney samples. mAQP-2, mouse AQP-2; rAQP-2, rat AQP-2.
The results also showed that the binding of kidney nuclear proteins to the p53 motifs in B2R (Figure 6b), AT1A, Na,K-ATPase-α1, and AQP-2 (Figure 6c) is considerably higher in the newborn rat than in the adult rat. The binding is competed for by excess unlabeled consensus p53 oligoduplex (Figure 6b and data not shown). Moreover, addition of a p53 antibody to the incubation mixture caused either a supershift or a decrease in DNA-protein complex intensity, indicating the presence of p53 in the protein-DNA complex (filled arrows, Figure 6b). The integrity of the nuclear proteins was assessed by Coomassie blue staining of SDS-PAGE gels (Figure 6d). The developmental decline in p53-DNA binding activity likely reflects a corresponding decrease in p53 levels, since the adult kidney expresses only minimal amounts of immunostainable cytoplasmic p53 (data not shown).
p53-null pups have abnormal kidneys.
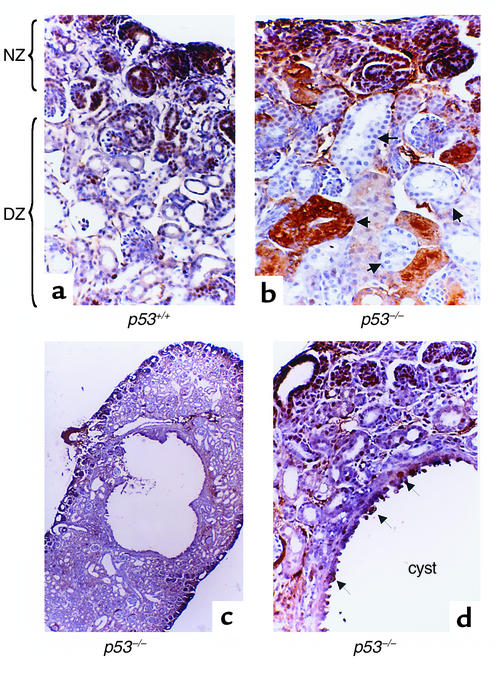
The strong expression of p53 in the DZ and the ability of p53 to regulate RFG expression prompted us to examine the kidney structure and morphology in p53-null mice (14). These mice have been backcrossed onto a C57BL6/J genetic background for ten generations. Compared with their wild-type littermates (Figure 7a), newborn p53–/– mice (n = 47) exhibited multiple renal abnormalities, including foci of tubular epithelial hyperplasia and extension of PCNA staining into the DZ (Figure 7b). Kidneys of p53-null pups also exhibited cystic changes (Figure 7, c and d, and Figure 8c). The cyst epithelium is hyperplastic (PCNA-positive) (Figure 7d). The overall integrity of the NZ in p53–/– mice appears to be intact, indicating that p53 deficiency has no discernible effects on the early steps of nephrogenesis.
Figure 7.
p53-deficient mice have abnormal kidneys. (a) Kidney tissue section from a newborn wild-type mouse. Note the clear demarcation between the NZ and DZ. PCNA immunostaining is restricted to the NZ. The DZ contains relatively thin-walled tubules consisting of a single layer of differentiated epithelial cells (×200). (b) Kidney tissue section from a littermate p53–/– mouse. Note the loss of demarcation between NZ and DZ; PCNA is expressed in ectopic sites within the tubules of the DZ. Also, note the aberrant morphology, enlargement, and hyperplasia (arrows) of the renal tubular epithelium (×200). (c) Kidney of a newborn p53–/– mouse showing a giant cyst surrounded by smaller cysts and dilated tubules (×40). (d) A higher-power view of the cyst wall showing the proliferative PCNA-positive epithelium (arrows) (×400).
Figure 8.
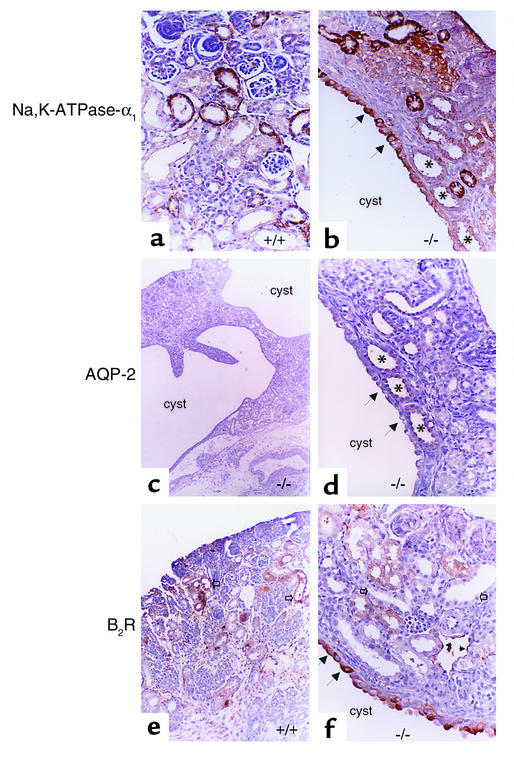
Abnormal spatial expression of RFG products in p53-null mice. Immunolocalization of Na,K-ATPase-α1 (a and b), AQP-2 (c and d), and B2R (e and f). (a) Kidney section from a newborn p53+/+ mouse showing basolateral staining for Na,K-ATPase-α1 (×100). (b) Staining for Na,K-ATPase-α1 in a p53–/– littermate showing atypical localization on the apical aspect of the cyst’s epithelium (black arrows). This functional abnormality is expected to pump Na+ into the cyst cavity, thus enlarging its size. Dilated cortical collecting ducts in the tissue around the cyst (×200) are denoted by asterisks. (c) A low-power view of a kidney section from a p53–/– newborn mouse showing two adjacent large cysts separated by a strand of cortical tissue (×40). AQP-2 staining intensity is difficult to detect in the cortical collecting ducts but is visible in the papillary ducts. (d) A higher-power view of one of the cysts in c, showing lack of staining for AQP-2 in the cyst epithelium (black arrows). Lack of AQP-2 from the cyst wall correlates functionally with decreased free water absorption, which promotes cyst expansion. Dilated AQP-2–positive collecting ducts (×400) are shown by asterisks. (e) B2R immunostaining in a kidney from a newborn p53+/+ mouse. B2R is expressed in the cortical collecting ducts (open arrows) (×200). (f) B2R expression is low in normal tubules but increased in the cyst epithelium (black arrows) (×400). B2R mediates sodium and water excretion; thus this abnormality would be expected to favor cyst expansion.
Immunostaining for RFGs revealed aberrant localization of Na,K-ATPase-α1 on the luminal aspect of the tubular cysts (Figure 8, a and b). Also noted was an absence of AQP-2 immunoreactivity in the cyst epithelium (Figure 8d). B2R immunoreactivity was highly disorganized in the kidneys of p53-deficient mice, and the epithelial cells lining the cysts showed a paradoxical increase in B2R staining, whereas the surrounding tubules showed faint immunoreactivity (Figure 8, e and f).
Discussion
The results of the present study strongly implicate the tumor suppressor protein, p53, in terminal renal epithelial cell differentiation. p53 is enriched in renal epithelial cells expressing genes that encode receptors for vasoactive hormones, tubular transporters, and water channels. The promoters of these RFGs are strongly activated by p53. Moreover, binding of endogenous p53 to RFG promoters is selectively activated during the differentiation process. Finally, inhibition of p53 function in cultured renal epithelial cells using a DN approach suppresses endogenous expression of RFGs, while p53 gene inactivation in mice impairs the final steps of kidney development. Our in vitro data indicate that p53 is both sufficient and required for RFG expression in cultured renal epithelial cells. However, the presence of basal RFG expression in the noncystic epithelium of p53-null mice indicates that, in vivo, p53 is sufficient but not required for basal RFG expression.
The enrichment of p53 in the DZ of the developing kidney is compatible with the known functions of p53 in cell cycle control. The p53-dependent G1 phase arrest is mainly the result of transactivation of the cyclin-dependent kinase inhibitor gene p21Waf1/Cip1 (34). In another checkpoint response pathway, p21 binds to PCNA to block its activity, slowing down the rate of DNA synthesis (35). Studies in p53-deficient mice have shown that expression of p21 in various tissues during development occurs in the absence of p53 (36, 37). Therefore, loss of differentiation in p53-null kidneys cannot be explained by p21 deficiency. An alternative mechanism may involve activation (reversal of repression) of proliferation-promoting genes such as cyclin B, CDC2, telomerase, and PCNA. High levels of p53 have been shown to repress the promoters of these genes (38–41). In support of this hypothesis, we found that PCNA expression, which is normally restricted to the NZ, extends into the DZ of p53-null kidneys. Moreover, in transient-transfection assays, high levels of p53 repress the PCNA promoter (Z. Saifudeen et al., unpublished observations). Evidence for a role of p53 in the negative regulation of renal cell proliferation also comes from the observation that transgenic mice overexpressing p53 have renal hypoplasia (42). Conversely, p53 inactivation produces specific defects in embryonic development of Xenopus embryos (43). Accordingly, p53 activity must be kept under tight control for normal development to be completed.
What are the mechanisms directing the differentiation-specific expression of p53 in the renal cortex? Although the findings of this study do not allow us to fully answer this question, we propose several hypotheses. One possibility may involve loss of transcriptional repression. As demonstrated in this study, Pax-2 and p53 exhibited complementary distribution patterns within the NZ and DZ, respectively. The transcription factor Pax-2 is overexpressed in tumors and in renal progenitor cells and has been shown to repress the p53 promoter in transient-transfection assays (31). Accordingly, Pax-2 may restrict the spatial expression of p53 through transcriptional repression. However, the presence of small amounts of p53 in the renal stroma at the cortex and in S-shaped bodies suggests that Pax-2 may not be sufficient to fully repress p53 in the NZ, and other factors may be involved as well. Another mechanism may involve the posttranslational stabilization of the p53 protein via developmentally regulated phosphorylation/acetylation or by inactivation of its inhibitor, MDM2. Ongoing studies in our laboratory are exploring these possibilities.
The renal phenotype we observed in p53-null pups is compatible with aberrant terminal differentiation resulting in persistent and ectopic proliferation, tubular dysgenesis, and abnormal spatial expression of differentiation markers such as RFGs. The renal cysts observed in p53–/– pups resembled those observed in multicystic dysplasia or congenital hydronephrosis. The abnormalities in kidney development (e.g., cysts) were sometimes apparent on gross examination of the kidneys. To our knowledge, this renal phenotype has not been reported in p53-null mice. It is not clear why previous studies failed to mention this phenotype, since the changes in renal morphology are not subtle. Of course, the prevalence and penetrance of the renal dysgenesis may be dependent on the genetic background of p53–/– mice. It is worth emphasizing here that evaluations of the endogenous expression of RFGs in p53-deficient mice are complicated by the presence of dysplasia and de-differentiation, which may be associated with activation of parallel or alternative regulatory pathways. This may explain why the cystic epithelium in p53–/– pups expresses high levels of B2R. The polarization defect that leads to luminal expression of Na,K-ATPase-α1 (which pumps Na+ into the cyst), the downregulation of AQP-2 (which impedes vasopressin-driven water absorption), and increased B2R (which enhances Na+ and water excretion) are expected to promote salt and water accumulation within the tubular lumen leading to progressive cyst expansion.
A paradigm for p53-mediated regulation of terminal renal epithelial differentiation.
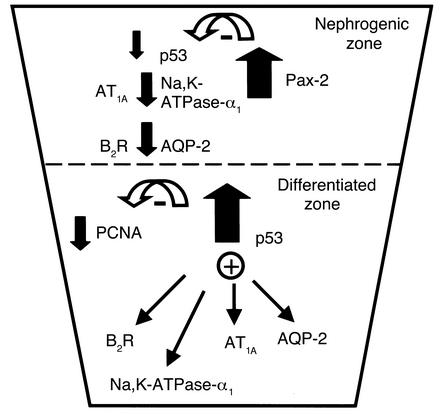
Transcription factors that are used during the differentiation process may also be used to activate the genes for that cell type’s specific products. We propose that differentiating renal epithelial cells are programmed to express increasing levels of p53, which in turn stimulate the terminal differentiation program and RFG expression (Figure 9). Once terminal differentiation is achieved and the animal has matured in a nonstressed environment, p53 activity decreases, and other factors must assume the responsibility for maintenance of the differentiated phenotype. It is important to point out that since p53 is expressed along the entire length of the differentiating nephron, p53 is unlikely to regulate nephron patterning. Rather, we believe that p53’s main action is to promote the specification of terminal differentiation. Moreover, since p53 levels/activity decrease with aging, p53 may not be a maintenance factor for the differentiated epithelial phenotype. This does not rule out a possible role during the redifferentiation process following injury. Finally, the activation of RFGs by p53 appears to be a selective transcriptional event, since a family member (p73) failed to activate the RFG promoters.
Figure 9.
Diagram of p53-mediated terminal renal epithelial cell differentiation.
The significance of p53-mediated regulation of RFGs may extend beyond the regulation of terminal differentiation. For example, a recent study demonstrated that p53 is activated in response to salt stress in the kidney epithelial cell line IMCD3, suggesting that p53 activation represents a stress-induced pathway that responds to environmental cues in vivo (44). Since the angiotensin and bradykinin receptors, water channels, and the sodium pump are functionally required for normal blood volume homeostasis, it is possible that individuals harboring loss- or gain-of-function mutations in p53 are predisposed to abnormalities in salt balance and blood pressure. In this regard, it is intriguing that human hypertensive patients are at an increased risk of cancer, including renal cancer (45, 46).
Acknowledgments
We thank G. Morris (Tulane University) for generous contributions of reagents and cell lines. We are grateful to Qais Al-Awqati and Ariel Gomez for critical review of the manuscript. Digital images were obtained at the Centralized Tulane Imaging Center. This work is supported by NIH grant RO1 DK-56264. Z. Saifudeen is supported by NIH National Research Service Award 1 F32 DK-61137.
References
- 1.Zhu L, Skoutchi AI. Coordinating cell proliferation and differentiation. Curr Opin Genet Dev. 2001;11:91–97. doi: 10.1016/s0959-437x(00)00162-3. [DOI] [PubMed] [Google Scholar]
- 2.Vousden KH. p53: death star. Cell. 2000;103:691–694. doi: 10.1016/s0092-8674(00)00171-9. [DOI] [PubMed] [Google Scholar]
- 3.Ko LJ, Prives C. p53: puzzle and paradigm. Genes Dev. 1996;10:1054–1072. doi: 10.1101/gad.10.9.1054. [DOI] [PubMed] [Google Scholar]
- 4.Oren M. Regulation of the p53 tumor suppressor protein. J Biol Chem. 1999;274:36031–36034. doi: 10.1074/jbc.274.51.36031. [DOI] [PubMed] [Google Scholar]
- 5.Almog N, Rotter V. Involvement of p53 in cell differentiation and development. Biochim Biophys Acta. 1997;133:F1–F27. doi: 10.1016/s0304-419x(97)00012-7. [DOI] [PubMed] [Google Scholar]
- 6.Choi J, Donehower LA. p53 in embryonic development: maintaining a fine balance. Cell Mol Life Sci. 1999;55:38–47. doi: 10.1007/s000180050268. [DOI] [PMC free article] [PubMed] [Google Scholar]
- 7.Rogel A, Popliker M, Webb CG, Oren M. p53 cellular tumor antigen: analysis of mRNA levels in normal adult tissues, embryos, and tumors. Mol Cell Biol. 1985;5:2851–2855. doi: 10.1128/mcb.5.10.2851. [DOI] [PMC free article] [PubMed] [Google Scholar]
- 8.Louis JM, McFarland VW, May P, Mora PT. The phosphoprotein p53 is down-regulated post-transcriptionally during embryogenesis in vertebrates. Biochim Biophys Acta. 1988;950:395–402. doi: 10.1016/0167-4781(88)90136-4. [DOI] [PubMed] [Google Scholar]
- 9.Schmid P, Lorenz A, Hameister H, Montenarh M. Expression of p53 during mouse embryogenesis. Development. 1991;113:857–865. doi: 10.1242/dev.113.3.857. [DOI] [PubMed] [Google Scholar]
- 10.Komarova EA, et al. Transgenic mice with p53-responsive lacZ: p53 activity varies dramatically during normal development and determines radiation and drug sensitivity in vivo. EMBO J. 1997;16:1391–1400. doi: 10.1093/emboj/16.6.1391. [DOI] [PMC free article] [PubMed] [Google Scholar]
- 11.Gottlieb E, et al. Transgenic mouse model for studying the transcriptional activity of the p53 protein: age- and tissue-dependent changes in radiation-induced activation during embryogenesis. EMBO J. 1997;16:1381–1390. doi: 10.1093/emboj/16.6.1381. [DOI] [PMC free article] [PubMed] [Google Scholar]
- 12.Leveillard T, Gorry P, Niederreither K, Wasylyk B. MDM2 expression during mouse embryogenesis. Mech Dev. 1998;74:189–193. doi: 10.1016/s0925-4773(98)00074-4. [DOI] [PubMed] [Google Scholar]
- 13.Donehower LA, et al. Mice deficient for p53 are developmentally normal but susceptible to spontaneous tumours. Nature. 1992;356:215–221. doi: 10.1038/356215a0. [DOI] [PubMed] [Google Scholar]
- 14.Jacks T, et al. Tumor spectrum analysis in p53-mutant mice. Curr Biol. 1994;4:1–7. doi: 10.1016/s0960-9822(00)00002-6. [DOI] [PubMed] [Google Scholar]
- 15.Dey DC, Bronson RP, Dahl J, Carroll JP, Benjamin TL. Accelerated development of polyoma tumors and embryonic lethality: different effects of p53 loss on related mouse backgrounds. Cell Growth Differ. 2000;11:231–237. [PubMed] [Google Scholar]
- 16.Sah VP, et al. A subset of p53-deficient embryos exhibit exencephaly. Nat Genet. 1995;10:175–180. doi: 10.1038/ng0695-175. [DOI] [PubMed] [Google Scholar]
- 17.Armstrong JF, Kaufman MH, Harrison DJ, Clarke AR. High-frequency developmental abnormalities in p53-deficient mice. Curr Biol. 1995;5:931–936. doi: 10.1016/s0960-9822(95)00183-7. [DOI] [PubMed] [Google Scholar]
- 18.Mills AA, et al. p63 is a p53homologue required for limb and epithelial morphogenesis. Nature. 1999;398:708–713. doi: 10.1038/19531. [DOI] [PubMed] [Google Scholar]
- 19.Yang A, et al. p63 is essential for regenerative proliferation in limb, craniofacial and epithelial development. Nature. 1999;398:714–718. doi: 10.1038/19539. [DOI] [PubMed] [Google Scholar]
- 20.Pozniak CD, et al. An anti-apoptotic role for the p53 family member, p73, during developmental neuron death. Science. 2000;289:304–306. doi: 10.1126/science.289.5477.304. [DOI] [PubMed] [Google Scholar]
- 21.Yu J, et al. Identification and classification of p53-regulated genes. Proc Natl Acad Sci USA. 1999;96:14517–14522. doi: 10.1073/pnas.96.25.14517. [DOI] [PMC free article] [PubMed] [Google Scholar]
- 22.Maxwell SA, Davis GE. Differential gene expression in p53-mediated apoptosis-resistant vs. apoptosis-sensitive tumor cell lines. Proc Natl Acad Sci USA. 2000;97:13009–13014. doi: 10.1073/pnas.230445997. [DOI] [PMC free article] [PubMed] [Google Scholar]
- 23.Zhao R, et al. Analysis of p53-regulated gene expression patterns using oligonucleotide arrays. Genes Dev. 2000;14:981–993. [PMC free article] [PubMed] [Google Scholar]
- 24.Saifudeen Z, Du H, Dipp S, El-Dahr SS. The bradykinin type 2 receptor is a target for p53-mediated transcriptional activation. J Biol Chem. 2000;275:15557–15562. doi: 10.1074/jbc.M909810199. [DOI] [PubMed] [Google Scholar]
- 25.Shul MM, Pugh DG, Lingrel JB. The human Na,K-ATPase α-1 gene: characterization of the 5′-flanking region and identification of a restriction fragment length polymorphism. Genomics. 1990;6:451–460. doi: 10.1016/0888-7543(90)90475-a. [DOI] [PubMed] [Google Scholar]
- 26.Takeuchi K, Alexander RW, Nakamura Y, Tsujino T, Murphy TJ. Molecular structure and transcriptional function of the rat vascular AT1aangiotensin receptor gene. Circ Res. 1993;73:612–621. doi: 10.1161/01.res.73.4.612. [DOI] [PubMed] [Google Scholar]
- 27.Barasch J, et al. Mesenchymal to epithelial conversion in rat metanephros is induced by LIF. Cell. 1999;99:377–386. doi: 10.1016/s0092-8674(00)81524-x. [DOI] [PubMed] [Google Scholar]
- 28.Phelps DE, Dressler GR. Identification of novel Pax-2 binding sites by chromatin precipitation. J Biol Chem. 1996;271:7978–7985. doi: 10.1074/jbc.271.14.7978. [DOI] [PubMed] [Google Scholar]
- 29.El-Dahr SS, Figueroa CD, Gonzalez CB, Müller-Esterl W. Ontogeny of bradykinin B2receptors in the rat kidney: implications for segmental nephron maturation. Kidney Int. 1997;51:739–749. doi: 10.1038/ki.1997.105. [DOI] [PubMed] [Google Scholar]
- 30.El-Dahr SS, Dipp S, Baricos WH. Bradykinin stimulates the ERK-Elk1-Fos/AP-1 pathway in mesangial cells. Am J Physiol. 1998;275:F343–F352. doi: 10.1152/ajprenal.1998.275.3.F343. [DOI] [PubMed] [Google Scholar]
- 31.Stuart ET, Haffner R, Oren M, Gruss P. Loss of p53 function through PAX-mediated transcriptional repression. EMBO J. 1995;14:5638–5645. doi: 10.1002/j.1460-2075.1995.tb00251.x. [DOI] [PMC free article] [PubMed] [Google Scholar]
- 32.El-Deiry WS, Kern SE, Pietenpol JA, Kinzler KW, Vogelstein B. Definition of a consensus binding site for p53. Nat Genet. 1992;1:45–49. doi: 10.1038/ng0492-45. [DOI] [PubMed] [Google Scholar]
- 33.Funk WD, Pak DT, Karas RH, Wright WE, Shay JW. A transcriptionally active DNA-binding site for human p53 protein complexes. Mol Cell Biol. 1992;12:2866–2871. doi: 10.1128/mcb.12.6.2866. [DOI] [PMC free article] [PubMed] [Google Scholar]
- 34.El-Deiry W, et al. WAF1, a potential mediator of p53tumour suppression. Cell. 1993;75:817–825. doi: 10.1016/0092-8674(93)90500-p. [DOI] [PubMed] [Google Scholar]
- 35.Waga S, Hannon GJ, Beach D, Stillman B. The p21 inhibitor of cyclin-dependent kinases controls DNA replication by interaction with PCNA. Nature. 1994;369:574–578. doi: 10.1038/369574a0. [DOI] [PubMed] [Google Scholar]
- 36.Macleod KF, et al. p53-dependent and independent expression of p21 during cell growth, differentiation, and DNA damage. Genes Dev. 1995;9:935–944. doi: 10.1101/gad.9.8.935. [DOI] [PubMed] [Google Scholar]
- 37.Deng C, Zhang P, Harper JW, Elledge SJ, Leder P. Mice lacking p21CIP1/WAF1undergo normal development, but are defective in G1 checkpoint control. Cell. 1995;82:675–684. doi: 10.1016/0092-8674(95)90039-x. [DOI] [PubMed] [Google Scholar]
- 38.Taylor WR, Schönthal AH, Galante J, Stark GR. p130/E2F4 binds to and represses the cdc2promoter in response to p53. J Biol Chem. 2001;276:1998–2006. doi: 10.1074/jbc.M005101200. [DOI] [PubMed] [Google Scholar]
- 39.Xu D, et al. Downregulation of telomerase reverse transcriptase mRNA expression by wild type p53 in human tumor cells. Oncogene. 2000;19:5123–5133. doi: 10.1038/sj.onc.1203890. [DOI] [PubMed] [Google Scholar]
- 40.Mercer WE, Shields MT, Lin D, Appella E, Ullrich SJ. Growth suppression induced by wild-type p53 protein is accompanied by selective down-regulation of proliferating-cell nuclear antigen expression. Proc Natl Acad Sci USA. 1991;88:1958–1962. doi: 10.1073/pnas.88.5.1958. [DOI] [PMC free article] [PubMed] [Google Scholar]
- 41.Chang H-W, et al. UV inducibility of rat proliferating cell nuclear antigen gene promoter. J Cell Biochem. 1999;73:423–432. [PubMed] [Google Scholar]
- 42.Godley LA, et al. Wild-type p53transgenic mice exhibit altered differentiation of the ureteric bud and possess small kidneys. Genes Dev. 1996;10:836–850. doi: 10.1101/gad.10.7.836. [DOI] [PubMed] [Google Scholar]
- 43.Wallingford JB, Seufert DW, Virta VC, Vize PD. p53 activity is essential for normal development in Xenopus. Curr Biol. 1997;7:747–757. doi: 10.1016/s0960-9822(06)00333-2. [DOI] [PubMed] [Google Scholar]
- 44.Dmitrieva N, Kültz D, Michea L, Ferraris J, Burg M. Protection of renal inner medullary epithelial cells from apoptosis by hypertonic stress-induced p53 activation. J Biol Chem. 2000;275:18243–18247. doi: 10.1074/jbc.M000522200. [DOI] [PubMed] [Google Scholar]
- 45.Lindgren A, et al. Cancer incidence in hypertensive patients in North Karelia, Finland. Hypertension. 2001;37:1251–1255. doi: 10.1161/01.hyp.37.5.1251. [DOI] [PubMed] [Google Scholar]
- 46.Chow H-W, Gridley G, Fraumen JF, Jr, Jarvholm B. Obesity, hypertension, and the risk of kidney cancer in men. N Engl J Med. 2000;343:1305–1311. doi: 10.1056/NEJM200011023431804. [DOI] [PubMed] [Google Scholar]
