Spatial order within but not between types of retinal neurons (original) (raw)
Abstract
We studied the mosaics of six types of retinal neurons, asking how the position of a cell relates to the positions of other cells of that same type and also to cells of different types. Every neuron studied was found to be nonrandomly positioned: Cells of a particular type were evenly spaced. However, all cells were positioned randomly with respect to members of the other cell classes. This was true even when the cells were known to be synaptically connected. It is consistent with a concept of developmental pattern formation in which (i) the number of cells of a particular type and their laminar distribution are specified, and (ii) the final spatial position of each cell is controlled exclusively by a rule that prevents cells of the same type from being positioned close to each other. This sequence would imply that a cell's final position is independent of the cell's position at the time of its specification, and we suggest a reason why, in laminar structures containing many cell types, it might be desirable for this to be so.
It is self-evident that the number of neurons within a structure of the central nervous system is developmentally regulated and that their spacing must not be entirely random. This is nowhere more striking than in the retina, where some classes of neurons are positioned with almost crystalline regularity. The need for this orderliness is evident from the fundamental nature of the tissue. The retina consists of an array of microcircuits arranged in a sheet. These must sample every part of the visual scene. The most efficient arrangement is for each functional element of the retina to survey each point in the world at least once, but only once. If the cells were randomly positioned, an array containing occasional clumps of cells and occasional extrawide spacings would result. The clumps would represent redundancy, and the spaces would represent lacunae in the vision of the animal. Pioneering studies by Wässle and his colleagues (see review in ref. 1) demonstrated orderly spacing for cone photoreceptors, A-type horizontal cells, alpha ganglion cells, and beta ganglion cells. The principle has since been confirmed for many other types of retinal neurons (see review in ref. 1). Regular spacing can be established remarkably early in development. Retinal cones can form an orderly array well before synaptogenesis (2, 3). The starburst (cholinergic) amacrine cells of the rat retina form a regular mosaic as early as the first postnatal day, a time when new starburst cells are still migrating toward their final laminar destination. The new starburst cells migrate laterally to achieve regular spacing of the eventual adult mosaic. This migration requires the existence of a mechanism for active control of the final position of the differentiated cells (4).
Less is known about the spatial ordering of members of one retinal cell type relative to other types. Displaced starburst cells (those located in the ganglion cell layer) are randomly positioned relative to starburst cells located in the inner nuclear layer, as are ON and OFF versions of the alpha and beta types of ganglion cells (5–7), but these comparisons are within single types of cells. With the advent of multiple labeling techniques and digital microscopy, it becomes practical to study the positioning of cells of different types. We began with the expectation that the cell bodies of synaptically related cells would have a systematic spatial relationship, perhaps forming some sort of column or module. Instead, we found the spacings of every population studied to be random with respect to the others.
Materials and Methods
Retinas were removed from the enucleated eyes of adult (≈2 kg) New Zealand White rabbits. Surgery was performed on rabbits under deep anesthesia with a combination of ketamine and xylazine. After the eye had been removed, the animal was killed by an overdose of the same anesthetics. All procedures were in accordance with institutional guidelines. The isolated retinas were fixed in 4% paraformaldehyde for 1 h, rinsed in 0.1 M phosphate buffer, and stained intact as whole mounts.
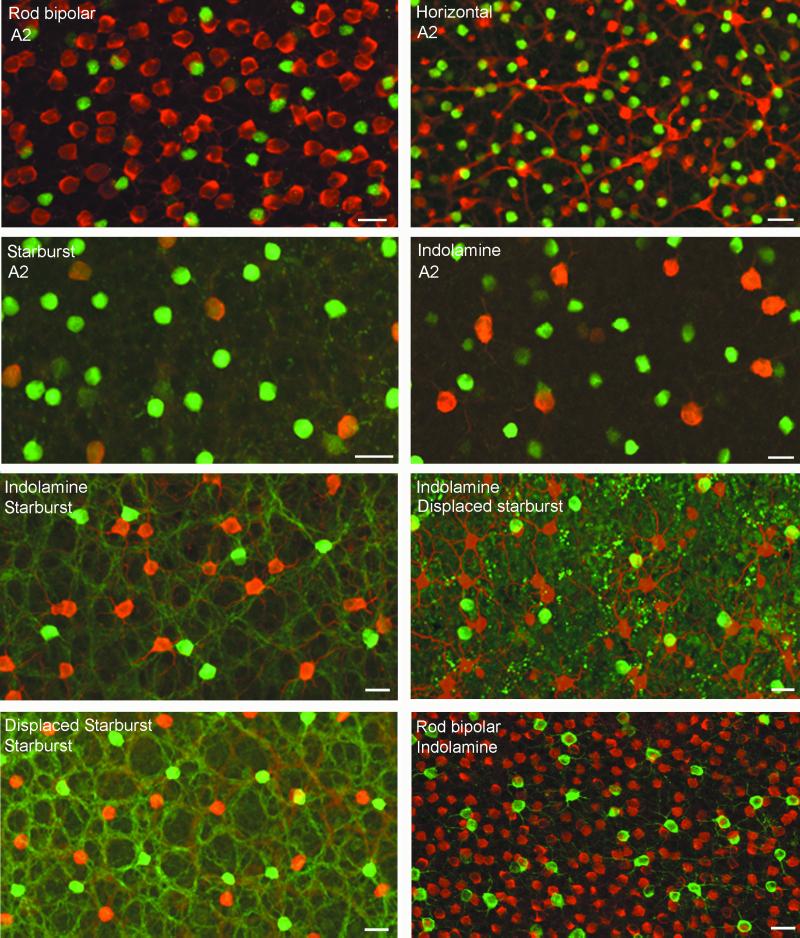
The immunohistochemical methods were conventional (8), with incubation for 4 days in primary antibody solution and 1 day in secondary solution. The primary antibodies were: A2, anti-parvalbumin (Sigma); starburst, anti-ChAT (Chemicon); indoleamine cells, anti-serotonin (Incstar, Stillwater, MN); horizontal cells, anti-calbindin (Sigma); and rod bipolar cells, anti-Protein Kinase C (Chemicon). For the indoleamine-accumulating cells, the retinas were preincubated in serotonin (2 μM for 1 h) as described (9). Depending on the pairings of cells, immunostaining was visualized with a combination of FITC for one member of the pair and tetramethylrhodamine isothiocynate for the other (Fig. 1)
Figure 1.
Staining pairs of cell populations in retinal whole mounts. With one exception, the two members of a cell pair were imaged separately by using FITC (green) and tetramethylrhodamine isothiocynate (red). The images were then superimposed. The cell type listed first in each caption was labeled with tetramethylrhodamine isothiocynate (red) and the second with FITC (green). The exception was the comparison of the positions of orthotopic and displaced starburst cells, which had to be stained with a single antibody. The two populations were resolved by their different focal depth and the displaced cells arbitrarily colored red. (Bar = 20 μm.)
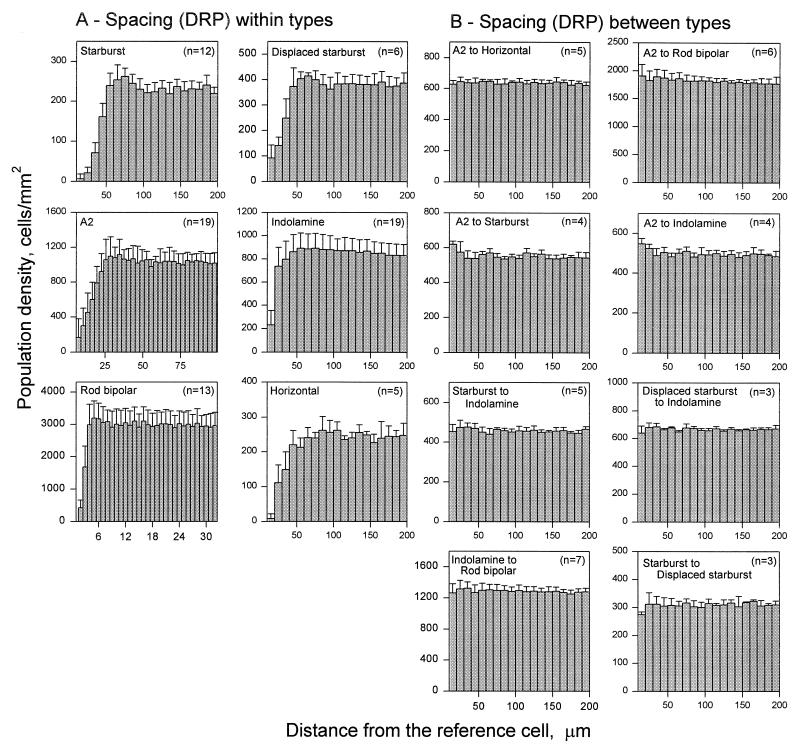
Digital images of each field were collected on a conventional (Zeiss, axioskop) or a confocal microscope (Bio-Rad, MRC-1024). For each comparison, the area studied was determined by the least dense population. The field size always contained at least 300 cells, and some had as many as 7,000. The number of fields for each comparison is given in Fig. 2. The positions of the cells were measured by using sigmascan (Jandel, San Rafael, CA) software from digital images of large fields stained as shown in Fig. 1. Distances between cells were measured by a computer program similar to the one described by Rodieck (10). A cell was taken as the reference cell and the distance from that cell to every other cell in the field was measured. The procedure was repeated with each cell in the field taken as the reference cell. The results were binned (in effect, creating synthetic annuli around the reference cell), the overall density of cells at each distance from the reference cell was measured, and the density recovery profile (DRP) was constructed. In general, the cells were binned at 10-μm intervals. The results for the rod bipolar cells and A2 amacrines were binned at 2.5 μm because their higher density requires higher resolution of their spacing. The first bin of the DRP histogram contains distances smaller than the diameter of the soma of a cell. Because of steric hinderance effects, this bin is expected to be empty for within-layer comparisons. However, because of small digitizing errors, it sometimes contains nonzero values. For between-type comparisons, the value of the first bin was always within one standard deviation from the mean. Thus, the first bin was omitted in all histograms in Fig. 2.
Figure 2.
DRPs (10) for six types of retinal neurons. (A) The spacings of cells with respect to other cells of the same type. (B) Spacings of these cells with respect to cells of different types. The error bars show the standard deviation of the means.
To study whether a spatial relationship among cells of two populations with regular cell mosaics but different densities can be detected in DRPs, a simple computer model was implemented (mathworks matlab version 5.3, Mathworks, Natick, MA). At the start of each simulation, two populations (with realistic cell densities) of randomly positioned cells were superimposed on a 500 × 500-μm field. For simplicity, cells from different populations were allowed to overlap (this is equivalent to cell types being located in different tiers of the inner nuclear layer). For each cell, a movement vector was calculated depending on the distance and the position relative to neighboring cells. Within a population, cells were made to “repel” each other. In the first simulation, the two cell populations did not interact. In the second simulation, cells from different populations attracted each other. After all vectors were evaluated, the cells assumed their new positions and the calculation was repeated until the mean vector (estimated error) for each population was smaller than 0.6 μm. The following function determined the length |vij| of the movement vector between two cells (i and j): |vij| = g ( − 1), with the gain g (>0 for repulsion, <0 for attraction), the distance D of the cell, and the maximal distance, _D_Max, within the cells affect each other. (For further details, see http://retina.mgh.harvard.edu.)
The DRP describes the spatial autocorrelation within a single population of cells, or the crosscorrelation between two types of cells. Nearest neighbor analysis (11) led to the same conclusions as the DRP, but nearest neighbor metrics are sensitive to the absolute density of the cells (12) and will not be presented here.
Results
Six populations of cells were studied, chosen because they include a cross section of types and have robust histochemical markers. When two populations were stained, contrasting fluorochromes were used (Fig. 1). The cells studied were: horizontal cells, rod bipolar cells, A2 amacrine cells, indoleamine-accumulating cells (a population of amacrine cells that express an indoleamine transporter), regular starburst cells (positioned in the amacrine cell layer), and displaced starburst cells (positioned in the ganglion cell layer).
Low-power images were collected for fields of stained cells at mid-peripheral retinal eccentricities, 6–11 mm from the visual streak. A total of 74 fields were analyzed. For each, the DRP, a measure of the regularity of the cell spacing, was computed (10).
Fig. 2A shows the spacing of each cell type taken by itself. As reported for each of these cells, the mosaics are regular: The DRP for each population shows a trough for near distances, indicating that the presence of a cell lowers the probability that another cell of the same type will be located nearby. Fig. 2B shows the relationships when distances between cells of one type and cells of another type were compared. The positions of cells of different types with respect to each other appeared entirely random.
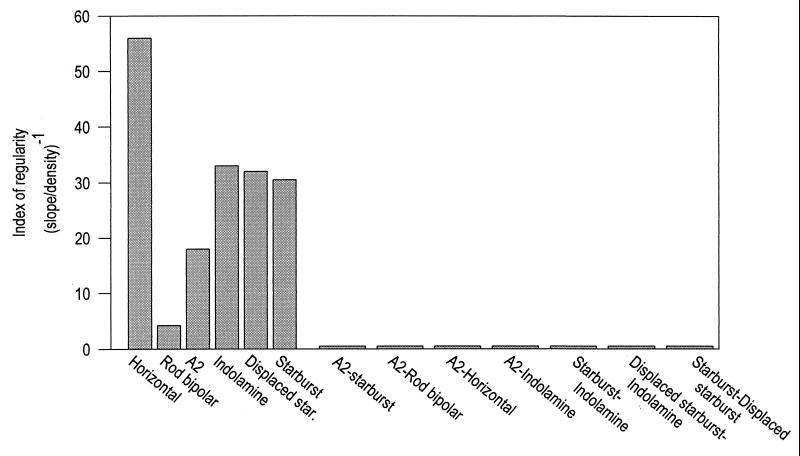
To quantify this difference, we computed a simple index of the degree of regularity. In DRPs, regularity is indicated by distance from the reference cell required for the probability of encountering another cell to reach its asymptotic (chance) value. Because the form of the rise varies somewhat from one cell type to another, we made a simple linear measurement and used the slope in calculating an index. We measured the mean density for the last 10 bins (the right-hand half of each profile shown in Fig. 2) and measured the slope of a line from the origin to the first bin that equaled or exceeded that value. This is a measure of the extent to which cells are excluded from near distances (their tendency to “repel” each other). In the DRPs shown in Fig. 2, this is the distance from the origin (the reference cell) required for the density to reach its final mean value. This value was then divided by the density of the cell population to correct for the fact that numerous cells necessarily have shorter intercell distances than do scarcer ones, and its reciprocal was plotted (Fig. 3). The difference between the within-type and between-type spatial regularity is dramatic.
Figure 3.
The quantitative index of spatial ordering within and between cell types. The index approximates the tendency of the cells to “repel” each other, i.e., the rate of rise of the density profiles shown in Fig. 2B. The denser populations appear to be less regular than the less dense ones, possibly because of positional hindrances introduced when the somata of a population (and its unrelated neighbors) occupy a significant fraction of the mean intersoma distance. For present purposes, though, this is incidental. The central point is that all of the individual populations were regular and none of the between-population comparisons were. In fact, for the between-type comparisons, the mean density was attained at the nearest measured interval so that the slope of the rise was technically infinite.
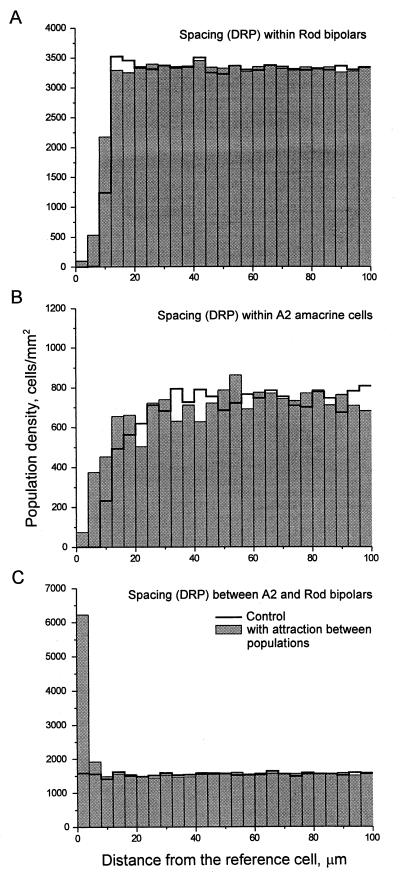
Is it theoretically possible for populations that have different densities to have crosscorrelated DRPs? They clearly could if their densities were integral multiples of each other, but in other cases, the answer is not intuitively obvious. We therefore performed a computer simulation that used two synthetic populations with the densities of rod bipolar and A2 amacrine cells. We gave each population, taken individually, a repulsion rule such that it achieved a DRP similar to that of the actual cell populations shown in Fig. 2A. We then added a second rule requiring that the two simulated populations attract each other. In effect, the simulation asked if it is possible for these two populations to be regularly spaced with respect to themselves and at the same time exhibit positional regularity with respect to each other. The answer, shown in Fig. 4, was that the two populations are able to attract each other strongly while still maintaining their own even spacing.
Figure 4.
Simulated populations of rod bipolar cells and A2 amacrine cells. DRPs, like those of Fig. 2, generated under specified rules of spacing, are shown. The shaded bars illustrate the results when cells of the same type were caused to repel each other but cells of different types attracted each other (see text). The unshaded profile shows the DRPs that resulted when the attraction rule was omitted. Results are the means of three simulation runs. Averaged standard deviations for A and C were smaller than 5.1% of the means; for B, they were smaller than 11.5%.
Discussion
These findings show that retinal neurons of differing functional types are positioned randomly with respect to each other. In this statement, retinal cell “types” are narrowly defined. Not only was a bipolar cell random with respect to amacrine cells, but different types of amacrine cells were random with respect to each other.
This was true even when a pair of cells is known to be synaptically connected; A2 amacrine cells receive their major synaptic input from rod bipolar cells (13), as do the indoleamine-accumulating cells (14), yet the positions of their cell bodies were random with respect to the rod bipolars and random with respect to each other.
This simple but exceptionally clear result raises a puzzle for developmental pattern formation. How do the positions of the cells become random with respect to each other? The issue arises because the different types of retinal neurons are almost certainly specified by inductive events, in which molecular signals from one cell specify the identities of surrounding cells (15–19). Unavoidable in such a mechanism is some degree of spatial patterning. It does not matter what method of cell–cell communication is used. Cell surface proteins might contact each other directly. Alternatively, the cells might secrete diffusable factors that singly or in combination determine the phenotypic choice of more distant cells. Both would create orderly arrays of neurons locally and a traveling wave of differentiation (20, 21) would create a repeating pattern of cell types, like the unrolling of a patterned carpet. Put in more general terms, the paradox is that any deterministic developmental mechanism should always create spatial orderings among the cells, at least at the time of initial specification.
Perhaps, in a system that must create 50 or so cell types, spatial position needs by design to be independent of the events by which the cells are originally specified. The cells might be initially specified by inductive events but then be free to migrate to positions controlled only by layering and a rule requiring regular spacing of cells of the same type (4, 22, 23). This would be a simple way to ensure even coverage of the retina by each cell type. It would also eliminate a problem that would occur in the actual case where there are not one but several waves of differentiation (20, 21), each involving different populations of retinal neurons. Several waves (unrolling several patterned carpets on top of each other) would create aliasing among the patterns, so that patches of retina would end up rich in certain cell combinations and poor in others.
Whereas positional independence of cell populations seems to occur very often, there are exceptions. The spectral types of cones in goldfish (but not mammals) are systematically arranged with respect to each other (24). In monkeys, the blue cones and blue cone bipolars are positioned closer to each other than would be expected by chance (25). It is notable that in the second case, the cells are sparse but are synaptically connected and that those cells develop under shared transcriptional control (26, 27).
Abbreviation
DRP
density recovery profile
Footnotes
This paper was submitted directly (Track II) to the PNAS office.
Article published online before print: Proc. Natl. Acad. Sci. USA, 10.1073/pnas.030413497.
References
- 1.Wässle H, Boycott B B. Physiol Rev. 1991;71:447–480. doi: 10.1152/physrev.1991.71.2.447. [DOI] [PubMed] [Google Scholar]
- 2.Rapaport D H, Rakic P, LaVail M M. Perspect Dev Neurobiol. 1996;3:147–159. [PubMed] [Google Scholar]
- 3.Raymond P A, Barthel L K, Curran G A. J Comp Neurol. 1995;359:537–550. doi: 10.1002/cne.903590403. [DOI] [PubMed] [Google Scholar]
- 4.Galli-Resta L, Resta G, Tan S-S, Reese B E. J Neurosci. 1997;17:7831–7838. doi: 10.1523/JNEUROSCI.17-20-07831.1997. [DOI] [PMC free article] [PubMed] [Google Scholar]
- 5.Rodieck R, Marshak D W. J Comp Neurol. 1992;321:46–64. doi: 10.1002/cne.903210106. [DOI] [PubMed] [Google Scholar]
- 6.Wässle H, Boycott B B, Illing R B. Proc R Soc London B. 1981;212:177–195. doi: 10.1098/rspb.1981.0033. [DOI] [PubMed] [Google Scholar]
- 7.Wässle H, Peichl L, Boycott B B. Proc R Soc London B. 1981;212:157–175. doi: 10.1098/rspb.1981.0032. [DOI] [PubMed] [Google Scholar]
- 8.Strettoi E, Masland R H. J Neurosci. 1995;15:875–888. doi: 10.1523/JNEUROSCI.15-01-00875.1995. [DOI] [PMC free article] [PubMed] [Google Scholar]
- 9.Sandell J H, Masland R H. J Neurosci. 1986;251:388–397. [Google Scholar]
- 10.Rodieck R W. Visual Neurosci. 1991;6:95–111. doi: 10.1017/s095252380001049x. [DOI] [PubMed] [Google Scholar]
- 11.Wässle H, Riemann H J. Proc R Soc London B. 1978;200:441–461. doi: 10.1098/rspb.1978.0026. [DOI] [PubMed] [Google Scholar]
- 12.Cook J E. Visual Neurosci. 1996;13:15–30. doi: 10.1017/s0952523800007094. [DOI] [PubMed] [Google Scholar]
- 13.Strettoi E, Raviola E, Dacheux R F. J Comp Neurol. 1992;325:152–168. doi: 10.1002/cne.903250203. [DOI] [PubMed] [Google Scholar]
- 14.Sandell J H, Masland R H, Raviola E, Dacheux R F. J Comp Neurol. 1989;283:303–313. doi: 10.1002/cne.902830210. [DOI] [PubMed] [Google Scholar]
- 15.Turner D L, Snyder E Y, Cepko C L. Neuron. 1990;4:833–845. doi: 10.1016/0896-6273(90)90136-4. [DOI] [PubMed] [Google Scholar]
- 16.Harris W A, Messersmith S L. Neuron. 1992;9:357–372. doi: 10.1016/0896-6273(92)90174-c. [DOI] [PubMed] [Google Scholar]
- 17.Greenwald I, Rubin G M. Cell. 1992;68:271–281. doi: 10.1016/0092-8674(92)90470-w. [DOI] [PubMed] [Google Scholar]
- 18.Heberlein U, Moses K. Cell. 1995;81:987–990. doi: 10.1016/s0092-8674(05)80003-0. [DOI] [PubMed] [Google Scholar]
- 19.Fulwiler C, Schmitt E A, Kim J M-J, Dowling J E. J Comp Neurol. 1997;381:449–460. [PubMed] [Google Scholar]
- 20.Young R W. Anat Rec. 1985;21:199–205. doi: 10.1002/ar.1092120215. [DOI] [PubMed] [Google Scholar]
- 21.Schmitt E A, Dowling J E. J Comp Neurol. 1996;371:222–234. doi: 10.1002/(SICI)1096-9861(19960722)371:2<222::AID-CNE3>3.0.CO;2-4. [DOI] [PubMed] [Google Scholar]
- 22.Reese B E, Necessary B D, Tam P P L, Faulkner-Jones B, Tan S-S. Eur J Neurosci. 1999;11:2965–2978. doi: 10.1046/j.1460-9568.1999.00712.x. [DOI] [PubMed] [Google Scholar]
- 23.Galli-Resta L, Novelli E, Kryger Z, Jacobs G H, Reese B E. Eur J Neurosci. 1999;11:1461–1469. doi: 10.1046/j.1460-9568.1999.00555.x. [DOI] [PubMed] [Google Scholar]
- 24.Raymond P A, Barthel L K, Rounsifer M E, Sullivan S A, Knight J K. Neuron. 1993;10:1161–1174. doi: 10.1016/0896-6273(93)90064-x. [DOI] [PubMed] [Google Scholar]
- 25.Kouyama N, Marshak D W. Visual Neurosci. 1997;14:159–167. doi: 10.1017/s0952523800008841. [DOI] [PubMed] [Google Scholar]
- 26.Chiu M I, Nathans J. J Neurosci. 1994;14:3426–3436. doi: 10.1523/JNEUROSCI.14-06-03426.1994. [DOI] [PMC free article] [PubMed] [Google Scholar]
- 27.Chen J, Tucker C L, Woodford B, Szel A, Lem J, Gianella-Borradori A. Proc Natl Acad Sci USA. 1994;91:2611–2615. doi: 10.1073/pnas.91.7.2611. [DOI] [PMC free article] [PubMed] [Google Scholar]


