Human replication protein A unfolds telomeric G-quadruplexes (original) (raw)
Abstract
G-quadruplex structures inhibit telomerase activity and must be disrupted for telomere elongation during S phase. It has been suggested that the replication protein A (RPA) could unwind and maintain single-stranded DNA in a state amenable to the binding of telomeric components. We show here that under near-physiological in vitro conditions, human RPA is able to bind and unfold G-quadruplex structures formed from a 21mer human telomeric sequence. Analyses by native gel electrophoresis, cross-linking and fluorescence resonance energy transfer indicate the formation of both 1:1 and 2:1 complexes in which G-quadruplexes are unfolded. In addition, quadruplex opening by hRPA is much faster than observed with the complementary DNA, demonstrating that this protein efficiently unfolds G-quartets. A two-step mechanism accounting for the binding of hRPA to G-quadruplexes is proposed. These data point to the involvement of hRPA in regulation of telomere maintenance.
INTRODUCTION
Telomeres are specialized DNA–protein structures that protect the ends of chromosomes and distinguish natural chromosome termini from unnatural breaks produced by DNA damage (1). Alterations in telomere structure are associated with distinct cellular programs including apoptosis and unlimited proliferation indicating that telomeres play an important role in the processes of aging and cancer (2). Telomere DNA length and protein composition vary during the life of a cell, and telomere structures may involve double-stranded DNA-binding proteins (3,4), single-stranded DNA (ssDNA)-binding proteins (5–7) and DNA–DNA interactions (8). Human telomeric DNA, located at the ends of each chromosome, contains G-rich termini as relatively short single-stranded 3′ overhangs designated G-overhangs (9,10). Such single-stranded telomere DNAs have been found in protozoa, yeast and vertebrates (11–13). They are synthesized specifically by a unique ribonucleoprotein reverse transcriptase called telomerase (14,15).
It is well known that clusters of G residues may adopt non-B structures stabilized by interactions between the guanine bases under in vitro physiological conditions [for a review see (16)]. These structures are four-stranded DNA complexes where layers of four guanine bases, one from each strand, are bound by Hoogsteen hydrogen bonds, thereby forming stacked G-quartets that hold the chains together. Therefore, it is conceivable that these G-quadruplex structures may occur in living cells (17,18) and affect essential cellular processes, such as recombination and extension of telomeric sequences by the telomerase (19).
It has been suggested that cells might possess a mechanism allowing them to resolve these structures into single strands, thereby providing the best opportunity for telomerase access to the 3′ end of a chromosome (14). Replication protein A (RPA) was shown recently to be present at the telomeric ends of chromosomes with maximum association in the S phase and to play an essential role in telomere maintenance (7). Schramke et al. (20) proposed that RPA activates the telomerase via its p32 subunit, by maintaining ssDNA in a state amenable to the binding of telomeric components. In addition, Cohen et al. (21) showed that in an in vitro system, low concentrations of human RPA (hRPA) stimulate extension of G-rich DNA primers by the telomerase (although high concentrations are inhibitory) and proposed a mechanism of unwinding of the unusual structures formed between G residues.
RPA is an ssDNA-binding protein (ssDBP) that is highly conserved in eukaryotes (22,23). hRPA is a heterotrimeric complex consisting of three subunits p70, p32 and p14, named according to their molecular masses of 70, 32 and 14 kDa, respectively. hRPA has four DNA-binding domains (A, B and C in p70 and D in p32), and it binds ssDNA via a multistep pathway (24,25).
The mechanism of ssDNA binding by the RPA involves at least three different binding modes, which are best defined by the length of the interacting ssDNA. The first mode, designated ‘compact conformation’, is characterized by an 8–10 nt occluded binding site, an intermediate, or ‘elongated contracted’ (13–14 nt) binding site, and an ‘elongated extended’ conformation characterized by a 30 nt occluded binding site (22–26). RPA plays essential roles in many aspects of nucleic acids metabolism, including replication, recombination, transcription, checkpoints and DNA repair (22). To determine the role of RPA in telomere maintenance, we have investigated the in vitro binding of hRPA under physiological conditions with an oligonucleotide based on the minimal human telomere repeat sequence capable of forming an intramolecular G-quadruplex structure.
Our data reveal that hRPA is able to bind and unfold a four-stranded intramolecular DNA quadruplex, forming at least two kinds of complexes in a multi-step mechanism. Thus, RPA may regulate the action of the telomerase during the cell cycle by opening G-quadruplex structures and maintaining them as ssDNA, thus facilitating the recruitment and binding of telomerase components onto telomeres.
MATERIALS AND METHODS
Materials
BSA was from Roche. [γ-32P]ATP (6 μCi/pmol) was from Amersham and T4 polynucleotide kinase from BioLabs. The oligonucleotides 5′-d(TTTTTTTTTTTTTTTTTTTTT)-3′(T21), 5′-d(GGGTTAGGGTTAGGGTTAGGG)-3′ (htelo),5′-d(CCCTAACCCTAACCCTAACCC)-3′ (21C), 5′-FLUO-(T21)-TAMRA-3′ (F-T21-T) and 5′-FLUO-(htelo)-TAMRA-3′(F-htelo-T) [where fluorescein (FLUO) and tetramethylrhodamine (TAMRA) are fluorescent dyes] were synthesized by Eurogentec (Seraing, Belgium). htelo and F-htelo-T oligonucleotides were based on the minimal human telomere repeat sequence capable of forming an intramolecular G-quadruplex structure. Recombinant hRPA was expressed in the Escherichia coli BL21 (DE3) (the three entire subunits p70, p32 and p14 were coexpressed with plasmid pET11ahRPA generously provided by Dr Klaus Weisshart, IMB, Jena, Germany), and purified using Affi-Gel Blue, HAP and Q-Sepharose chromatographic columns according to Gomes et al. (25). hRPA was quantified using the Bradford assay.
hRPA–htelo binding
Oligonucleotides were labeled with [γ-32P]ATP using T4 polynucleotide kinase. 32P-labeled oligonucleotides were purified using denaturing 15% PAGE. hRPA was diluted and pre-incubated (10 min at 4°C) in buffer containing 50 mM Tris–HCl (pH 7.5), 100 mM KCl, 1 mM DTT, 10% (v/v) glycerol, 0.2 mg/ml BSA and 0.1 mM EDTA. Radioactively labeled oligonucleotide (90 nM) was mixed with various amounts of protein in 10 μl of reaction buffer [25 mM Tris–HCl, pH 7.5, 1 mM EDTA, 2 mM MgCl2 and 6% (v/v) glycerol] in the presence of 50 mM NaCl or KCl. hRPA–htelo binding reactions were conducted at 20°C for 10 min. Longer incubation times (up to 1 h) did not affect the band pattern or intensities, indicating that the systems had reached thermodynamic equilibrium in 10 min. Individual reaction mixtures were loaded onto a native 5% polyacrylamide gel in 0.5× TBE for 2.5 h at 7 V/cm and at 20°C. The gels were analyzed with a Phosphorimager STORM 860 instrument (Molecular Dynamics).
Evaluation of hRPA in hRPA–htelo complexes
hRPA–htelo binding assays, prepared as described above, were loaded onto a native 5% polyacrylamide mini-gel in 0.5× TBE. The gels were stained by Coomassie blue (0.25%) for 45 min and then washed with a solution of 10% acetic acid and 30% ethanol. Colored bands were displayed and quantified with a G800 BIORAD™ densitometer and PDQuest 2-D Analysis Software™.
Cross-linking experiments
Protein–DNA complexes obtained in hRPA–htelo binding assays, prepared as described above, were cross-linked by the addition of 0.1% glutaraldehyde for 10 min. Longer treatments or 10 min incubation with 0.2% glutaraldehyde did not significantly improve cross-linking. Individual reaction mixtures were analyzed by non-denaturing 5% PAGE in the same conditions as described above.
Quantification of _f_0, _f_1 and _f_2 fractions
The continuously decreasing mobility _m_C of C complex (Figure 2) when r increased can be explained by a fast equilibrium [where the relaxation time τ of this equilibrium is much shorter than the migration time (2.5 h) between CI and CII complexes and free protein p].
If we define α and 1 − α as the fractions of C in the CI and CII forms, respectively, then
and
To take into account the smear observed (Figure 2) at r = 0.5 and 1, we assumed that the 1:1 complex (in solution) partially dissociates in the gel. Thus, the smear is the result of the 1:1 complex dissociation. If _f_0, _f_1 and _f_2 are the relative weights in solution of free htelo, complex CI and complex CII, respectively, we can write _f_0 + _f_1 + _f_2 = 1, with _f_0 = wf, _f_1 = ws + wCI + αwC and _f_2 = (1 − α). wf, ws, wC and wCI, the weight of free htelo, smear, complex C and complex CI normalized with respect to total htelo, respectively, are calculated by Phosphorimager analysis from Figure 2. When applied to the data obtained in separate comparable experiments, fi values were calculated for each _r_-value.
Fluorescence spectroscopy
Fluorescence spectra at 20°C were recorded with a SpexFluoromax 3 instrument (Jobin-Yvon Horiba, Longjumeau, France), using 50 μl quartz cuvettes (Hellma, France) containing 90 nM F-htelo-T in 50 mM NaCl (or KCl), 2 mM MgCl2 and 5 mM lithium cacodylate (pH 7.2). Concentrated protein aliquots (0.5 μl) were directly added to the F-htelo-T solution. The spectra were recorded between 490 and 660 nm while exciting at 470 nm, and corrected for background fluorescence, dilution factor and instrument response. The fluorescence intensity of individual fluorophores was estimated by averaging the fluorescence emission intensity in the 522–528 nm region for the donor (FLUO) and 584–590 nm for the acceptor (TAMRA; the low donor emission in that wavelength range was neglected). The ratio P was calculated as P = _I_D/(_I_D + _I_A), where _I_D and _I_A are the average intensities of the donor and acceptor, respectively.
Fluorescence kinetics
Each solution containing 90 nM F-htelo-T in 2 mM MgCl2 and 5 mM lithium cacodylate (pH 7.2) was mixed at time zero with a 5× molar excess of its complementary sequence 21C or hRPA. The kinetics were recorded at 20°C in 50 mM KCl. Fluorescence intensity at 516 nm was recorded at regular time intervals (1 s) using band slits of 5 nm. Data fitting was performed as described previously (27).
RESULTS
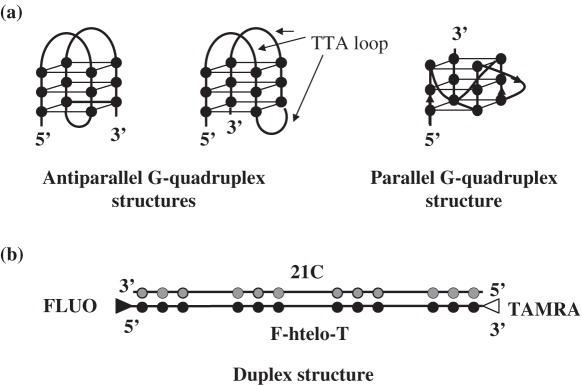
The model sequence chosen for our study is a 21mer human telomeric repeat sequence (htelo): 5′-GGGTTAGGGTTAGGGTTAGGG-3′ which mimics the telomeric G-rich tail. It is well established that telomeric sequences may adopt several quadruplex conformations such as antiparallel (28) and parallel (29) G-quadruplex structures depending on the salt conditions (Figure 1a). We selected a short fragment for our study, because four GGG blocks are sufficient for stable G-quadruplex formation in vivo (30).
Figure 1.
Schematic representation of quadruplex and duplex structures. (a) Different possible folding topologies of htelo. Closed circles depict guanines, TTA loops represent single-stranded DNA regions. (b) Schematic representation of a 21 bp duplex formed between F-htelo-T and its complementary sequence 21C where cytosines are depicted by gray circles. FLUO and TAMRA are depicted by closed and open triangles, respectively.
hRPA binds to G-quadruplexes and forms 1:1 and 2:1 complexes
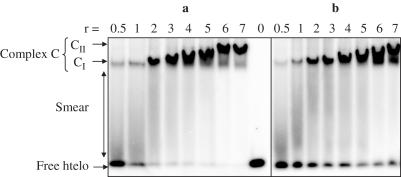
To determine whether hRPA binds the htelo sequence, we first performed electrophoretic mobility shift assays (EMSA). In a standard experiment, 90 nM 32P-labeled htelo was incubated for 10 min at 20°C with hRPA in the presence of 50 mM of either Na+ or K+. Each mixture was defined by ‘_r_’, the ratio of hRPA added relative to htelo (expressed as a molar ratio).
Figure 2a illustrates the results of EMSA experiments obtained when the binding reaction was performed in the presence of Na+. In the presence of hRPA, one or several retarded bands were obtained, demonstrating that this protein is able to form noncovalent complexes with htelo. Each complex (C) in a lane was defined by its relative mobility _m_C taking free htelo as reference, _m_f = 1 (Figure 2a). At low protein/DNA ratios (r = 0.5–1), a single well-defined complex, designated CI, with a relative mobility _m_CI = 0.27 ± 0.01, was detected. It was accompanied by free htelo and by a fast migrating smear. Increasing r from 2 to 5 progressively reduced the mobility of the main complex and quenched the smear, while free htelo vanished. For _r_-values >5, most of the htelo (80–90%) concentrated in a low-mobility band, designated CII, with a relative mobility _m_CII = 0.16 ± 0.01; its mobility remained unchanged upon increasing r up to 14 (data not shown).
Figure 2.
Titration of htelo as a function of hRPA concentration. 32P-htelo (90 nM) was incubated with various amounts of hRPA (from 45 to 630 nM) in the presence of 50 mM NaCl (a) or KCl (b) and separated on a native 5% polyacrylamide gel. CI and CII represent 1:1 and 2:1 hRPA–htelo complexes, respectively. r is the molar ratio hRPA/htelo.
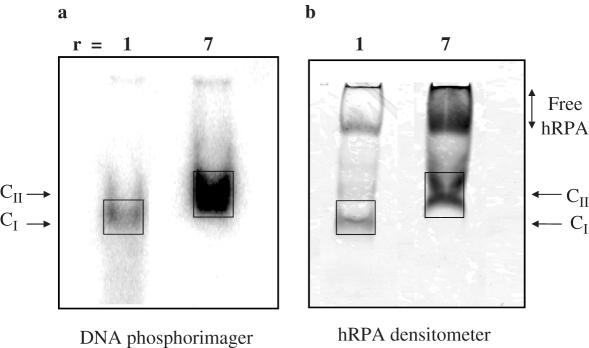
To clarify the nature of these retarded complexes, we first determined their hRPA to htelo molar ratios (hRPA/htelo). In this case, after scanning of the radioactivity using a Phosphorimager (Figure 3a), the gels were submitted to Coomassie blue staining; the intensity of the protein-containing bands was quantitatively analyzed with a densitometer (Figure 3b; Materials and Methods). Results showed that free hRPA migrates as a low-mobility band, _m_P = 0.09, and that hRPA and htelo co-migrate in C complexes. A range of control experiments with Coomassie staining showed that the signal obtained was proportional to the amount of free hRPA loaded on the gel and that the presence of htelo did not alter protein detection and measurement. The data of the ratios obtained are summarized in Table 1. When r varied from 1 to 7, the protein to DNA ratio increased continuously from ∼1 to >2, showing that CI is a 1:1 hRPA–htelo complex, while CII is a 2:1 complex accompanied possibly by higher-order complexes.
Figure 3.
Determination of the hRPA/htelo ratios in complexes. 32P-htelo (90 nM) was incubated with 90 or 630 nM of hRPA in the presence of 50 mM NaCl and separated by native 5% PAGE. Analysis using a Phosphorimager revealed radioactive htelo (a), and densitometric analysis revealed colored hRPA (b). The boxes show the areas considered to determine the hRPA/htelo ratios.
Table 1.
Quantification of hRPA to htelo ratios in complexes C
| r = 1 | r = 3 | r = 5 | r = 7 | |
|---|---|---|---|---|
| hRPA/htelo ratio | 1.04 ± 0.11 | 1.51 ± 0.1 | 1.9 ± 0.17 | 2.27 ± 0.17 |
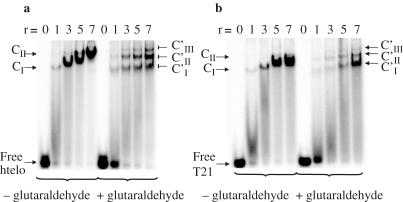
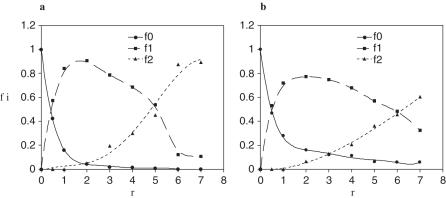
To further characterize the complexes at intermediate and high r values, protein–DNA cross-linking experiments with 0.1% glutaraldehyde were performed (31). Reaction mixtures were then loaded onto native gels. As shown in Figure 4a, glutaraldehyde pretreatment revealed two (r = 1) or three well-defined bands (r = 7) designated CI′, CII′, CIII′. The covalent complexes CI′ and CII′ migrated as their non-cross-linked CI and CII homologues indicating that CI′ and CII′ are 1:1 and 2:1 covalent complexes, respectively. CIII′ was observed only at r ≥ 3; it may represent 3:1 hRPA–htelo complex pre-existing in solution, or result from an artifact induced by cross-linking. These cross-linking experiments show clearly that formation of 2:1 complex increases with r and becomes the major species for r = 7. Combining these data and the hRPA to htelo ratios found in C complexes (Table 1), we concluded that C complexes observed at intermediate _r_-values (Figure 2a) that migrate with a relative mobility comprised between CI and CII are mixtures of 1:1 (CI) and 2:1 (CII) complexes; its continuously decreasing mobility observed when r increased (Figure 2a) can be explained by the increasing formation of 2:1 complex. Thus, we calculated for each r value the relative weights _f_0, _f_1 and _f_2 in solution of free htelo, complex CI and complex CII, respectively (Materials and Methods and Figure 5a).
Figure 4.
Comparison of htelo and T21 titrations by hRPA in the absence or presence of glutaraldehyde. 32P-DNA (90 nM) was incubated with various amounts of hRPA (from 90 to 630 nM) in the presence of 50 mM NaCl then cross-linked by the addition of 0.1% glutaraldehyde for 10 min. Individual reaction mixtures were analyzed on a native 5% polyacrylamide gel. (a) EMSA results after incubation of htelo. (b) EMSA results after incubation of T21. r is the molar ratio hRPA/DNA. CI and CII represent the non-covalent 1:1 and 2:1 hRPA–DNA complexes, respectively. CI′, CII′ and CIII′ represent the covalent 1:1, 2:1 and putative 3:1 hRPA–DNA complexes, respectively.
Figure 5.
Quantification of _f_0, _f_1 and _f_2 fractions as a function of r. The relative weights in solution of free htelo (_f_0, solid line), complex CI (_f_1, long dashed line) and complex CII (_f_2, short dashed line) were quantified for each _r_-value from hRPA–htelo EMSA (Figure 2) in the presence of Na+ (a) or K+ (b). The relative errors vary from 20% for the low _r_-values (r = 0.5–1) to 10% for the high _r_-values (r > 1). r is the molar ratio hRPA/htelo.
Parallel experiments were performed in a buffer containing K+ instead of Na+. hRPA binding was qualitatively similar in the presence of either ion (Figures 2b and 5b). However, for the same r value the amount of C complexes was always lower in K+ than in Na+. At r = 7, 60% of the htelo was involved in 2:1 complex in K+ as compared to 90% in Na+, and a significant fraction of G-quadruplexes remained unbound (7%). These differences indicate a lower affinity of hRPA for htelo in the presence of K+, which is in line with the finding that in the presence of K+, G-quadruplex structures are more stable (32).
The 1:1 complex is predominantly formed with a control oligonucleotide unable to form a G-quadruplex
As a control in these binding experiments, we tested a radiolabeled single-stranded 21mer oligodeoxythymidine T21 (90 nM). Sequential addition of hRPA in the presence of 50 mM Na+ led to a different EMSA profile (compare Figure 4a and b): (i) the weights of complexes observed on the gel without glutaraldehyde cross-linking at distinct _r_-values is slightly higher than for htelo, and (ii) the mobility of the C complexes was not reduced as much as for htelo. Glutaraldehyde cross-linking experiments showed that whatever the _r_-value, the CI′ covalent complex predominates. All these results agree with previously reported data (23) showing that hRPA is an ssDBP which predominantly forms 1:1 complexes with short DNAs. Thus, it may be assumed that formation of major 2:1 complexes with htelo is governed by some peculiar properties of this short structured DNA, which assists in binding of two heterotrimeric molecules.
hRPA binding leads to G-quadruplex unfolding
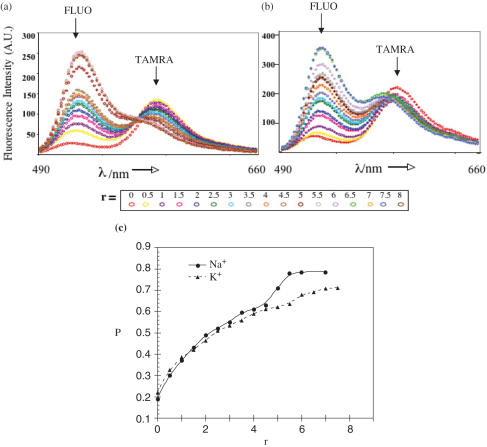
Fluorescence resonance energy transfer (FRET) experiments were used to study the conformation of htelo bound to hRPA (33). For this purpose, the htelo oligomer was labeled with two fluorophores, fluorescein (FLUO) and tetramethylrhodamine (TAMRA) attached to the 5′ and 3′ termini, respectively, leading to the dual-labeled oligonucleotide F-htelo-T (Figure 1b). Fluorescence emission of FLUO (the donor, D) is efficiently quenched by TAMRA (the acceptor, A) if the distance D–A is short. If D and A are distant from one another, their respective emissions become independent of each other. Here the extent of energy transfer is represented by an empirical parameter P = _I_D/(_I_D + _I_A), where _I_D and _I_A are the emission intensities of D and A, respectively (Materials and Methods). For free F-htelo-T, low _P_-values (_P_Quad) typical of G-quadruplex structures were obtained with _P_Quad = 0.18 ± 0.04 in the presence of Na+ and _P_Quad = 0.25 ± 0.05 in the presence of K+ (Figure 6) (33). In others words, FRET efficiency in the absence of protein (r = 0) is higher in Na+ than in K+, in agreement with recent study (34). A 21mer duplex formed between F-htelo-T and its complementary sequence, designated 21C, served as a control for quadruplex opening (Figure 1b). It was demonstrated previously that the stability of the F-htelo-T/21C duplex is higher than that of the quadruplex (35). Addition of a 5-fold molar excess of 21C over F-htelo-T (90 nM) led to a high _P_-value (_P_Duplex) of 0.83 ± 0.05 after equilibration, whatever the nature of the monovalent cation. This is consistent with the formation of a B-DNA duplex structure separating D and A by >70 Å (Figure 1b).
Figure 6.
hRPA binding leads to G-quadruplex unfolding. Fluorimetric titration of 90 nM of F-htelo-T by increasing amounts of hRPA was performed in the presence of Na+ (a) or K+ (b). The spectra were recorded after 2 min of incubation. (c) Increasing of P as a function of the hRPA/F-htelo-T ratio (r) in the presence of Na+ (solid line) or K+ (dashed line) indicates unfolding of F-htelo-T by addition of hRPA. P was calculated from experimental FRET data: P = _I_D/(_I_D + _I_A), where _I_D and _I_A are the average intensities of the donor (FLUO) and acceptor (TAMRA), respectively. For each _P_-value, error bar is ±0.05. AU, arbitrary units.
Fluorimetric titrations of F-htelo-T by hRPA were performed in the conditions used for hRPA–htelo binding in EMSA experiments. Figure 6a shows the data obtained in the presence of Na+. As the ratio r increases, FLUO emission is stimulated while TAMRA fluorescence decreases, indicating that FRET is suppressed and that hRPA is able to unfold quadruplexes. The absence of an isoemissive point (Figure 6a) and the biphasic variation of P as a function of r (Figure 6c) show that the binding process is complex and involves at least three species, in agreement with the formation of the CI and CII complexes with the free G-quadruplex structures. Thus, we can write (and calculate) that P = _f_0_P_0 + _f_1_P_1 + _f_2_P_2, where _P_0, _P_1 and _P_2 are P values for free htelo, CI complexes and CII complexes, respectively, and _f_0, _f_1 and _f_2 the previously calculated fractions of each species (Figure 5a). To fit the experimental (Figure 6c) and calculated P curves, _P_1 was considered as an adjustable parameter with _P_0 = 0.18 and _P_2 = 0.83. The agreement for both series of data is satisfactory when _P_1 is taken as 0.55 ± 0.05.
Since _P_2 is nearly identical to _P_Duplex, the final conformation of DNA bound with two (or more) hRPA corresponds to an extended structure where both fluorophores are as far away as in the duplex B-DNA structure. The lower _P_-value for the 1:1 complexes indicates that the distance D–A is smaller in the 1:1 than in the 2:1 complexes. This could be the result of the coming together of the single-stranded tails triggered by the presence of only one bound hRPA.
At first glance, titrations in the presence of K+ (Figure 6b and c) are similar to those obtained with Na+. However, significant differences are observed: (i) for the same _r_-values, P in the presence of K+ is always lower than P in the presence of Na+ in agreement with the binding data discussed above, and (ii) the value of P in the presence of K+ does not reach the _P_Duplex value at the highest _r_-value checked (r = 7) as not all htelo is bound (7% remains free) and as a non-negligible amount of 1:1 complexes is still present as shown by the EMSA experiment (Figures 2b and 5b).Taking _P_0 = 0.25 and _P_2 = 0.83, the best fit between the experimental (Figure 6c) and calculated data is obtained with _P_1 = 0.6 ± 0.05.
One can therefore conclude that in the presence of either Na+ or K+, G-quadruplex structures are unfolded in the hRPA–htelo complexes. In the 1:1 complexes, the oligonucleotide end-to-end distance is intermediate between the one observed in quadruplexes and the larger one (d ≥ 70 Å) found in the 2:1 complexes.
hRPA efficiently unfolds G-quadruplexes
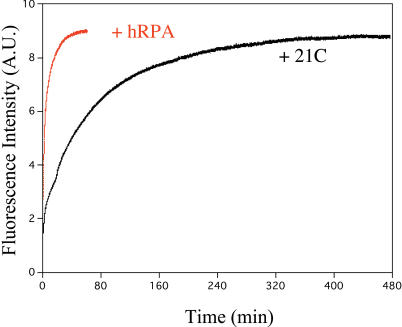
To gain insight into the opening process of the hRPA-induced G-quadruplex, its kinetics were compared to those obtained during the formation of the duplex F-htelo-T/21C (Figure 1b). Five equivalents of either hRPA or 21C were added to a solution of F-htelo-T and rapidly mixed. The kinetics were followed by measuring the emission spectra at 516 nm (FLUO emission) and are shown in Figure 7. The experiments were performed in K+ conditions in which the stability of the G-quadruplexes is highest (32). Duplex formation could not be properly fitted with a mono-exponential function, and was fitted with a bi-exponential model, as observed previously (27,36), with a fast phase (_k_fast = 0.031 ± 0.003 min−1) accompanied by a much slower phase (_k_slow = 0.0083 ± 0.0002 min−1) (data not shown). The fast phase was of the same order of magnitude as reported previously (36,37) for the unfolding step of G-quadruplex structures. A bi-exponential function was also required to fit the binding of hRPA to htelo, but the kinetics were obviously faster (Figure 7), with _k_fast = 0.81 ± 0.01 min−1 and _k_slow = 0.080 ± 0.001 min−1. These relatively fast kinetics observed with hRPA as compared to complementary DNA highlight the active role of hRPA in quadruplex opening.
Figure 7.
Comparison of the F-htelo-T opening by 21C and hRPA. Each solution containing 90 nM F-htelo-T was mixed at time zero with a 5× molar excess of its complementary sequence 21C (black curve) or hRPA (red curve). Fluorescence intensity was recorded at 516 nm in the presence of 50 mM KCl. AU, arbitrary units.
Fluorimetric titrations of the dually labeled single-stranded oligonucleotide control F-T21-T by hRPA were performed in the presence of Na+ (data not shown). hRPA has a greater affinity for the F-T21-T control sequence compared to F-htelo-T, since FRET titration is complete for r = 1 (with P increasing from 0.45 for r = 0 to 0.74 for r ≥ 1). Under the same conditions an important smear was observed in the EMSA experiment when radiolabeled T21 was mixed with one equivalent of hRPA (Figure 4b). This observation indicates that the smear observed in the native gel at low _r_-values (r = 0.5 and 1) represents 1:1 complex dissociation during migration (Figures 2 and 4). In addition, if we compare the _P_-values of the 1:1 complexes obtained with F-T21-T and F-htelo-T (0.74 ± 0.01 and 0.55 ± 0.05, respectively), we can conclude that in the 1:1 complexes with hRPA the DNA conformations of T21 and htelo differ. This is in agreement with a different mode of binding of hRPA to the quadruplex-forming substrate, as discussed above. Moreover, kinetic experiments of the dually labeled single-stranded oligonucleotide control F-T21-T by hRPA showed that <30 s were necessary to obtain maximal fluorescence emission (data not shown). This time scale agrees with the one observed previously for hRPA binding to ssDNA (38,39).
DISCUSSION
From the data presented, it can be concluded that hRPA is able to bind 21mer G-quadruplex structures by forming 1:1 complexes and 2:1 complexes, and possibly higher order complexes. The 2:1 complexes are presumably stabilized by cooperative interactions between the two hRPA molecules (26,31) leading to the very stable noncovalent complexes observable by electrophoresis. In comparison with hRPA binding to the single-stranded T21 oligomer, which mainly displays 1:1 complexes, it is clear that the hRPA-binding mode differs depending on the nature of the DNA. It is well known that RPA exhibits relatively low specificity for nucleic acid sequences with a 50-fold preference for polypyrimidine tracks (22–24,40). This sequence preference is similar to those of other nonspecific ssDBP, e.g. the E.coli ssDBP (E.coli ssDBP) (41). However it was clearly demonstrated recently that there is a general influence of the nucleic acid sequence itself on the binding interactions with ssDBPs: ssDNA binding is influenced by base stacking and the nearest-neighbor (nucleotide sequence in DNA) dependence of this stacking (42). Nevertheless, formation of major stable 2:1 complexes with a 21mer DNA strongly suggests that unlike T21, hRPA binding to G-quadruplex structures is directed by the structure itself with a sequential binding mode. This implies that the first hRPA binds to one extremity of the DNA, allowing binding of the second hRPA. In this case, as htelo is a 21mer, both hRPA should bind htelo by its 8–10 nt binding mode (22–26).
Duplex formation with a G-quadruplex prone sequence is a slow process, especially in the presence of K+ (35). Opening of the quadruplex is a prerequisite for duplex formation, and the kinetics are dictated by quadruplex unfolding rather than by bimolecular association. In contrast, FRET and kinetics experiments demonstrate that hRPA acts rapidly and efficiently promotes G-quadruplex opening, as a few minutes only are necessary to open the htelo G-quadruplex structure(s). The fast action of hRPA might be required in cases where quadruplex lifetime is long compared to key cellular processes such as replication. Preliminary experiments with an ssDBP such as E.coli ssDBP suggest that under similar conditions the binding mode and kinetics of E.coli ssDBP are very different compared to hRPA (T. R. Salas, unpublished data), arguing for a specific effect of the hRPA on the G-quadruplex. Other ssDBP or nucleic acids chaperones will be tested to determine if hRPA possesses a unique mode of action on the G-quadruplex.
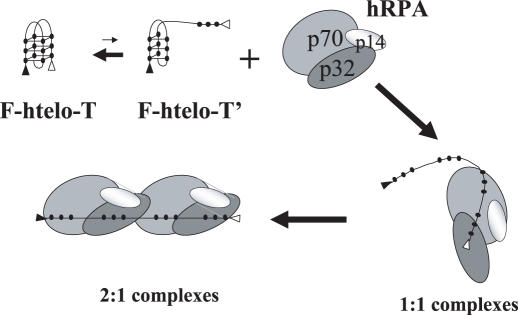
Taken together, these data lead to the sequential model of hRPA binding summarized in Figure 8. F-htelo-T only displays three short ‘single-stranded’ regions corresponding to the TTA loops (Figure 1a); it is not clear if these short single-stranded regions are sufficient for the initial binding of hRPA. Alternatively, it has been shown that G-quadruplex structures are in equilibrium with partially unfolded G-quadruplex species (F-htelo-T′) where some Hoogsteen hydrogen bonds might be transiently opened (43). These single-stranded regions generated at the extremities could be accessible and rapidly trapped by hRPA. This first binding step should destabilize the hydrogen bonds between the remaining Gs of the proximal quartet, permitting the initial conformational change observed by FRET (1:1 complexes). This unfolded DNA bound with one hRPA molecule could facilitate binding of a second hRPA molecule. Thus hRPA would form two distinct complexes in which DNA is maintained in different unfolded conformations.
Figure 8.
Sequential model of hRPA binding to G-quadruplexes. hRPA binding is directed by single-stranded regions generated at the extremities of the partially unfolded structures as represented by F-htelo-T′. This first binding step destabilizes the G-quadruplex structure to form 1:1 complexes. This unfolded DNA bound to one hRPA molecule at the extremity facilitates binding of a second hRPA molecule to produce 2:1 complexes.
The idea that hRPA can remove secondary and tertiary DNA structures by a simple destabilization process was reported previously (44,45). The recent model of a multi-step helix destabilization process by hRPA described by Binz et al. (46) supports our results. Unlike hRPA, human helicases such as BLM and WRN, that unwind G-quadruplex structures with a 3′–5′ polarity, require ATP, Mg2+ and at least one single-stranded 3′ tail (47,48). In our system, neither ATP nor 3′ tail is present. In addition, even if there is no evidence of polarity of hRPA binding to G-quadruplex structures, it is well known that hRPA binds ssDNA with the opposite 5′–3′ polarity (49,50). Clearly, more detailed studies are needed to unravel the mechanism by which hRPA binds and opens G-quadruplex structures. This binding proceeds with high efficiency and significant specificity for G-quadruplexes, suggesting that it has an important biological role in telomere maintenance.
G-quadruplex structures may be important for a number of biological processes and disease-related mechanisms. Particularly, it has been shown that they inhibit telomerase activity by impeding the recruitment and binding of telomerase components to telomeres. We have revealed by this investigation that G-quadruplex structures are specific targets for hRPA and that this protein is able to bind and open G-quadruplex structures much faster than the complementary DNA strand. There is good reason to believe that opening G-quadruplex structures by RPA takes place in order to maintain the telomeric G-overhang in a single-stranded conformation, compatible with telomerase activity. Cohen et al. (21) showed that depending on its concentration, hRPA may exert either stimulatory or inhibitory effects on telomerase; it would be important to correlate this observation with the formation of 1:1 or 2:1 complexes. Interestingly, Zaug et al. (51) indicated that human POT1 is able to disrupt telomeric G-quadruplexes and that extension by the telomerase depends on the relative position of POT1 on htelo. Thus, the details of the architecture protein–DNA complexes may play an essential role in telomerase activity. We are now investigating whether similar conclusions may be reached with hRPA.
Acknowledgments
We thank Anne-Lise Haenni (IJM, Paris, France) for careful reading of the manuscript. This work was supported by grants from GEFLUC (to C.S.), ARC (#3365 to J.L.M.), EU FP6 ‘Mol Cancer Med’ (# LSHC-CT-2004-502943 to J.L.M.) and RFBR (06-04-48526-a, to I.P., 05-0448319 to O.L. and HSFP-RGP0007/2004-C). We are grateful to CONACYT and SEP Mexico for scholarships (to T.R.S.). Funding to pay the Open Access publication charges for this article was provided by CNRS.
Conflict of interest statement. None declared.
REFERENCES
- 1.Blackburn E.H. Structure and function of telomeres. Nature. 1991;350:569–573. doi: 10.1038/350569a0. [DOI] [PubMed] [Google Scholar]
- 2.Blackburn E.H. Telomere states and cell fates. Nature. 2000;408:53–56. doi: 10.1038/35040500. [DOI] [PubMed] [Google Scholar]
- 3.Li B., Oestreich S., de Lange T. Identification of human Rap1: implications for telomere evolution. Cell. 2000;101:471–483. doi: 10.1016/s0092-8674(00)80858-2. [DOI] [PubMed] [Google Scholar]
- 4.van Steensel B., Smogorzewska A., de Lange T. TRF2 protects human telomeres from end-to-end fusions. Cell. 1998;92:401–413. doi: 10.1016/s0092-8674(00)80932-0. [DOI] [PubMed] [Google Scholar]
- 5.Price C.M., Cech T.R. Telomeric DNA–protein interactions of Oxytricha macronuclear DNA. Genes Dev. 1987;1:783–793. doi: 10.1101/gad.1.8.783. [DOI] [PubMed] [Google Scholar]
- 6.Baumann P., Cech T.R. Pot1, the putative telomere end-binding protein in fission yeast and humans. Science. 2001;292:1171–1175. doi: 10.1126/science.1060036. [DOI] [PubMed] [Google Scholar]
- 7.Smith J., Zou H., Rothstein R. Characterization of genetic interactions with RFA1: the role of RPA in DNA replication and telomere maintenance. Biochimie. 2000;82:71–78. doi: 10.1016/s0300-9084(00)00183-8. [DOI] [PubMed] [Google Scholar]
- 8.Neidle S., Parkinson G.N. The structure of telomeric DNA. Curr. Opin. Struct. Biol. 2003;13:275–283. doi: 10.1016/s0959-440x(03)00072-1. [DOI] [PubMed] [Google Scholar]
- 9.McEachern M.J., Krauskopf A., Blackburn E.H. Telomeres and their control. Annu. Rev. Genet. 2000;34:331–358. doi: 10.1146/annurev.genet.34.1.331. [DOI] [PubMed] [Google Scholar]
- 10.Wright W.E., Tesmer V.M., Huffman K.E., Levene S.D., Shay J.W. Normal human chromosomes have long G-rich telomeric overhangs at one end. Genes Dev. 1997;11:2801–2809. doi: 10.1101/gad.11.21.2801. [DOI] [PMC free article] [PubMed] [Google Scholar]
- 11.Klobutcher L.A., Swanton M.T., Donini P., Prescott D.M. All gene-sized DNA molecules in four species of hypotrichs have the same terminal sequence and an unusual 3′ terminus. Proc. Natl Acad. Sci. USA. 1981;78:3015–3019. doi: 10.1073/pnas.78.5.3015. [DOI] [PMC free article] [PubMed] [Google Scholar]
- 12.Henderson E.R., Blackburn E.H. An overhanging 3′ terminus is a conserved feature of telomeres. Mol. Cell. Biol. 1989;9:345–348. doi: 10.1128/mcb.9.1.345. [DOI] [PMC free article] [PubMed] [Google Scholar]
- 13.McElligott R., Wellinger R.J. The terminal DNA structure of mammalian chromosomes. EMBO J. 1997;16:3705–3714. doi: 10.1093/emboj/16.12.3705. [DOI] [PMC free article] [PubMed] [Google Scholar]
- 14.Collins K., Mitchell J.R. Telomerase in the human organism. Oncogene. 2002;21:564–579. doi: 10.1038/sj.onc.1205083. [DOI] [PubMed] [Google Scholar]
- 15.Reveal P.M., Henkels K.M., Turchi J.J. Synthesis of the mammalian telomere lagging strand in vitro. J. Biol. Chem. 1997;272:11678–11681. doi: 10.1074/jbc.272.18.11678. [DOI] [PubMed] [Google Scholar]
- 16.Williamson J.R. G-quartet structures in telomeric DNA. Annu. Rev. Biophys. Biomol. Struct. 1994;23:703–730. doi: 10.1146/annurev.bb.23.060194.003415. [DOI] [PubMed] [Google Scholar]
- 17.Schaffitzel C., Berger I., Postberg J., Hanes J., Lipps H.J., Plückthun A. In vitro generated antibodies specific for telomeric guanine-quadruplex DNA react with Stylonychia lemnae macronuclei. Proc. Natl Acad. Sci. USA. 2001;98:8572–8577. doi: 10.1073/pnas.141229498. [DOI] [PMC free article] [PubMed] [Google Scholar]
- 18.Duquette M.L., Handa P., Vincent J.A., Taylor A.F., Maizels N. Intracellular transcription of G-rich DNAs induces formation of G-loops, novel structures containing G4 DNA. Genes Dev. 2004;18:1618–1629. doi: 10.1101/gad.1200804. [DOI] [PMC free article] [PubMed] [Google Scholar]
- 19.Zahler A.M., Williamson J.R., Cech T.R., Prescott D.M. Inhibition of telomerase by G-quartet DNA structures. Nature. 1991;350:718–720. doi: 10.1038/350718a0. [DOI] [PubMed] [Google Scholar]
- 20.Schramke V., Luciano P., Brevet V., Guillot S., Corda Y., Longhese M.P., Gilson E., Géli V. RPA regulates telomerase action by providing Est1p access to chromosome ends. Nature Genet. 2004;36:46–54. doi: 10.1038/ng1284. [DOI] [PubMed] [Google Scholar]
- 21.Cohen S., Jacob E., Manor H. Effects of single-stranded DNA binding proteins on primer extension by telomerase. Biochim. Biophys. Acta. 2004;1679:129–140. doi: 10.1016/j.bbaexp.2004.06.002. [DOI] [PubMed] [Google Scholar]
- 22.Wold M.S. Replication protein A: a heterotrimeric, single-stranded DNA-binding protein required for eukaryotic DNA metabolism. Annu. Rev. Biochem. 1997;66:61–92. doi: 10.1146/annurev.biochem.66.1.61. [DOI] [PubMed] [Google Scholar]
- 23.Iftode C., Daniely Y., Borowiec J.A. Replication protein A (RPA): the eukaryotic SSB. Crit. Rev. Biochem. Mol. Biol. 1999;34:141–180. doi: 10.1080/10409239991209255. [DOI] [PubMed] [Google Scholar]
- 24.Binz S.K., Lao Y., Lowry D.F., Wold M.S. The phosphorylation domain of the 32-kDa subunit of replication protein A (RPA) modulates RPA–DNA interactions. J. Biol. Chem. 2003;278:35584–35591. doi: 10.1074/jbc.M305388200. [DOI] [PubMed] [Google Scholar]
- 25.Gomes X.V., Henricksen L.A., Wold M.S. Proteolytic mapping of human replication protein A: evidence for multiple structural domains and a conformational change upon interaction with single-stranded DNA. Biochemistry. 1996;35:5586–5595. doi: 10.1021/bi9526995. [DOI] [PubMed] [Google Scholar]
- 26.Lavrik O.I., Kolpashchikov D.M., Weisshart K., Nasheuer H.P., Khodyreva S.N., Favre A. RPA subunit arrangement near the 3′-end of the primer is modulated by the length of the template strand and cooperative protein interactions. Nucleic Acids Res. 1999;27:4235–4240. doi: 10.1093/nar/27.21.4235. [DOI] [PMC free article] [PubMed] [Google Scholar]
- 27.Kumar N., Maiti S. The effect of osmolytes and small molecule on quadruplex-WC duplex equilibrium: a fluorescence resonance energy transfer study. Nucleic Acids Res. 2005;33:6723–6732. doi: 10.1093/nar/gki961. [DOI] [PMC free article] [PubMed] [Google Scholar]
- 28.Wang Y., Patel D.J. Solution structure of the human telomeric repeat d[AG3(T2AG3)3] G-tetraplex. Structure. 1993;1:263–282. doi: 10.1016/0969-2126(93)90015-9. [DOI] [PubMed] [Google Scholar]
- 29.Parkinson G.N., Lee M.P.H., Neidle S. Crystal structure of parallel quadruplexes from human telomeric DNA. Nature. 2002;417:876–880. doi: 10.1038/nature755. [DOI] [PubMed] [Google Scholar]
- 30.Vorlickova M., Chladkova J., Kejnovska I., Fialova M., Kypr J. Guanine tetraplex topology of human telomere DNA is governed by the number of (TTAGGG) repeats. Nucleic Acids Res. 2005;33:5851–5860. doi: 10.1093/nar/gki898. [DOI] [PMC free article] [PubMed] [Google Scholar]
- 31.Blackwell L.J., Borowiec J.A., Mastrangelo I.A. Single-stranded DNA binding alters human replication protein A structure and facilitates interaction with DNA-dependent proteine kinase. Mol. Cell. Biol. 1996;16:4798–4807. doi: 10.1128/mcb.16.9.4798. [DOI] [PMC free article] [PubMed] [Google Scholar]
- 32.Mergny J.L., Phan A.T., Lacroix L. Following G-quartet formation by UV-spectroscopy. FEBS Lett. 1998;435:74–78. doi: 10.1016/s0014-5793(98)01043-6. [DOI] [PubMed] [Google Scholar]
- 33.Mergny J.L., Maurizot J.C. Fluorescence resonance energy transfer as a probe for G-quartet formation by a telomeric repeat. ChemBioChem. 2001;2:124–132. doi: 10.1002/1439-7633(20010202)2:2<124::AID-CBIC124>3.0.CO;2-L. [DOI] [PubMed] [Google Scholar]
- 34.Juskowiak B., Galezowska E., Zawadzka A., Gluszynska A., Takenaka S. Fluorescence anisotropy and FRET studies of G-quadruplex formation in presence of different cations. Spectrochim. Acta A Mol. Biomol. Spectrosc. 2006;64:835–843. doi: 10.1016/j.saa.2005.08.012. [DOI] [PubMed] [Google Scholar]
- 35.Alberti P., Mergny J.L. DNA duplex–quadruplex exchange as the basis for a nanomolecular machine. Proc. Natl Acad. Sci. USA. 2003;100:1569–1573. doi: 10.1073/pnas.0335459100. [DOI] [PMC free article] [PubMed] [Google Scholar]
- 36.Green J.J., Ying L., Klenerman D., Balasubramanian S. Kinetics of unfolding the human telomeric DNA G-quartet structure using a PNA trap. J. Am. Chem. Soc. 2003;125:3763–3767. doi: 10.1021/ja029149w. [DOI] [PubMed] [Google Scholar]
- 37.Zhao Y., Kan Z.Y., Zeng Z.X., Hao Y.H., Chen H., Tan Z. Determining the folding and unfolding rate constants of nucleic acids by biosensor. J. Am. Chem. Soc. 2004;126:13255–13264. doi: 10.1021/ja048398c. [DOI] [PubMed] [Google Scholar]
- 38.Wang M., Mahrenholz A., Lee S.H. RPA stabilizes the XPA-damaged DNA complex through protein–protein interaction. Biochemistry. 2000;39:6433–6439. doi: 10.1021/bi000472q. [DOI] [PubMed] [Google Scholar]
- 39.Schubert F., Zettl H., Häfner W., Krauss G., Krausch G. Comparative thermodynamic analysis of DNA–protein interactions using surface plasmon resonance and fluorescence correlation spectroscopy. Biochemistry. 2003;42:10288–10294. doi: 10.1021/bi034033d. [DOI] [PubMed] [Google Scholar]
- 40.Wyka I.M., Dhar K., Binz S.K., Wold M.S. Replication protein A interactions with DNA: differential binding of the core domains and analysis of the DNA interaction surface. Biochemistry. 2003;42:12909–12918. doi: 10.1021/bi034930h. [DOI] [PubMed] [Google Scholar]
- 41.Lohman T.M., Ferrari M.E. Escherichia coli single-stranded DNA-binding protein: multiple DNA-binding modes and cooperativities. Annu. Rev. Biochem. 1994;63:527–570. doi: 10.1146/annurev.bi.63.070194.002523. [DOI] [PubMed] [Google Scholar]
- 42.Mou T.C., Shen M., Abdalla S., Delamora D., Bochkareva E., Bochkarev A., Gray D.M. Effects of ssDNA sequences on non-sequence-specific protein binding. Chirality. 2006;18:370–382. doi: 10.1002/chir.20262. [DOI] [PubMed] [Google Scholar]
- 43.Lee J.Y., Okumus B., Kim D.S., Ha T. Extreme conformational diversity in human telomeric DNA. Proc. Natl Acad. Sci. USA. 2005;102:18938–18943. doi: 10.1073/pnas.0506144102. [DOI] [PMC free article] [PubMed] [Google Scholar]
- 44.Treuner K., Ramsperger U., Knippers R. Replication protein A induces the unwinding of long double-stranded DNA regions. J. Mol. Biol. 1996;259:104–112. doi: 10.1006/jmbi.1996.0305. [DOI] [PubMed] [Google Scholar]
- 45.Iftode C., Borowiec J.A. Unwinding of origin-specific structures by human replication A occurs in a two-step process. Nucleic Acids Res. 1998;26:5636–5643. doi: 10.1093/nar/26.24.5636. [DOI] [PMC free article] [PubMed] [Google Scholar]
- 46.Binz S.K., Lao Y., Lowry D.F., Wold M.S. The phosphorylation domain of the 32-kDa subunit of replication protein A (RPA) modulates RPA–DNA interactions. J. Biol. Chem. 2003;278:35584–35591. doi: 10.1074/jbc.M305388200. [DOI] [PubMed] [Google Scholar]
- 47.Huber M.D., Lee D.C., Maizels N. G4 DNA unwinding by BLM and Sgs1p: substrate specificity and substrate-specific inhibition. Nucleic Acids Res. 2002;30:3954–3961. doi: 10.1093/nar/gkf530. [DOI] [PMC free article] [PubMed] [Google Scholar]
- 48.Mohaghegh P., Karow J.K., Brosh R.M., Bohr V.A., Hickson I.D. The Bloom's and Werner's syndrome proteins are DNA structure-specific helicases. Nucleic Acids Res. 2001;29:2843–28493. doi: 10.1093/nar/29.13.2843. [DOI] [PMC free article] [PubMed] [Google Scholar]
- 49.Iftode C., Borowiec J.A. 5′→3′ molecular polarity of human replication protein A (hRPA) binding to pseudo-origin DNA substrates. Biochemistry. 2000;39:11970–1181. doi: 10.1021/bi0005761. [DOI] [PubMed] [Google Scholar]
- 50.Kolpashchikov D.M., Khodyreva S.N., Khlimankov D.Y., Wold M.S., Favre A., Lavrik O.I. Polarity of human replication protein A binding to DNA. Nucleic Acids Res. 2001;29:373–379. doi: 10.1093/nar/29.2.373. [DOI] [PMC free article] [PubMed] [Google Scholar]
- 51.Zaug A., Podell ER., Cech T. Human POT1 disrupts telomeric G-quadruplexes allowing telomerase extension in vitro. Proc. Natl Acad. Sci. USA. 2005;102:10864–10869. doi: 10.1073/pnas.0504744102. [DOI] [PMC free article] [PubMed] [Google Scholar]
