Identification of insertion hot spots for non-LTR retrotransposons: computational and biochemical application to Entamoeba histolytica (original) (raw)
Abstract
The genome of the human pathogen Entamoeba histolytica contains non-long terminal repeat (LTR) retrotransposons, the EhLINEs and EhSINEs, which lack targeted insertion. We investigated the importance of local DNA structure, and sequence preference of the element-encoded endonuclease (EN) in selecting target sites for retrotransposon insertion. Pre-insertion loci were tested computationally to detect unique features based on DNA structure, thermodynamic considerations and protein interaction measures. Target sites could readily be distinguished from other genomic sites based on these criteria. The contribution of the EhLINE1-encoded EN in target site selection was investigated biochemically. The sequence-specificity of the EN was tested in vitro with a variety of mutated substrates. It was possible to assign a consensus sequence, 5′-GCATT-3′, which was efficiently nicked between A-T and T-T. The upstream G residue enhanced EN activity, possibly serving to limit retrotransposition in the A+T-rich E.histolytica genome. Mutated substrates with poor EN activity showed structural differences compared with normal substrates. Analysis of retrotransposon insertion sites from a variety of organisms showed that, in general, regions of favorable DNA structure were recognized for retrotransposition. A combination of favorable DNA structure and preferred EN nicking sequence in the vicinity of this structure may determine the genomic hotspots for retrotransposition.
INTRODUCTION
Retrotransposition is a wide spread phenomenon occurring in eukaryotic genomes of diverse taxonomic groups. It is believed to be responsible for various important events in the genome, such as gene inactivation, transduction of genomic sequences, regulation of gene expression and genome expansion (1). It has also been implicated in human genetic diseases (2). The insertion sites of many non-long terminal repeat (LTR) retrotransposons, including human L1 are distributed throughout the genome. How these sites are selected for element insertion is not clear. An appreciation of the major factors that determine the preferred location of a retrotransposon in a genome will give us a tool to understand, predict and possibly manipulate the course of genomic evolution due to transposition events.
Entamoeba histolytica, a primitive eukaryote, is the third leading cause of morbidity and mortality due to parasitic disease in humans, and is estimated to be responsible for between 50 000 and 100 000 deaths every year (3). It is home to the non-LTR retrotransposons EhLINEs and EhSINEs. These together account for about 6–8% of the genome, where they are distributed in the intergenic regions (4). Being located close to protein-coding genes, they may be capable of influencing the expression of genes in their vicinity, as reported for amoebapore, a virulence factor (5). The nonpathogenic sibling species Enatmoeba dispar also contains its own set of EdLINEs/EdSINEs. However the sites occupied by these elements in their respective genomes are distinct. It is possible that the evolution of pathogenesis could be linked to diversification of transposable elements in the common ancestor of the two species.
Target primed reverse transcription (TPRT) is thought to be the mechanism by which non-LTR retrotransposons insert in the genome (6). Since retrotransposition is initiated by the element-encoded endonuclease (EN) making a nick at the bottom strand of the site of insertion, an important determinant of target site specificity could be the preferred nucleotide sequences recognized by the EN. The ENs encoded by all known non-LTR retrotransposons belong to one of two major classes: the apurinic/apyrimidinic endonuclease (APE) and the restriction enzyme-like endonuclease (REL-ENDO) (7). In general the elements encoding APE-like domains do not insert in a sequence specific manner unlike those encoding REL-ENDO domains, although several exceptions to this generalization are known. For example, the APE class of element, R1Bm, inserts at a specific location in the 28S rRNA gene of Bombyx mori (8) and Tx1L inserts specifically into another transposon Tx1D in Xenopus laevis (9). The EN encoded by EhLINEs in E.histolytica is of the REL-ENDO type. The known members of this class either insert into specific repetitive genes (R2Bm of B.mori and R4 of Ascaris insert in the 28S rRNA gene; members of CRE clade insert in the spliced leader genes) or into TAA repeats (Dong element of B.mori, or Rex 6 in vertebrates) (10,11). On the other hand, EhLINEs/SINEs in the E.histolytica genome are not known to insert within any gene or specific DNA sequence.
The apparent lack of targeted insertion of many non-LTR elements could be due to non sequence specific nicking by the element-encoded EN, or it may imply that these elements recognize structural features of the DNA rather than sequence alone. Do the insertion sites share conserved structural features which are recognized by the element in order for subsequent events like nicking and reverse transcription to take place? A number of methods are available which measure DNA structural features, such as bendability (12,13), and propeller twist (14); thermodynamic features, such as stacking energy (15), duplex stability (16,17) and denaturation energy (18); protein interaction measures, such as protein-induced deformability (19,20) and nucleosomal positioning (21). We show that these features deviate significantly at insertion hot spots of a variety of non-LTR retroelements in different organisms. Using pre insertion sites of EhLINE1/SINE1 as our model we have developed a tool (DNA SCANNER), which scans and plots a given set of parameters in a DNA sequence; this facilitates analysis of these structural features and thus indicates the potential of a given putative site for actual insertion. We have also measured the substrate specificity of EhLINE1-EN using an in vitro assay (22), to determine the contribution of the EN in target site selection. We show that although the EN is not strictly sequence-specific, it is possible to assign a consensus sequence at which the enzyme nicks preferentially. A combination of EN nicking preference and DNA structure at pre insertion loci may define insertion hot spots.
MATERIALS AND METHODS
Expression and purification of EhLINE1-EN
EhLINE1-EN protein was purified as described (22) except that Escherichia coli cells were grown for 90 min after adding isopropyl-β-d-thiogalactopyranoside (IPTG). The recombinant protein was eluted with 250 mM imidazole after extensive washing with buffer containing 80 mM imidazole. The protein was immediately dialyzed against 50 mM Tris–HCl (pH 7.5), 100 mM NaCl, 10 mM MgCl2, 2 mM DTT and 2 mM phenylmethylsulfonyl fluoride (PMSF) at 4°C for 2 h with one change. It was stored at −80°C in aliquots.
Preparation of substrates and EN assays
For preparation of radiolabeled substrates by PCR, the bottom strand primer (50 pmol) was end labeled in a 20 μl reaction using 50 μCi of [γ-32P]ATP (Amersham pharmacia Biosciences) and T4 polynucleotide kinase (NEB). The reaction was stopped by incubating at 65°C for 20 min and the labeled primer was purified by passing through Sephadex G-25 (Amersham Pharmacia Biosciences) (23). The DNA substrates were generated by PCR with 176 bp DNA fragment as template and a combination of one end-labeled primer and the other unlabeled primer. PCR products were separated on 6–15% native polyacrylamide gels depending on the size of the products. DNA band corresponding to the full-length product was excised from the gel. DNA was recovered by the ‘crush and soak’ method (23).
The DNA substrate (100 ng) was incubated with 40 ng EN protein in a 10 μl reaction for 1 h at 37°C. The enzyme was inactivated by adding 25 mM EDTA. Denaturing electrophoresis was performed on 6–12% polyacrylamide gels containing 7 M urea. A 2 μl aliquot of the reaction product was mixed with 8 μl of formamide gel loading dye (95% formamide, 20 mM EDTA, 0.05% bromophenol blue and 0.05% xylene cyanol FF), boiled for 5 min and chilled on ice before loading. The parallel sequencing reaction was carried out by using Thermo Sequenase cycle Sequencing Kit (Amersham Pharmacia Biosciences). Template DNA (100–150 ng) and 1–2 pmol primer was used for each sequencing reaction. Electrophoresis was done at 45 W for 1–3 h with gel temperature being maintained at 45–50°C (Owl Separation System, S4S). The gels were fixed, dried and exposed to X-ray film. Quantitation of the reaction product was carried out with FLA 5000 imaging system (Fujifilm).
Synthetic substrates (32–35 bp) and the 27 bp substrate were prepared by annealing the overlapping complementary single-stranded oligonucleotides, followed by gap filling and PCR. The substrates were purified and treated with EN as described above.
Data retrieval
The insertion loci were obtained by using an automated software tool ELEANALYSER that was developed for analysis of elements in a genome (4). This tool incorporates various Perl programs as filters and parsers along with BLAST (24) suite of programs. The target site duplications at the boundaries of elements were determined with pair-wise alignment. Redundant data were removed.
Computational analysis of E.histolytica pre insertion sequences
The positive dataset consisted of 93 sequences of known insertion sites (see the Results section) while the negative dataset consisted of 100 sequences known not to permit insertion. For each of the structural properties discussed here, a graphical profile was constructed for each member of the positive or negative dataset by evaluating the said property in a sliding window of 5 bp along the sequence. The set of profiles was then averaged separately over the positive and the negative datasets. Properties, such as the propellar twist, bendability and denaturation depend on the sequence of dinucleotides or trinuclotides in the DNA. Previous studies, such as protein–DNA interactions and DNase I experiments (12,13) give estimates of the values of bendability, etc. for each di/trinucleotide. These data are also available at http://www.fruitfly.org/~guochun/pins.html (25), as well as on our web server, http://ccbb.jnu.ac.in/dnascanner.html. The total value of a given property in a given window is a sum of contributions from the constituent sequence of di/trinucleotides.
In order to measure if differences between the controls and the insertion sites were significant, we used Mann–Whitney tests using the statistical software MINITAB. Analysis of any DNA sequence with respect to the different parameters described here is possible at this website with the tool DNA SCANNER.
Insertion site analysis in other genomes
In a similar manner, we constructed positive and negative datasets for other genomes. Namely, upstream regions for a set of known insertion sites were curated from GenBank for the organisms, such as Dictyostelium discoideum, Takifugu rubripes and Drosophila melanogaster. A negative dataset was also constructed as follows: for site specific elements, the sequences near known insertion sites were taken whereas for dispersed elements, sequences were randomly picked from the genome. For each of these sets, as discussed above, average property profiles were constructed. To determine whether a given property was sufficiently discriminatory between the positive and the negative datasets, the profiles were compared and required to have a separation of at least one SD. These profiles were also required to be distinct over a region of at least 18 nt in order that the said property could be considered useful in distinguishing between the two sets.
RESULTS
Role of the element-encoded EN in target site selection
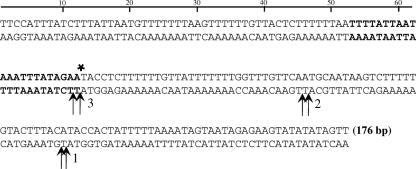
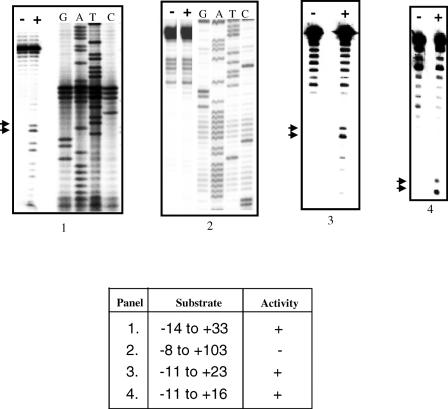
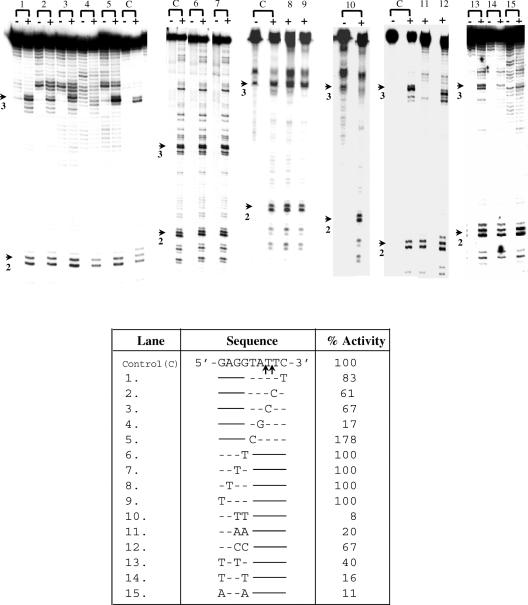
According to the TPRT model of retrotransposition by non-LTR elements, the process is initiated by a nick in the bottom strand of the target site, generated by EN. An important determinant in the choice of insertion sites by EhLINEs/SINEs could, therefore, be the preferred substrate requirements of the EN. To test this we chose oligonucleotide substrates derived from a sequence in the E.histolytica genome where EhSINE1 is known to insert. We had earlier shown that a 176 bp fragment containing this insertion site was nicked specifically by EN at the bottom strand, exactly at the point of EhSINE1 insertion (22). In addition to this nicking hot spot (termed site #3), the 176 bp fragment (Figure 1) contained other hot spots, of which site #2 and site #1 will be used as controls in subsequent experiments. Deletion analysis of the region surrounding site #3 showed that a 27 bp fragment (−11 to +16 of nick with respect to bottom strand) was sufficient as a substrate for EN activity (Figure 2). Next, we altered the sequences immediately surrounding the bottom strand nick in site #3 to determine their role, if any, in substrate recognition of the EN. Transition mutations were introduced using oligos with the appropriately altered sequence to PCR amplify a 117 bp fragment from the 176 bp template (position 60 to 176). The DNAs thus obtained contained a normal site #2 and a mutated site #3. The activity of EN on the mutated site #3 was quantitated using site #2 as an internal control. The results showed that changing the nucleotides downstream of the nick reduced the EN activity only marginally. However, changing the nucleotides upstream of the nick had a much larger impact (upstream A to G decreased the activity to 17% and T to C increased the activity to 178%) (Figure 3).
Figure 1.
The 176 bp E.histolytica DNA fragment containing an empty target site for EhSINE1. Nucleotides in bold indicate the 22 bp target site duplication seen after EhSINE1 insertion. The point of insertion is marked by an asterisk. Arrows show the three nicking hot spots of EN on the bottom strand.
Figure 2.
A 27 bp substrate is sufficient for EN activity. The hot spot #3 in the 176 bp DNA shown in Figure 1 was used for assay. Substrates of different lengths containing the hot spot were obtained by PCR amplification. Each substrate contained the indicated number of nucleotides upstream and downstream of the nick (as shown in the table). Substrates radiolabeled in the bottom strand were incubated with EN as described in Materials and Methods. The products were denatured at 95°C for 5 min and separated on urea–PAGE gels (8% acrylamide, panels 1 and 2; 12% acrylamide, panels 3 and 4). − Lanes, no EN added; + lanes contained 40–60 ng EN. In panels 1 and 2 sequencing reactions were run with the bottom strand primers to assist in mapping the nicking sites. In panels 3 and 4 oligonucleotides of known size were electrophoresed in parallel lanes as size markers (data not shown). Arrows indicate the size of bands expected from nicks at the insertion point in hot spot #3 (Figure 1). Electrophoresis was carried out at 40 W for 3 h.
Figure 3.
Nicking activity on substrates mutated in site # 3 and containing a normal site #2. Table shows bottom strand sequence of nucleotides surrounding the nicks in site #3 (Figure 1) in the control (C) and the various point mutations tested (lanes 1–15). Only the altered nucleotides are indicated. Substrates of length 117 bp were obtained by PCR amplification from the 176 bp template (position 60 to 176, Figure 1). The mutations were incorporated in the PCR primers. Lanes marked (–) were reactions without EN. The enzyme activity obtained for each substrate was quantitated using the normal site #2 as internal control, and was expressed as % activity obtained for normal site #3. The values in the table are average of three experiments. Arrows indicate position of nicks in site #2 and 3.
It had earlier been observed that a G residue was frequently present 3–4 nt upstream of the nick in most sites nicked by the EN (22). This may be significant given that the E.histolytica genome is highly A + T rich. (26). Site #3 contains three G residues upstream of the nick (Figure 1). Using the procedure described above, the G residues were changed singly, or in pairs and activities of these substrates quantified with respect to normal site #2. The results showed that changing a single G residue alone did not affect EN activity. However, changing the first two Gs (proximal to the nick) to T or A reduced the activity very significantly, although changing them to C had less effect (Figure 3). The third G also contributed to the EN activity (Figure 3, substrates 13, 14, 15 compared with substrate 6). Compared with the second G alone (Figure 3, substrate 13), the first G alone (Figure 3, substrate 16) retained greater activity. The results showed that the upstream G residues did play a significant role in substrate recognition by EN. From this data the preferred recognition sequence for EN was deduced to be 5′-GGCATT-3′.
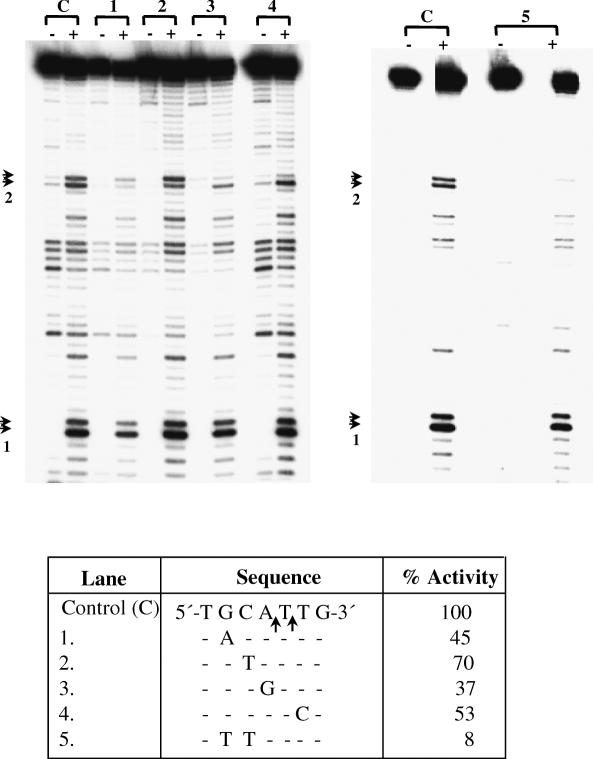
To validate the general applicability of this sequence requirement, site #2 in the 176 bp fragment was also analyzed by mutation analysis. A fragment of 85 bp (position 92 to 176) was PCR amplified from the 176 bp template. The ‘wild-type’ sequence of this site (bottom strand) was 5′-TGCATTG-3′. In agreement with the results obtained for site #3 it was found that changing the A to G reduced activity to 37%; changing C to T only reduced the activity to 70%, but changing GC to TT reduced the activity to 8% (Figure 4). From this data, the preferred recognition sequence was deduced to be 5′-GCATT-3′.
Figure 4.
Nicking activity on substrates mutated in site #2 (Figure 1) and containing a normal site #1. The experimental details are exactly as in Figure 3. The bottom strand sequence showing the nicks in site #2 is shown in the table (lane C), along with the various mutations tested. Substrates of length 85 bp were obtained by PCR amplification from the 176 bp template (position 92 to 176, Figure 1). Arrows indicate position of nicks in site #1 and 2.
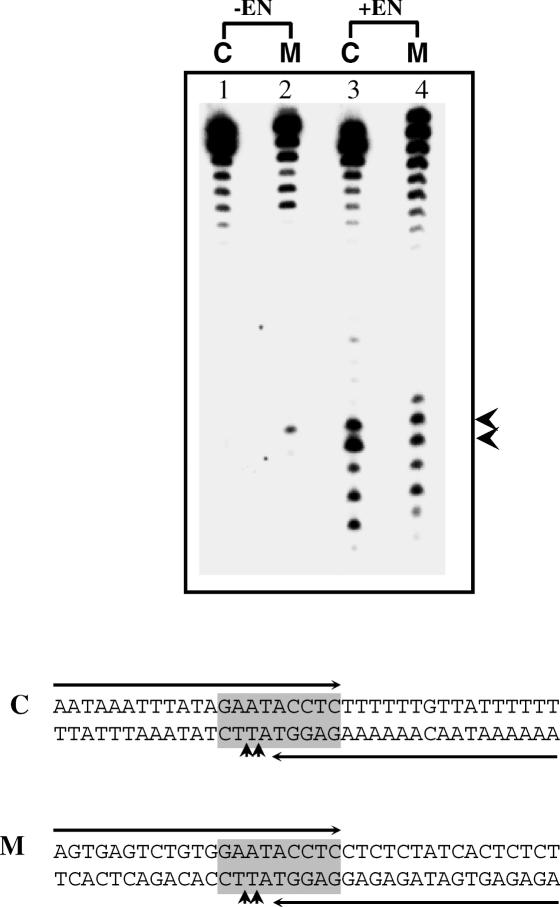
Nucleotides in the vicinity of the nicking site were checked for their role in substrate recognition. A 37 bp substrate containing 15 bp upstream and 22 bp downstream of the nick in site #3 was used. Transition mutations were introduced in every alternate nucleotide, keeping the central 9 bp (GAATACCTC) unchanged (Figure 5). This increased the GC content of the substrate from 13.5 to 46%. Enzyme activity in the mutated substrate was comparable with wild-type showing that the nucleotide sequence at a distance from the nicking site did not influence EN activity.
Figure 5.
Mutation analysis of nucleotides some distance away from nicking site #3 (Figure 1). The sequences of mutated substrate (M) and control substrate (C) are identical in the 9 bp shaded part. In the remaining part the mutated substrate is different from control in every alternate nucleotide, making it more GC rich (see text for details). The primers used for synthesizing the substrates are marked by horizontal arrows and bottom strand primer was labeled for both the substrates. The substrates were prepared by annealing the overlapping complementary oligos followed by gap filling and PCR. The substrates, after treating with EN, were separated through 12% denaturing polyacrylamide gel at 50–60 W for 3 h. Lane 1, untreated control DNA; lane 2, untreated mutant DNA; lane 3, EN treated control DNA; and lane 4 EN treated mutant DNA. Arrowheads indicate the position of nicks.
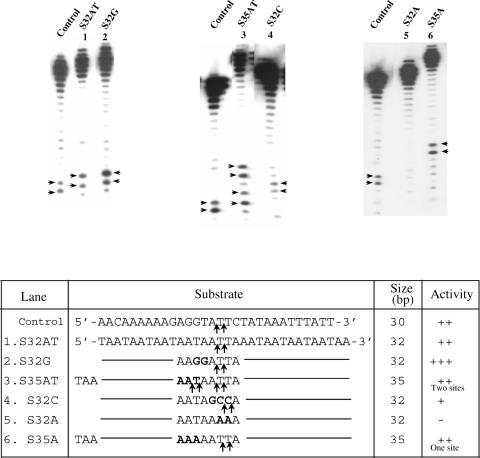
The above substrates were derived from a natural E.histolytica sequence in which EhSINE1 is known to insert. A completely artificial substrate was next tested for enzyme activity with EN. It was made AT-rich and variants containing two Cs or two Gs were also tested (Figure 6). The results confirmed the earlier observations with sites #2 and 3 in the 176 bp fragment:
- the enzyme prefers to nick between AT and TT (5′-ATT-3′),
- if 5′-ATT-3′ is changed to 5′-GCC-3′ the activity is reduced,
- inclusion of two Gs upstream of the nicking site (lower strand 5′-GGATT-3′) improves nicking efficiency,
- changing Ts to As at the nicking site abolishes activity and
- a minimum of 15 nu upstream of the nick seems to be necessary for activity.
Figure 6.
Nicking activity on an artificial substrate. Double-stranded oligos of the sequence indicated (bottom strand sequence shown) were used as substrates. Nicks were monitored in the radiolabeled bottom strands. A 30 bp fragment from site #3 (Figure 1) was used as control for enzyme activity. An artificial sequence (S32AT) was used as substrate and positions of nicks obtained are indicated by arrows. The various mutations introduced in S32AT are shown in bold. Three extra nucleotides were added in S35AT and S35A.
The above data shows that EhLINE1-encoded EN, while being flexible in its sequence requirement, has a strong preference for nicking the bottom strand between A and T residues located downstream of GC (5′-GCATT-3′). Sequences further upstream or downstream of this basic sequence had little or no effect on enzyme activity.
The preferred EN recognition sequence alone is insufficient for element insertion
The 176 bp fragment of E.histolytica DNA used as a substrate for EN in the above experiments has three hotspots of nicking by EN. Of these, EhSINE1 is known to insert at site #3. We tested whether site #2, which was also efficiently nicked by the EN, was used as an integration site for these elements. Primers were designed to PCR amplify the DNA surrounding site #2. These were used to amplify genomic DNA from two different E.histolytica strains (HM-1:IMSS and HK-9) (27). While primers flanking site #3 amplified a band expected of EhSINE1 integration at that site, primers from site #2 amplified only the unoccupied sequence from both strains. Thus, only a subset of EN-recognition sites appears to be utilized for integration of these elements. When the E.histolytica genome was searched for the string GGCATT (the preferred nicking sequence of EN), a total of 5754 instances were found, 3902 of which were in genic regions where no insertion of EhLINEs/SINEs has been found so far. The remaining 1852 were in intergenic regions but these were not occupied by the elements. Thus additional structure must be present in the vicinity of the GCATT motif in order that an element insert there. We have used a computational approach to determine whether target sites share some common features of DNA structure.
Structural features of the insertion site of EhSINE1 as deduced from computational analysis
We selected all the EhSINE1 insertion sites in which the 5′ end of EhSINE1 could be clearly identified. These numbered a total of 93 and were used to construct a set of pre insertion loci of EhSINE1 as follows. Each occupied EhSINE1 site was analyzed and the element, together with one of the target site duplications, was removed. The resulting sequence 40 bp upstream from insertion site to 40 bp downstream of it constituted one such locus. A negative dataset of 100 fragments was constructed which consisted of randomly chosen E.histolytica sequences of 80 bp; sequences from Borrelia burgdorferi genome (genomic A + T content similar to E.histolytica); Entamoeba and Plasmodium genes; and randomly shuffled sequences of the positive dataset. Insertion Site Finder (ISF), a machine learning tool, was developed based upon Bayes' rule (28) and AdaBoost (29) to incorporate the characteristics of insertion sites as signals for identification and prediction (manuscript in preparation). Specificity and sensitivity of the tool were determined. Specificity is defined as percentage of strings from the negative data set rejected by ISF at a particular cut-off. The cut-off value was determined during the training process. The pre insertion loci of EhLINEs/SINEs constituted the positive dataset. Sensitivity is defined as percentage of true examples detected by ISF based on the cutoff determined above. Both specificity and sensitivity were in the range of 89–97% (Table 1).
Table 1.
Specificity and Sensitivity of ISF
| Types of controls* | Specificity (%) | % (AT content) |
|---|---|---|
| Borrelia genome | 95 | 71 |
| Entamoeba genome | 90 | 72 |
| Entamoeba genes | 97 | 71 |
| Plasmodium genes | 91 | 74.5 |
| *1000 examples were used in each case | ||
| Type of elements | Sensitivity (%) | Number of examples |
| Eh SINE1 | 95 | 93 |
| EhLINE1 | 94 | 144 |
| EhLINE2 | 90 | 84 |
| EhSINE2 | 89 | 88 |
Positive and negative datasets were compared with respect to the following criteria: DNA sequence, structure, energy profiles, protein induced deformability and nucleosome location. Computation of nine measures was performed in a moving window of length 5 over each 80 bp segment, and the profile was averaged for all loci. In order to determine the significance of the results, all the positive datasets were scrambled and the parameters were estimated. There was no significant difference between scrambled positive sequences and the negative datasets. To test whether the sample size of the positive dataset (93) was sufficient, one-third of the data were randomly removed from the dataset. All the features observed with the entire dataset persisted, showing that the sample size was sufficient. Our results are summarized below.
- Thymine Excess: pre-insertion loci were specifically observed to be T enriched. The T content profile showed a significant peak (>75%) at position −22 bp relative to the insertion site (Figure 7a). This enhancement was evident for all window sizes ranging from 3 to 15. In contrast, the negative dataset had an essentially flat profile for T content. The Mann–Whitney test on the difference in the average T percentages for positive and negative examples gave a _P_-value <0.0001, indicating that the difference was significant.
- Bendability Profile: the bendability profile depicts the relative flexibility of the sequences flanking the insertion point. A region of low bendability (namely increased rigidity), between −40 to −10 of the insertion site, followed by a sharp peak at position −9, was characteristic of the positive dataset (Figure 7b).
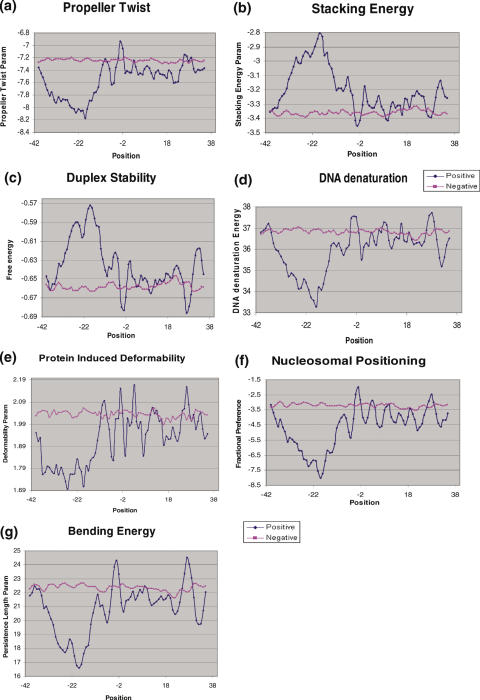
- Propeller Twist Profile: the propeller twist measures the tendency of twist about the long axis of the DNA strand: this makes the two bases of a pair non-coplanar (14). The propeller twist profile delineated a rigid region (−35 to −18 bp) changing to flexible region at around −10 bp (Figure 8a).
- Stacking energy: stacking energy provides a measure of the stability of a given DNA sequence (15). The peak observed between positions −35 to −19 bp upstream of the insertion site reflects a region, which would de-stack or melt easily (Figure 8b).
- Free Energy Profile: the duplex stability of a DNA depends on 10 different nearest-neighbor interactions (16,17). Higher negative values indicate higher stability. The insertion sites were found to have higher value (−0.57 kcal/mol) at the −18 position, suggesting that this region is destabilized more easily in comparison to the controls (Figure 8c).
- DNA denaturation energy: the melting of double-stranded DNA at the insertion site is necessary for retrotransposition to occur (18). A strong signal was observed in the region −35 to −11 indicating that only a relatively small amount of energy would be required to denature this region upstream of the insertion site (Figure 8d).
- Protein induced deformability: the sequence-dependent deformability of DNA is considered to be important for potential interaction of DNA with proteins (19,20). Since retrotransposition would require such interaction this parameter has a potential to be indicative of insertion sites (19). A region of low deformability was found between −37 to −14 bp followed by a region of high deformability (Figure 8e). Therefore, retrotransposition complex can form downstream of the low deformation area around the site of insertion.
- Nucleosomal related features: two different nucleosomal related features were used, namely the bending energy/persistence length (30) and nucleosomal positioning profiles (21,31). Both were computed as described in the Materials and Methods. Since nucleosomal density and nucleosome-induced changes in DNA can contribute to processes, such as transcription or recombination, these parameters are likely to influence retrotransposition events (32,33). The bending energy or persistence length profile for insertion site loci reveals a low energy region between positions −34 and −11 with significant dip of value (−16.5 nm persistence length) at position −19 (Figure 8g). The minimum in the profile indicates that nucleosome might be positioned in the vicinity of insertion site. Similar results were obtained using nucleosomal positioning profile (Figure 8f). A major difference between positive and negative datasets was obtained between positions −37 and −10.
Figure 7.
Computational analysis of pre-insertion Loci. (a) Profiles of T content and (b) DNA bendability of 80 bp segments of DNA derived from independent insertion sites. The arrow indicates site of insertion. The profiles (suitably averaged) for both positive and negative datasets are shown. The dark blue line indicates the positive dataset whereas magenta line represents the negative dataset. The yellow line denotes scrambled positive dataset and is shown only for T content profile, as similar results were obtained in the rest of the profiles.
Figure 8.
Structural and energetic analysis of pre-insertion loci. (a–g): the various parameters tested are indicated. Analysis was carried out as detailed in Figure 7.
When the 93 true insertion sites were tested with the nine measures listed above, for 10 of these sites none of the measures scored positive (namely they are not similar to the positive datasets shown in Figures 7 and 8). For the remaining 83 sites one or more of the measures scored positive, with more than half the sites scoring positive on four or more of the measures. The 5754 E.histolytica genomic sites containing the preferred EN nicking sequence were also tested in the same manner. We found that only in 8% of cases did these sites score positive on at least one of the above measures, whereas for a randomly selected set of 5754 sequences from the E.histolytica genome, 20% of the sites scored positive. This analysis suggests, therefore, that the number of unused ‘good’ sites for EhSINE1/LINE1 (namely those where the element can integrate in an efficient manner, but are presently unoccupied) in the E.histolytica genome may be small.
Computational analysis of DNA structure adopted by mutated substrates of the EhLINE1-EN
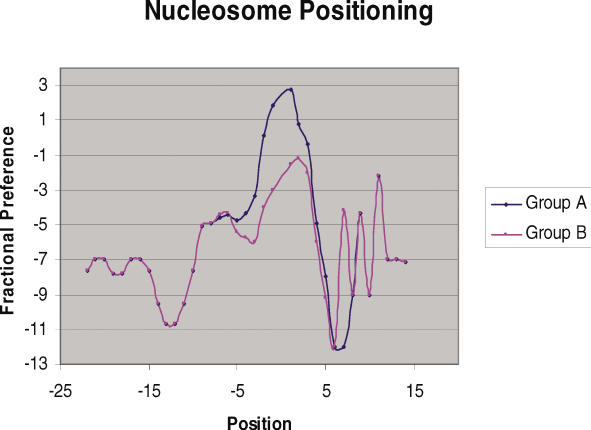
Since, DNA structure at pre insertion loci of EhSINE1 was distinct, we further checked to see if structure had an influence on EhLINE1-encoded EN activity as well. The various mutated substrates used to check EN activity (Figure 9) were analyzed for changes in DNA structure as a result of the introduced mutations. The substrates used were classified into two groups depending on whether the EN activity with the substrate was greater (group A) or lesser (group B) than 50% of the normal substrate. For both groups, the eight measures listed in the previous section were computed: all parameters (except for the T-rule) displayed significant differences (Mann–Whitney scores had _P_-values below 0.05). A representative graph is shown for the nucleosomal positioning measure in Figure 9: the blue curve is for Group A, while the magenta curve is for Group B. Differences at the mutation sites (−5 to +5) are clearly visible, suggesting that change in DNA structure is responsible for the change in enzyme activity.
Figure 9.
Nucleosomal positioning profiles of group A and group B sequences (suitably averaged), which illustrate the changes in DNA parameters due to the various mutations introduced in the vicinity of insertion site. These mutations are listed in Figure 3. Mutations resulting in EN activity >50% of normal were in group A while the rest were in group B. The _x_-axis represents the sequence position with respect to the insertion point whereas _y_-axis represents the value of fractional preference parameter at corresponding position. Position −5 to +5 bp represents the mutated region.
Insertion sites of many non-LTR retrotransposons share common structural features
To see if the physical features listed above for EhSINE1 insertion sites were shared by retrotransposon insertion sites in other genomes as well, a few selected genomes were analyzed using DNA SCANNER (Table 2). Site-specific as well as non site-specific elements were analyzed in each genome. A stretch of 40 bp upstream of each insertion point was used for this analysis. The downstream sequences were not included since they did not exhibit any novel features in E.histolytica. The elements TDD3, TRE3B and TRE3C were analyzed in D.discoideum. Almost all the features that characterize the insertion sites in E.histolytica are significant for TRE3C when compared with a carefully constructed negative dataset (randomly picked genomic sequences for non-site specific elements and genic sequences for site specific sequences), even after stringent filtering (≥18 nt). In contrast, insertion sites for the elements TRE3B and TDD3 in the same genome appeared to rely on only a subset of these properties (2 for TRE3B) or, as for TDD3, on other features. In D.melanogaster, insertion sites for R1 element scored positive for five of the properties, while Jockey was positive for six of them. Results of our analysis of several other elements are summarized in Table 2. We also considered elements, such as TX1, DONG and REX1 in Takifugu, but the low copy number of these elements did not permit clear conclusions.
Table 2.
Computational analysis of DNA structure at preinsertion loci of non-LTR elements in various genomes
| Repbase Id or NCBI accession nos | Organism | Site or non-site specific | Number of examples | Discriminating features between positive and negative dataset |
|---|---|---|---|---|
| TRE3C | D.discoideum | Dispersed | 6 | Nucleosomal positioning, propeller twist, stacking energy, duplex stability, DNA denaturation energy, protein induced deformability, bendability, bending stiffness |
| TRE3B | D.discoideum | Dispersed | 32 | Propeller twist, bendability |
| R1 | D.melanogaster | It specifically inserts in rRNA genes | 8 | Propeller twist, stacking energy, DNA denaturation energy, protein induced deformability, bending stiffness |
| Jockey | D.melanogaster | Dispersed | 37 | Nucleosomal positioning, propeller twist, duplex stability, DNA denaturation energy, bending stiffness, T rule |
| SLACS | Trypansoma brucei | Insert in the spliced leader exons of trypanosomes | 5 | Bending stiffness |
| L1 | B.mori | Information not available | 5 | Nucleosomal positioning, stacking energy, duplex stability, DNA denaturation energy,bending stiffness, T rule |
| Rex | Danio rerio | Insert in TAA repeats | 14 | Protein induced deformability |
While all the measures used in the present study to detect the insertion sites of elements of E.histolytica are not universally applicable in other genomes, the present observations suggest the possibility of subsets of these properties being pertinent for different organisms. Although, the structure and intensity of the signals relevant to each genome is distinct, there is sufficient overlap in the nature of the signals. One may therefore hypothesize that out of the common pool of features examined here, retrotransposons in a range of organisms will share some of these signals at their insertion sites.
DISCUSSION
Amongst parasitic protozoa E.histolytica is one of the few in which non-LTR retrotransposons occupy as much as 6–8% of its 23 Mb genome (4,34). From a phylogenetic standpoint it is important to understand whether this primitive organism shares the same mechanisms for insertion and maintenance of these elements in its genome as those adopted by metazoans. EhLINEs/SINEs are dispersed throughout the genome, with no apparent target specificity. Here, we investigate whether pre insertion sites of EhLINEs/SINEs have any distinguishing features that favor their selection for element insertion. The two parameters studied were DNA secondary structure of pre insertion sites and sequence hotspots for nicking by the EhLINE1-encoded EN. The general validity of our results with DNA structure of target sites was tested by extending the analysis to non-LTR retrotransposons in a few selected genomes.
Different parameters that probed structural, thermodynamic or nucleosome positioning features were employed in our computational analysis of target site sequences in order to detect unique features, which may be recognized by the invading retrotransposon (Table 2). This analysis showed that DNA structure is likely to be important for target site selection in many retrotransposons, although, of the features tested, none were common to insertion sites of elements in all genomes. The presence of unique DNA structure at insertion sites appears to hold both for site-specific and dispersed non-LTR elements. Similar observations with DNA transposons show that the requirement for specific DNA structure at the target site may be a common feature. The bacterial transposon Tn7 (35) and the D.melanogaster P element (25) are known to recognize optimal DNA structures, rather than specific sequences, for preferential insertion.
In our analysis of E.histolytica (Figures 7 and 8) the most significant outcome was that in all insertion sites of EhSINE1 the region −10 to −35 bp upstream of the insertion point showed a very distinct structure. This region was also T-rich. However, the observed profiles were not attributable to T-richness alone, since shuffling the sequences in the positive dataset (while keeping base composition constant) resulted in a flat profile. In addition, a whole genome scan of E.histolytica showed several thousand T-rich sites, which scored poorly with the other structural parameters, and indeed no element was found inserted in these sites. The −10 to −35 region of a true insertion site tended to be rigid as indicated by propeller twist and bendability measures. This is due to the presence of dinucleotides, which remain rigid as shown by negative values in the profiles (Figure 8a). Data from the various parameters used for structural analysis, put together, show that this upstream region is rigid, can melt easily and is amenable to interaction with proteins/nucleosomes in its vicinity.
We have examined the sequence requirements of the EhLINE1-encoded EN and find that although the enzyme is not strictly sequence-specific (although belonging to the REL-ENDO class), it is possible to assign a consensus sequence 5′-GCATT-3′ at which the enzyme nicks most efficiently between A-T and T-T. The upstream G was not essential for activity, but its inclusion greatly improved nicking efficiency. In the context of the E.histolytica genome which is highly A + T rich (26), this enhancement of nicking activity in the vicinity of G could serve to limit the enzyme targets in vivo. The consensus nicking sequence described above was deduced from in vitro assays. Whether the same applies to in vivo nicking by EN is not clear at the moment since this sequence was not readily visible at all genomic sites where EhLINE1/SINE1 elements had inserted. It is possible that the consensus sequence is obscured after element insertion due to the addition of some non templated nucleotides by reverse transcriptase (36). This could complicate extrapolation of the pre insertion sequence from an occupied site, especially in the 3′-flank.
Although, the in vitro consensus sequences preferred by EN are widely distributed in the genome, both in genic as well as intergenic regions, EhLINE1/SINE1 insertions have not been found within any gene so far. The preference of EhLINE1/SINE1 for intergenic regions would minimize direct damage to genes by insertional inactivation. It is possible that EhLINE1/SINE1 can insert in genic regions but are excluded due to selection pressure, as reported for human Alus, which can insert in A + T-rich DNA but are found more frequently in G + C-rich DNA (37,38).
In our earlier model of EhLINE1/SINE1 retrotransposition we had proposed a melting of the DNA duplex in the T-rich upstream region to allow positioning of the element RNA by virtue of hydrogen bonding between its T-rich 3′-tail and the A-rich bottom strand of DNA (22). In this context it is significant that the same upstream region does indeed display structural features that would enable it to interact with the element RNA in the RNP particle. From this analysis we postulate that insertion hot spots of EhLINE1/SINE1 are regions of DNA that adopt a favorable structure over a stretch of ∼25 bp (for interaction with the RNP particle), and that contain an EN-recognition sequence (upper strand 5′-AATGC-3′, or variants thereof) at a distance of ∼10 bp downstream of this structure. Similar schemes have also been proposed for selection of target sites by mammalian (39,40) and plant (41) retroposons based on structural features of target DNA and EN preferences. The contribution of these factors to target selection appears to be a common feature of non-LTR retrotransposons.
In summary, our combination of computational and enzymatic analysis of pre-insertion loci can lead to a more realistic understanding of why these genomic loci are preferred for retrotransposition.
Acknowledgments
This work was supported by grants from Department of Science and Technology and Department of Biotechnology, India. P.K.M. and K.R. are recipients of a research fellowship from CSIR and ICMR, respectively. Funding to pay the Open Access publication charges for this article was provided by Jawaharlal Nehru University.
Conflict of interest statement. None declared.
REFERENCES
- 1.Craig N.L. In: Mobile DNA II. Craig N.L., Craigie R., Gellert M., Lambowitz A.M., editors. Washington, D.C.: American Society for Microbiology; 2002. pp. 3–11. [Google Scholar]
- 2.Ostertag E.M., Kazazian H.H. Biology of mammalian retrotransposons. Ann. Rev. Gen. 2001;35:501–538. doi: 10.1146/annurev.genet.35.102401.091032. [DOI] [PubMed] [Google Scholar]
- 3.WHO/PAHO/UNESCO. Report of a consultation of experts on Amoebiasis. Weekly Epidemiological Report of the World Health Organization. 1997;72:97–99. [Google Scholar]
- 4.Bakre A.A., Rawal K., Ramaswamy R., Bhattacharya A., Bhattacharya S. The LINEs and SINEs of Entamoeba histolytica: comparative analysis and genomic distribution. Exp. Parasitol. 2005;110:207–213. doi: 10.1016/j.exppara.2005.02.009. [DOI] [PubMed] [Google Scholar]
- 5.Anbar M., Bracha R., Nuchamowitz Y., Li Y., Florentin A., Mirelman D. Involvement of a short interspersed element in epigenetic transcriptional silencing of the amoebapore gene in Entamoeba histolytica. Eukaryot. Cell. 2005;4:1775–1184. doi: 10.1128/EC.4.11.1775-1784.2005. [DOI] [PMC free article] [PubMed] [Google Scholar]
- 6.Luan D.D., Korman M.H., Jakubczak J.L., Eickbush T.H. Reverse transcription of R2Bm RNA is primed by a nick at the chromosomal target site: a mechanism for non-LTR retrotransposition. Cell. 1993;72:595–605. doi: 10.1016/0092-8674(93)90078-5. [DOI] [PubMed] [Google Scholar]
- 7.Eickbush T.H., Malik H.S. Origin and evolution of retrotransposons. In: Craig N.L., Craigie R., Gellert M., Lambowitz A.M., editors. Mobile DNA II. Washington, D.C.: American Society for Microbiology; 2002. pp. 1111–1144. [Google Scholar]
- 8.Feng Q., Schumann G., Boeke J.D. Retrotransposon R1Bm endonuclease cleaves the target sequence. Proc. Natl Acad. Sci. USA. 1998;95:2083–2088. doi: 10.1073/pnas.95.5.2083. [DOI] [PMC free article] [PubMed] [Google Scholar]
- 9.Christensen S., Pont-Kingdon G., Carroll D. Target specificity of the endonuclease from the Xenopus laevis non-long terminal repeat retrotransposon, Tx1L. Mol. Cell. Biol. 2000;20:1219–1226. doi: 10.1128/mcb.20.4.1219-1226.2000. [DOI] [PMC free article] [PubMed] [Google Scholar]
- 10.Eickbush T.H. R2 and related site-specific non-long terminal repeat retrotransposons. In: Craig N.L., Craigie R., Gellert M., Lambowitz A.M., editors. Mobile DNA II. Washington, D.C.: American Society for Microbiology; 2002. pp. 813–835. [Google Scholar]
- 11.Volff J.N., Korting C., Froschauer A., Sweeney K., Schartl M. Non-LTR retrotransposons encoding a restriction enzyme-like endonuclease in vertebrates. J. Mol. Evol. 2001;52:351–360. doi: 10.1007/s002390010165. [DOI] [PubMed] [Google Scholar]
- 12.Brukner I., Sanchez R., Suck D., Pongor S. Sequence-dependent bending propensity of DNA as revealed by DNase I: Parameters for trinucleotides. EMBO J. 1995;18:1812–1818. doi: 10.1002/j.1460-2075.1995.tb07169.x. [DOI] [PMC free article] [PubMed] [Google Scholar]
- 13.Dickerson R.E., Chiu T.K. Helix bending as a factor in protein/DNA recognition. Biopolymers. 1997;44:361–403. doi: 10.1002/(SICI)1097-0282(1997)44:4<361::AID-BIP4>3.0.CO;2-X. [DOI] [PubMed] [Google Scholar]
- 14.Hassan M.A.E., Calladine C.R. Propeller-twisting of base-pairs and the conformational mobility of dinucleotide steps in DNA. J. Mol. Biol. 1996;259:95–103. doi: 10.1006/jmbi.1996.0304. [DOI] [PubMed] [Google Scholar]
- 15.Ornstein R.L., Rein R., Breen D.L., MacElroy R. Optimized potential function for calculation of nucleic-acid interaction energies I. Base stacking. Biopolymers. 1978;17:2341–2360. doi: 10.1002/bip.1978.360171005. [DOI] [PubMed] [Google Scholar]
- 16.Sugimoto N., Nakano S., Yoneyama M., Honda K. Improved thermodynamic parameters and helix initiation factor to predict stability of DNA duplexes. Nucleic Acids Res. 1996;24:4501–4505. doi: 10.1093/nar/24.22.4501. [DOI] [PMC free article] [PubMed] [Google Scholar]
- 17.Breslauer K.J., Frank R., Bolcker H., Marky L.A. Predicting DNA duplex stability from the base sequence. Proc. Natl Acad. Sci. USA. 1986;83:3746–3750. doi: 10.1073/pnas.83.11.3746. [DOI] [PMC free article] [PubMed] [Google Scholar]
- 18.Blake R.D. Denaturation of DNA. In: Meyers R.A., editor. Encyclopedia of Molecular Biology and Molecular Medicine. Vol. 2. NY: Wiley-VCH; 1996. pp. 1–19. [Google Scholar]
- 19.Olson W.K., Gorin A., Lu X.J., Hock L.M., Zhurkin V.B. DNA sequence-dependent deformability deduced from protein-DNA crystal complexes. Proc. Natl Acad. Sci. USA. 1998;95:11163–11168. doi: 10.1073/pnas.95.19.11163. [DOI] [PMC free article] [PubMed] [Google Scholar]
- 20.Olson W.K., Zhurkin V.B. Modeling DNA deformations. Curr. Opin. Struct. Biol. 2000;10:286–297. doi: 10.1016/s0959-440x(00)00086-5. [DOI] [PubMed] [Google Scholar]
- 21.Goodsell D.S., Dickerson R.E. Bending and curvature calculations in B-DNA. Nucleic Acids Res. 1994;22:5497–5503. doi: 10.1093/nar/22.24.5497. [DOI] [PMC free article] [PubMed] [Google Scholar]
- 22.Mandal P.K., Bagchi A., Bhattacharya A., Bhattacharya S. An Entamoeba histolytica LINE/SINE pair inserts at common target sites cleaved by the restriction enzyme-like LINE-encoded endonuclease. Eukaryot. Cell. 2004;3:170–179. doi: 10.1128/EC.3.1.170-179.2004. [DOI] [PMC free article] [PubMed] [Google Scholar]
- 23.Sambrook J., Russell D.W. Molecular Cloning: A Laboratory Manual. 3rd edn. NY: Cold Spring Harbor Laboratory Press, Cold Spring Harbor; 2001. [Google Scholar]
- 24.Altschul S.F., Madden T.L., Schaffer A.A., Zhang J., Zhang Z., Miller W., Lipman D.J. Gapped BLAST and PSI-BLAST: a new generation of protein database search programs. Nucleic Acids Res. 1997;25:3389–3402. doi: 10.1093/nar/25.17.3389. [DOI] [PMC free article] [PubMed] [Google Scholar]
- 25.Liao G.C., Rehm E.J., Rubin G.M. Insertion site preferences of the P transposable element in Drosophila melanogaster. Proc. Natl Acad. Sci. USA. 2000;97:3347–3351. doi: 10.1073/pnas.050017397. [DOI] [PMC free article] [PubMed] [Google Scholar]
- 26.Gelderman A.H., Bartgis I.L., Keister D.B., Diamond L.S. A comparison of genome sizes and thermal denaturation-derived base composition of DNAs from several members of Entamoeba (histolytica group) J. Parasitol. 1971;57:912–916. [PubMed] [Google Scholar]
- 27.Bhattacharya S., Bhattacharya A., Diamond L.S. Comparison of repeated DNA from strains of Entamoeba histolytica and other Entamoeba. Mol. Biochem. Parasitol. 1988;27:257–262. doi: 10.1016/0166-6851(88)90045-x. [DOI] [PubMed] [Google Scholar]
- 28.Gelman A., Carlin J.B., Stern H.S., Rubin D.B. Fundamentals of Bayesian Inference. In: Gelman A., Stern H.S., editors. Bayesian Data Analysis. NY: Chapman & Hall; 1995. pp. 1–27. [Google Scholar]
- 29.Freund Y., Schapire R.E. A short introduction to boosting. J. Jap. Soc. for Art. Int. 1999;14:771–780. [Google Scholar]
- 30.Sivolob A.V., Kharpunov S.N. Translational positioning of nucleosomes on DNA: the role of sequence-dependent isotropic DNA bending stiffness. J. Mol. Biol. 1995;247:918–931. doi: 10.1006/jmbi.1994.0190. [DOI] [PubMed] [Google Scholar]
- 31.Satchwell S.C., Drew H.R., Travers A.A. Sequence periodicities in chicken nucleosome core DNA. J. Mol. Biol. 1986;191:659–675. doi: 10.1016/0022-2836(86)90452-3. [DOI] [PubMed] [Google Scholar]
- 32.Cost G.J., Golding A., Schlissel M.S., Boeke J.D. Target DNA chromatinization modulates nicking by L1 endonuclease. Nucleic Acids Res. 2001;29:573–577. doi: 10.1093/nar/29.2.573. [DOI] [PMC free article] [PubMed] [Google Scholar]
- 33.Ye J., Yang Z.Y., Hayes J.J., Eickbush T.H. R2 retrotransposition on assembled nucleosomes depends on the translational position of the target site. EMBO J. 2002;21:6853–6864. doi: 10.1093/emboj/cdf665. [DOI] [PMC free article] [PubMed] [Google Scholar]
- 34.Bhattacharya S., Bakre A., Bhattacharya A. Mobile genetic elements in protozoan parasites. J. Genet. 2002;81:73–86. doi: 10.1007/BF02715903. [DOI] [PubMed] [Google Scholar]
- 35.Kuduvalli P.N., Rao J.E., Craig N.L. Target DNA structure plays a critical role in Tn7 transposition. EMBO J. 2001;20:924–932. doi: 10.1093/emboj/20.4.924. [DOI] [PMC free article] [PubMed] [Google Scholar]
- 36.Luan D.D., Eickbush T.H. RNA template requirements for target DNA-primed reverse transcription by the R2 retrotransposable element. Mol. Cell. Biol. 1995;15:3882–3981. doi: 10.1128/mcb.15.7.3882. [DOI] [PMC free article] [PubMed] [Google Scholar]
- 37.Lander E.S., Linton L.M., Birren B., Nusbaum C., Zody M.C., Baldwin J., Devon K., Dewar K., Doyle M., FitzHugh W., et al. Initial sequencing and analysis of the human genome. Nature. 2001;409:860–921. doi: 10.1038/35057062. [DOI] [PubMed] [Google Scholar]
- 38.Jurka J., Kohany O., Pavlicek A., Kapitonov V.V., Jurka M.V. Duplication, coclustering, and selection of human Alu retrotransposons. Proc. Natl Acad. Sci. USA. 2004;101:1268–1272. doi: 10.1073/pnas.0308084100. [DOI] [PMC free article] [PubMed] [Google Scholar]
- 39.Jurka J., Klonowski P. Integration of retroposable elements in mammals: selection of target sites. J. Mol. Evol. 1996;43:685–689. doi: 10.1007/BF02202117. [DOI] [PubMed] [Google Scholar]
- 40.Jurka J., Klonowski P., Trifonov E.N. Mammalian retroposons integrate at kinkable DNA sites. J. Biomol. Struct. Dyn. 1998;15:717–721. doi: 10.1080/07391102.1998.10508987. [DOI] [PubMed] [Google Scholar]
- 41.Tatout C., Lavie L., Deragon J.M. Similar target site selection occurs in integration of plant and mammalian retroposons. J. Mol. Evol. 1998;47:463–470. doi: 10.1007/pl00006403. [DOI] [PubMed] [Google Scholar]
