Whole-genome comparison of Leu3 binding in vitro and in vivo reveals the importance of nucleosome occupancy in target site selection (original) (raw)
Abstract
Sequence motifs that are potentially recognized by DNA-binding proteins occur far more often in genomic DNA than do observed in vivo protein–DNA interactions. To determine how chromatin influences the utilization of particular DNA-binding sites, we compared the in vivo genome-wide binding location of the yeast transcription factor Leu3 to the binding location observed on the same genomic DNA in the absence of any protein cofactors. We found that the DNA-sequence motif recognized by Leu3 in vitro and in vivo was functionally indistinguishable, but Leu3 bound different genomic locations under the two conditions. Accounting for nucleosome occupancy in addition to DNA-sequence motifs significantly improved the prediction of protein–DNA interactions in vivo, but not the prediction of sites bound by purified Leu3 in vitro. Use of histone modification data does not further improve binding predictions, presumably because their effect is already manifest in the global histone distribution. Measurements of nucleosome occupancy in strains that differ in Leu3 genotype show that low nucleosome occupancy at loci bound by Leu3 is not a consequence of Leu3 binding. These results permit quantitation of the epigenetic influence that chromatin exerts on DNA binding-site selection, and provide evidence for an instructive, functionally important role for nucleosome occupancy in determining patterns of regulatory factor targeting genome-wide.
DNA sequence plays an important role in directing DNA-binding proteins to their genomic targets. However, even in the relatively simple case of the Saccharomyces cerevisiae (hereafter “yeast”) genome, the typical degenerate 5–15-bp binding site of a given transcription factor occurs several thousand times. The ability of ChIP-chip (Chromatin ImmunoPrecipitation with microarray detection) to determine the genome-wide distribution of protein–DNA interactions has shown that sequences with high predicted affinity for a transcription factor occur far more often than actual protein–DNA interactions in vivo (Ren et al. 2000; Iyer et al. 2001; Lieb et al. 2001). Thus, despite well-established biochemical methods that can determine the binding specificity of a DNA-binding protein with great precision (Fried and Crothers 1981; Oliphant et al. 1989; Tuerk and Gold 1990), and the near-perfect accuracy of genomic DNA sequence, the genome-wide distribution of DNA-binding proteins in living cells cannot be currently predicted with accuracy (Lieb et al. 2001; Liu and Clarke 2002). In addition to its DNA-binding specificity, commonly represented as a Position Weight Matrix (PWM) (Schneider and Stephens 1990), the in vivo genomic distribution of a DNA-binding protein is also influenced by factors that affect DNA binding-site utilization. We use the term DNA binding-site utilization to describe the process by which a protein distinguishes DNA motifs that are actually bound from those that remain unbound but have indistinguishable sequence characteristics.
The most widely cited mechanism by which differential binding-site utilization could occur is by controlling access to DNA through variations in local chromatin composition. In particular, nucleosome positioning and occupancy have long been thought to mediate differential accessibility to consensus binding sequences that occur in regulatory regions (Almer et al. 1986; Venter et al. 1994; Mai et al. 2000; Sekinger et al. 2005; Yuan et al. 2005; Segal et al. 2006). Nucleosomes are the most basic unit of chromatin, and their stability and positioning can be regulated by the incorporation of histone variants, post-translational modifications to histones, and inherent properties of DNA sequence that favor or disfavor nucleosome formation (Sekinger et al. 2005; Yuan et al. 2005; Millar and Grunstein 2006; Segal et al. 2006). In addition, chromatin-remodeling enzymes can affect the kinetics of chromatin formation by catalyzing nucleosome assembly, disassembly, or movement (Mellor 2005). These mechanisms cause nucleosome occupancy to be relatively low in most yeast promoters, independent of the nucleosomal disruption that can occur upon transcriptional activation (Lee et al. 2004; Lieb and Clarke 2005; Pokholok et al. 2005; Sekinger et al. 2005; Yuan et al. 2005; Segal et al. 2006).
To detect and quantify the influence of chromatin on the genomic binding-site utilization of specific transcription factors requires rigorous characterization of DNA binding-site specificity and the development of new computational approaches to model the effects of nonsequence influences. Here, we use the Leu3 protein (hereafter Leu3) to perform a set of conceptually simple genome-wide experiments that address these issues. We compared the binding location of purified Leu3 on naked genomic DNA to the genomic binding location of Leu3 expressed in a living cell. The in vitro experiments reveal the intrinsic specificity of Leu3 for naked DNA at all genomic locations, while the in vivo experiments reflect the combined effect of this intrinsic specificity, plus the influence of “extrinsic factors” such as chromatin, protein cofactors, and other in vivo phenomena like nuclear compartmentalization. We chose Leu3 as a model system for these analyses specifically because it is not known to interact directly with any other transcription factors. The simplicity of its interactions with regulatory regions allowed us to use Leu3 as a probe for binding-site accessibility without the complication of cooperative interactions that could plague other systems. By comparing the preferred sites of Leu3–genome interactions in the two experiments, we reasoned that we could quantitate the influence of extrinsic factors on binding-site utilization.
Results
Most Leu3 motifs in the genome occur by chance
Leu3 functions as a homodimer to control the transcription of genes involved in branched-chain amino acid metabolism, and binds to the palindromic consensus site CCGGNNCCGG (Friden and Schimmel 1988). To catalog all sites of potential interaction between Leu3 and genomic DNA, we scanned the genome for Leu3-binding motifs (see Supplemental Methods). We used the Leu3 binding site in the LEU4 promoter as a standard, since it has the lowest predicted affinity among all known functional Leu3 sites (see Supplemental Methods). In total, 687 genomic loci had a predicted Leu3 affinity at least as high as that of the LEU4 promoter site. Of these, 585 sites occur in ORFs or 3′-UTRs, and only 102 occur in promoter regions. The 585 sites in non-promoters is consistent with the number that would be expected to arise by chance (see Supplemental Methods). In promoters, 71 of the 102 high-affinity sites would have been expected to occur by chance, suggesting that some strong Leu3 motifs have been retained in promoters through selection. Nonetheless, the majority of Leu3 motifs in the yeast genome seem to occur by chance. This phenomenon is a general property of the short, degenerate motifs recognized by most eukaryotic transcription factors.
Leu3 binds to different genomic locations in vivo and in vitro
To determine the DNA-binding specificity of Leu3 in the absence of chromatin and other interacting factors, we used a previously developed in vitro method called DIP-chip (DNA ImmunoPrecipitation followed by microarray detection) (Liu et al. 2005). In DIP-chip, protein–DNA complexes are isolated from a mixture of purified protein and naked genomic DNA, and bound fragments are identified by microarray hybridization. Unlike conventional methods, including binding-site selection (SELEX) (Oliphant et al. 1989; Tuerk and Gold 1990) and EMSA (Fried and Crothers 1981), DIP-chip uses the same genomic DNA template that is found in living cells. This allows direct comparison with in vivo results obtained through standard ChIP-chip experiments.
We performed four sets of experiments: in vivo ChIP-chip of full-length Leu3, in vivo ChIP-chip of Leu3 DNA-binding domain (Leu3-DBD), in vitro DIP-chip of Leu3-DBD at 4 nM protein concentration, and in vitro DIP-chip of Leu3-DBD at 40 nM protein concentration (Methods). To compare the results, the number of Leu3 targets in each data set was determined at four false discovery rates (FDRs): 0.5%, 1%, 5%, and 10% (Fig. 1A; Discussion). We consider in detail the four Leu3 target sets defined at 1% FDR.
Figure 1.

Leu3 binds different genomic locations in vivo and in vitro. (A) Each vertical column contains comparisons of two Leu3 genomic binding experiments. Each horizontal row shows pairwise comparisons at the indicated FDR (0.05%, 1%, 5%, or 10%). FDRs were calculated based on _P_-values derived from a modified single-array error model (SAEM: Methods). Red circles represent the number of targets bound in the indicated in vivo ChIP-chip experiments, and black circles represent the number of targets bound in the indicated in vitro DIP-chip experiments. In all columns, the circle to the left corresponds to the upper-most label on the top row, while the circle to the right corresponds to the lower label. Numbers to the left and right of the circles indicate the total number of Leu3-bound loci. The number of Leu3-bound loci common to both experiments is indicated in the intersection of the circles. (B) In vivo experiments (red) and in vitro experiments (black) are more highly correlated with each other than are data across experiment types (gray). For each pairwise comparison, the Pearson’s correlation of all log (SAEM; _P_-values) is shown.
As expected, in DIP-chip experiments Leu3-DBD binds to more loci at higher in vitro concentrations than it does at lower concentrations (60 loci at 40 nM vs. 23 loci at 4 nM). Also as expected, targets bound at lower concentrations are largely a subset of the targets bound at higher protein concentration; 19 of the 23 targets identified at 4 nM were independently identified at 40 nM. Expectations for the in vivo experiments are not as clearly defined, but one might expect loci bound by the Leu3-DBD to be a subset of the loci bound by full-length Leu3. Indeed, all 22 in vivo Leu3-DBD targets are a subset of full-length Leu3 in vivo targets. Thus, there was a high level of concordance between genomic loci bound by Leu3 among independently performed in vivo experiments and among independently performed in vitro experiments (Fig. 1B). The internal consistency of the DIP-chip and ChIP-chip experiments, combined with our ability to derive high-quality Leu3 binding motifs from all four data sets (Fig. 2A), suggested that both our DIP-chip and ChIP-chip procedures were technically sound.
Figure 2.

Motifs derived from in vitro methods predict in vivo protein–DNA interactions as accurately as motifs derived from in vivo ChIP-chip. (A) Six PWM representations of the Leu3 binding motif, derived from the indicated binding experiments (Methods). (B) A schematic representation of motif scoring by GOMER. Briefly, given a PWM for a binding motif N bp long, GOMER calculates a relative equilibrium binding constant (_K_d) for each sequence window of length N in the genome, and from this _K_d value calculates the probability of being bound at some free protein concentration (typically equal to the _K_d of the best site in the genome). GOMER then uses these individual binding probabilities to calculate the probability of binding to at least one site within a genomic sequence of interest. The graph (right) indicates the probability that sites A, B, and C (left) will be occupied by a factor recognizing the motif shown, as a function of protein concentration. The thick line shows the probability that any one of the three sites will be bound at the given concentration. In this example, if the protein is present at a concentration equal to the _K_d of the best site in the genome, there is a 75% chance that the shown promoter will be bound at either A, B, or C at a given point in time (gray circle). (C) AUC-ROC values (_y_-axis) for prediction of full-length Leu3 ChIP-chip results based on motifs derived from the indicated data set. Error bars indicate the 95% confidence interval estimated using bootstrap resampling of occupancy scores and Leu3 enrichments. (D) Similar motifs are derived from genomic targets unique to DIP or ChIP.
However, when in vivo experiments were compared to in vitro experiments, the concordance observed within experiment type did not hold. Of the 23 in vitro targets of Leu3-DBD bound at 4 nM, only five are also targets of the identical Leu3-DBD protein in vivo (1% FDR) (Fig. 1A). Furthermore, while 19 of the 23 loci bound at 4 nM in vitro were among the 60 targets bound at 40 nM in vitro, only 15 were found among the 611 loci bound by full-length Leu3 in vivo (Fig. 1A). The divergence between in vivo targets and in vitro targets can also be seen when all of the data from each of the experiments are compared in aggregate. The data from in vitro experiments is more highly correlated with other independent in vitro experiments than with in vivo experiments (Fig. 1B). The same high correlation within experiment type is observed for the in vivo experiments (Fig. 1B). These data provide evidence that Leu3 associates with an overlapping but distinct set of genomic loci in vitro and in vivo.
Leu3 exhibits functionally indistinguishable sequence specificity in vitro and in vivo
The difference between loci bound in vitro and in vivo could reflect differences in the intrinsic DNA binding specificity in the two environments. To address this possibility, motifs were derived from the Leu3 in vivo data and compared to motifs derived from in vitro binding data. We used a previously devised (Liu et al. 2005) systematic and objective two-step procedure that utilizes the motif discovery programs BioProspector (Liu et al. 2001) and MDscan (Liu et al. 2002). This performance-based procedure was designed to ensure that the number of input sequences has a minimal effect on the results. The PWM that is ultimately chosen to represent each of the four experiments (Fig. 2A) maximizes the distinction between protein-bound and unbound sequences (Liu et al. 2005). Motifs were also derived from previously published EMSA and SELEX data that used the same Leu3-DBD construct (Liu and Clarke 2002). Superficially, all six PWMs resemble each other, with minor differences apparent at individual positions (Fig. 2A).
To determine if there was any functional distinction among the five motifs that were derived using Leu3-DBD, we asked how well each of the motifs predicted the results of an independent data set, in this case in vivo binding of full-length Leu3. For each selected motif, we used a biophysically principled algorithm (Granek and Clarke 2005) to predict the probability that at least one site probed by each microarray feature would be occupied by Leu3. This probability, which is based on the given PWM and genomic DNA sequence alone, is called the “occupancy score” (Fig. 2B). The degree to which high Leu3 occupancy scores were predictive of enrichment in a given experiment was represented by the Area Under the Curve of a Receiver–Operator Characteristic plot (AUC-ROC) (Methods).
We found that all the motifs, whether defined in vitro or in vivo, explain in vivo binding of full-length Leu3 indistinguishably well. Measured by either AUC-ROC (Fig. 2C) or Pearson’s correlation coefficient (data not shown), the predictive ability of occupancy scores calculated using PWMs derived from in vitro data was within the 95% confidence interval of that of the occupancy scores calculated in an analogous way from in vivo data. This suggests that the small differences between in vivo-defined and in vitro-defined PWMs may be the result of the motif discovery algorithms or the limited sample size of the motifs themselves in each enriched sequence set. Any real difference in binding specificity is apparently small. Therefore, despite different solution conditions, potential differences in DNA conformation, and the presence or absence of chromatin and other protein components, the DNA motifs bound by Leu3 in vitro and in vivo are functionally indistinguishable.
The Leu3 binding motif can be derived from targets unique to ChIP-chip or unique to DIP-chip
To this point we have presented evidence that the DNA-binding specificity of Leu3 is equivalent in vivo and in vitro, but that different instances of the Leu3 motif are bound in the two conditions. If that is true, one should be able to derive functionally indistinguishable Leu3 consensus binding sites using only the targets that are unique to either ChIP-chip experiments or DIP-chip experiments, excluding sequences that are bound in both. We performed motif finding as described above on the 14 targets that were unique to the Leu3-DBD ChIP-chip experiment, and the 52 targets that were unique to the 40 nM Leu3-DBD DIP-chip experiment (at 1% FDR) (Fig. 2D). We were able to derive the Leu3 motif from both data sets, indicating that the motifs previously derived from each group were not driven solely by the eight targets held in common between them. Furthermore, motifs derived exclusively from bound sequences unique to the in vivo or in vitro experiments predict in vivo targets equally well, and perform almost as accurately as motifs derived when loci common to both experiment types are included (Fig. 2C).
Accounting for nucleosome occupancy improves prediction of protein–DNA interactions in vivo, but not in vitro
Given indistinguishable DNA-sequence specificities, differences in bound loci must be determined by features of the in vivo environment that affect binding-site utilization. We investigated whether one of the determinants of binding-site utilization in vivo was nucleosome occupancy. Relative nucleosome occupancy throughout the yeast genome has been determined using ChIP-chip assays of histone H3 and myc-tagged H4 (Lee et al. 2004; Pokholok et al. 2005), and by micrococcal nuclease-based mapping across chromosome III (Yuan et al. 2005). If nucleosomes tend to prevent DNA binding by Leu3, then prediction of in vivo binding could be improved by incorporating an assumed inhibitory effect of nucleosome occupancy on binding-site affinity.
Using nucleosome occupancy data from every locus in the genome (Lee et al. 2004), we weighted potential Leu3 binding sites by assuming that a twofold greater nucleosome occupancy inhibits protein–DNA interactions by a fixed amount (Methods) (Fig. 3A). By varying the weight of this assumed inhibitory effect, new sets of Leu3 occupancy scores were obtained for every locus in the genome. These nucleosome-weighted Leu3 occupancy scores show a significant improvement in their ability to predict Leu3 binding in vivo as determined in the full-length Leu3 ChIP-chip experiment (Fig. 3A). These results are consistent with a previous comparison of target recognition by the HinfI endonuclease in vivo and in vitro (Mai et al. 2000). Quantitation of HinfI cleavage at the several loci showed that the effect of nucleosome occupancy ranges from fivefold to 20-fold.
Figure 3.

Accounting for nucleosome occupancy improves target prediction in vivo but not in vitro. Improvement of in vivo Leu3–DNA interaction prediction assuming an inhibitory effect of nucleosome occupancy. All Leu3 occupancy scores were calculated using the EMSA-derived PWM. (A) Different weighting factors are shown on the _x_-axis. Error bars indicate 95% confidence intervals calculated by bootstrap resampling (Methods). (B) For in vitro 40 nM DIP-chip data, weighting does not significantly improve the AUC-ROC value. (C) Same as A, but excluding ORFs and intergenic sequences that lie downstream from two convergently transcribed genes. The effects of weighting on full-length Leu3 ChIP-chip experiments (solid circles) and Leu3-DBD DIP-chip (open circles) are plotted. (D) Higher-resolution nucleosome occupancy data (Yuan et al. 2005) do not offer improvement in predictions over that achieved by low-resolution data. High-resolution data are restricted to chromosome III. Weighting with low-resolution data as in panel A yields a strong improvement in predictive power (black). However, higher-resolution data do not perform as well (open circles). The high-resolution data were most predictive when computationally “blurred” over 300 bp (squares).
It was possible, in principle, that the improvement in prediction of Leu3 binding in vivo is not due to nucleosome occupancy itself, but rather to some unknown feature of the DNA sequence that is correlated independently with higher intrinsic Leu3 binding and lower nucleosome binding. If that were the case, sequences that share this hypothetical sequence feature would be expected to be nucleosome-poor in vivo and better-bound by Leu3 in vitro. Weighting by nucleosome occupancy would then be expected to improve our ability to predict in vitro bound loci even though no nucleosomes are present in the DIP-chip assay. However, weighting yields no improvement in ability to predict sites of in vitro binding (Fig. 3B). This argues against a hypothetical sequence feature that independently promotes Leu3 binding and low nucleosome occupancy, and instead supports the hypothesis that binding-site utilization in living cells is influenced directly by nucleosome occupancy.
Weighting scores by nucleosome occupancy improves predictionof Leu3 binding among promoters
Promoters, as a group, tend to have lower nucleosome occupancy than coding sequences, thus sequence-specific transcription factors can be expected to bind preferentially to these regions. However, even within promoters, most binding sites occur by chance rather than by functional selection. Therefore, differences in nucleosome occupancy among promoters could still be a factor in distinguishing which promoters are actually bound by a given transcription factor. To test this, the same nucleosome-weighting analysis described above was repeated, but this time applied only to promoter features. We observed a strong improvement in prediction of Leu3-bound promoters, similar in degree to the improvement observed for the genome as a whole (Fig. 3C). We conclude that the difference in nucleosome occupancy among promoters is as important in determining the location of bound transcription factor as are the differences between promoters and coding sequences.
Use of higher-resolution nucleosome occupancy data does not further improve binding predictions
The nucleosome occupancy data used to weight Leu3 occupancy scores was obtained by histone ChIP-chip using relatively low-resolution DNA microarrays, in which most features of the array correspond to an entire ORF or intergenic region (Lee et al. 2004). We repeated the nucleosome weighting analysis using ChIP-chip data detected using microarrays with an average probe density of 265 bp (Pokholok et al. 2005), and data from a nuclease-based nucleosome-mapping experiment detected with oligonucleotides tiled every 20 bp (Yuan et al. 2005). In the latter experiment, only chromosome III and a small number of additional genes were probed. Surprisingly, we were unable to find evidence that higher-resolution nucleosome mapping experiments improve the ability to predict Leu3 binding beyond that observed using low-resolution nucleosome data. Comparison of the Lee et al. (2004) and Pokholok et al. (2005) ChIP-chip data sets shows that they have a very similar beneficial effect on the prediction of Leu3 binding sites, with AUC-ROC values of 0.842 and 0.845, respectively (95% confidence intervals 0.824–0.860 and 0.828–0.863). The very high-resolution micrococcal-nuclease-based nucleosome mapping data (Yuan et al. 2005) also did not improve predictions over that provided by the lower-resolution data (Fig. 3D).
We “blurred” the high-resolution data by window averaging over 100-, 200-, 300-, 400-, 500-, 1000-, and 1500-bp intervals. Averaging values over a distance of 300 bp afforded the best performance, but the blurred high-resolution data still did not perform as well as the low-resolution data, as measured by AUC-ROC (Fig. 3D) or by correlation coefficient (data not shown). In addition to using the raw data to guide the weighting, we also used a value generated by Yuan et al. that ranges from 1 to 18, and relates to the maximum likelihood estimation of the nucleosome state for each probe (Yuan et al. 2005). This value was used on its own or averaged over the above intervals. These values performed more poorly than the raw data (data not shown).
The low number of Leu3-bound features on chromosome III did not provide the statistical power required to conclude with certainty that the low-resolution data were more effective at predicting binding. However, specific examples of genomic features that were preferentially enriched by Leu3 binding in vitro or in vivo support the conclusion that the overall nucleosome occupancy in a region, rather than the specific location of a nucleosome, best predicts Leu3 binding (Supplemental Fig. 1).
The most-favored position of a nucleosome may not generally be the critical determinant of binding-site accessibility if binding of nucleosomes and transcription factors can be effectively equilibrated by chromatin remodeling enzymes. Perhaps regions of low nucleosome occupancy are more accessible not just because they have more accessible sites initially, but also because there are more ways in which their nucleosomes can be rearranged to accommodate a bound transcription factor. Alternatively, perhaps regions of high nucleosome occupancy are structured such that access to sites is blocked even if the position of an individual nucleosome would seem to suggest accessibility. These or other mechanisms, coupled with the possibility that the lower-resolution data may be less noisy at the relevant scale, could produce the observed results. Additional experiments are required to determine what underlying biological processes, if any, cause the better performance of low-resolution data.
Use of histone modification data does not further improve binding predictions
We also asked if binding occurs preferentially in regions with particular histone modifications, after taking into account differences in histone occupancy. We used data from Pokholok et al. (2005), expressed as the ratios of modification enrichment to H3, to weight our Leu3 DNA-binding motifs. If there were preferential binding to regions with a particular modification after taking the amount of histone present into account, then we would expect the AUC-ROC value using the modification-weighted Leu3 motif scores to be higher than that achieved by the unweighted Leu3 motif score. However, none of the AUC-ROC values using data for modified histones exceeds the unweighted AUC-ROC value (Supplemental Table 1). Our interpretation is that there is no preferential binding to regions containing modifications when normalized to the H3 occupancy. For example, acetylation could promote transcription factor binding, but in this interpretation that effect is already manifest in the global H3 distribution, presumably because of decreasing the stability of the nucleosome.
We also analyzed the effect of H2A.Z, using data from Guillemette et al. (2005). Up-weighting Leu3 binding sites with a high H2A.Z/H2B ratio causes AUC-ROC values to drop quite sensitively as a function of the weight parameter. The unweighted value of 0.756 (positive association between predicted and observed binding) drops to 0.5 (no association), and then further drops before leveling off near 0.35 (negative association). This value is highly significantly less than 0.5, meaning that sequences with relatively high H2A.Z-weighted Leu3 binding potential are less likely to be bound than sequences with more modest H2A.Z-weighted binding potential. One interpretation of this result is that Leu3 binding is selected against in regions of high H2A.Z. This could be related to high H2A.Z binding in telomeric regions, or to possible biases in the distribution of H2A.Z in active and inactive promoters (Guillemette et al. 2005; Zhang et al. 2005). However, the converse weighting scheme, down-weighting Leu3 binding sites in high H2A.Z/H2B regions and up-weighting sites in low H2A.Z/H2B regions, has only a marginal effect on AUC-ROC values (the unweighted value of 0.756 improves to 0.768). Thus, while exceptionally H2A.Z rich regions may be poorly bound by Leu3, H2A.Z poor regions do not strongly promote binding.
Binding predictions improve because Leu3-bound loci are nucleosome-poor, but low nucleosome occupancy at bound loci is not a consequence of Leu3 binding
We sought to examine in more detail the factors that distinguish Leu3 sites that are bound in vivo from those that are not. We compared the nucleosome occupancy properties of the 100 loci most highly enriched in the full-length Leu3 ChIP-chip experiment to the 100 loci that had the highest predicted affinity to Leu3, but were not bound in vivo. Nearly 60% of the Leu3 loci bound in vivo were among the bottom 10th percentile with regard to nucleosome occupancy (Fig. 4A). In contrast, most of the 100 unbound loci with the highest predicted affinities based on DNA sequence occurred in chromatin with high (greater than 70th percentile) nucleosome occupancies (Fig. 4B). Note that these 100 unbound loci are predicted to be bound better (average GOMER score of 0.58) than the 100 loci that were, in fact, bound by the protein in vivo (average GOMER score of 0.31).
Figure 4.

Leu3-bound motifs are nucleosome-poor, but low nucleosome occupancy is not a consequence of Leu3 binding. (A) The 100 loci most highly enriched in Leu3 ChIP-chip experiments (by SAEM _P_-value) were divided into 10 bins according to their nucleosome occupancies relative to all other loci, as measured in a wild-type strain. The number of loci in each bin is shown on the _y_-axis. “Leu3 motif score” refers to the GOMER score of the arrayed locus (for all arrayed loci, the average was 0.09, median 0.06). (B) Same as A, except the 100 loci that had the highest predicted affinity to Leu3 and were not bound in vivo were plotted. Leu3 binding affinities were predicted using GOMER. (C) Nucleosome occupancy in strains overexpressing a gene encoding the Leu3 activation domain but no Leu3 binding domain (Leu3-, log2 ratios; _y_-axis) was highly correlated with nucleosome occupancy in strains overexpressing full-length Leu3 protein (Leu3poe, log2 ratios; _x_-axis). Thus, low nucleosome occupancy at Leu3-bound promoters is not dependent on Leu3 binding. The positive _y_-intercept and the slope slightly greater than 1 suggest there may be a subtle effect of Leu3 on nucleosome occupancy, but as shown in Figure 5, nucleosome occupancies determined in the absence of Leu3 are just as predictive of Leu3 binding as nucleosome occupancies determined in the presence of Leu3. (D) Same as C, but for the 76 Leu3 targets not bound by any other transcription factor (Lee et al. 2002; Harbison et al. 2004).
We have not yet addressed the question of whether the binding of Leu3 was itself the cause of nucleosome depletion at Leu3 promoters. If this were the case, nucleosome-weighted scores would correlate better with binding, but would not be a meaningful predictor of binding. To determine if nucleosome occupancy could be instructive for Leu3 binding, we performed histone H3 and H4 ChIP-chip experiments in a strain overexpressing full-length Leu3, and in a strain lacking Leu3 binding activity (Methods). The data show that nucleosome occupancy at loci normally bound by Leu3 is very similar in the two strains (Fig. 4C). This indicates that low nucleosome occupancy at most Leu3-bound promoters is not a consequence of Leu3 binding, and that nucleosome occupancy has the capacity to be instructive in guiding transcription factors to their genomic targets.
Low nucleosome occupancy at Leu3 targets could be due to the binding of other transcription factors, since most Leu3-bound loci are also bound by at least one other transcription factor. To examine this possibility, we analyzed the 76 Leu3 target loci that are not reported to be bound by any other transcription factor (Lee et al. 2002; Harbison et al. 2004). As is the case for the full set of Leu3-bound loci, the loci bound only by Leu3 exhibit nucleosome occupancy similar to that observed in strains that either overexpress or are deleted for Leu3 (Fig. 4D). This suggests that the low nucleosome occupancy that drives Leu3 binding to specific loci can arise via a mechanism independent of other sequence-specific factors.
Nucleosome occupancy data from strains that lack Leu3 binding activity and strains that overexpress Leu3 are equally predictive of Leu3 binding
If nucleosome occupancy is truly instructive in guiding transcription factors to their targets, nucleosome occupancies determined in the absence or overexpression of the factor should be equally able to predict the binding location of that factor in a wild-type cell. To test this, we compared the ability of nucleosome occupancy data from three strains to predict Leu3 binding: (1) wild-type, (2) a strain that lacked Leu3 binding activity, and (3) a strain that overexpressed Leu3. To make meaningful comparisons, log2 nucleosome occupancy values from each data set were normalized such that each data set exhibited unit variance (Fig. 5A).
Figure 5.

Quantitation of chromatin contributions to DNA binding-site utilization. (A) Histogram of histone ChIP-enrichment values and their use in weighting predicted Leu3 binding affinities. The plotted histone enrichment values are based on seven independent histone H3 and histone H4 ChIP-chip experiments (Methods) (Lee et al. 2004). The standard deviation of the combined distribution (red bar, ±1 standard deviation = 0.223 units) was used to determine the weight (_upper x_-axis) applied to a given log2 enrichment value (_lower x_-axis). Weights calculated at −4, −3, −2, −1, 0, 1, and 2 standard deviations from the median using a weight parameter of 4 are shown on the _upper x_-axis as an example. In the actual calculation used to weight motifs for the prediction of Leu3 binding, unbinned nucleosome occupancy values were used. Telomeric probes, mitochondrial probes, and probes for which no Leu3 ChIP data were available were excluded from the analysis. A small number of probes (∼0.2%) have histone ChIP-enrichment values that extend beyond the boundaries of this plot. The left and right edges of the red bar correspond to _Z_-scores of −1 and 1, respectively. (B) AUC-ROC at different weight parameters using nucleosome occupancy data obtained from the indicated strains. (C) ROC curves showing the effect of nucleosome occupancy weighting on the prediction of Leu3 binding in vivo. GOMER occupancy scores were calculated for all array probes using the Leu3 EMSA-derived PWM, weighted with nucleosome occupancy data from the strain indicated (green, wild type; red, overexpressed Leu3 activation domain [AD] only, with no Leu3 DNA binding activity; brown, overexpressed full-length Leu3). ROC curves plot the fraction of Leu3 ChIP-enriched probes (FDR = 1%) that exceed a given occupancy score versus the fraction of unenriched probes that meet the same threshold, effectively calculated at all possible threshold values. Nucleosome occupancies were normalized as described in A, and used to weight predicted Leu3 _K_a values at a weight parameter of 4.
To quantitate the predictive ability of nucleosome occupancy data from the three strains, we next optimized the weighting parameter applied to each nucleosome occupancy value (Methods). All three nucleosome occupancy data sets produced maximal increases in the predictive ability of DNA sequence at a weighting parameter value very near 4 (Fig. 5B). The improvement rises dramatically at very low values of the weight parameter, before plateauing and then gradually decreasing. The high sensitivity to low values is striking because the distribution of nucleosome enrichment values from which the applied weights are calculated is very narrow: in the wild-type data set, 95% of loci have nucleosome enrichment values within 35% of the median, between 0.73 and 1.37 (this range represents 2 standard deviations in the log[enrichment] transformation, SD). At a weight parameter of 4, the most nucleosome-rich of these features (+2 SD from the median) have their predicted affinities down-weighted 16-fold (42), while the most nucleosome-poor of these features (−2 SD from the median) have their affinities up-weighted 16-fold. For a weight parameter of 2, the applied weights are equal to the square root of those applied with a weight parameter of 4, but these much lower weights are still quite effective at improving the prediction of Leu3-bound sequences.
The effect of these weights on the predictive power of Leu3 occupancy scores allows quantitation of the contribution of nucleosome occupancy to binding-site utilization, as averaged over a large number of sites. We used the optimal weight parameter value to compare ROC curves generated by nucleosome occupancy data collected from the three strains. Consistent with an instructive role for nucleosomes in guiding transcription factor binding-site utilization, nucleosome occupancy data from the three strains were equally predictive of Leu3 binding (Fig. 5C).
Low nucleosome occupancy directs Leu3 to biologically relevant targets
We next asked whether the differential binding-site utilization that we observed in vivo was important for directing Leu3 to biologically relevant targets. Promoter targets of Leu3 were analyzed to classify the functional categories of their downstream genes (Table 1). Promoter targets bound both in vivo and in vitro were significantly enriched for downstream genes that are involved in branched-chain amino acid metabolism. Genes downstream of promoters bound only in the in vivo experiments are also relevant to amino acid metabolism and its associated biological functions. In contrast, genes downstream of promoters exclusive to in vitro experiments are neither similar in function nor related to metabolism. Thus, the nucleosome-influenced binding-site utilization exhibited in vivo directs Leu3 to biologically relevant targets, whereas in the absence of nucleosomes and other cofactors, biologically relevant targets are not reliably bound.
Table 1.
Biologically relevant targets are bound more efficiently in vivo than in vitro

For many sequence-specific transcription factors, nucleosome occupancy predicts bound promoters nearly as accurately as DNA sequence
Genome-scale ChIP experiments have been performed on >100 sequence-specific DNA-binding proteins in yeast (Lee et al. 2002; Harbison et al. 2004), as well as on histones (Lee et al. 2004; Pokholok et al. 2005; Yuan et al. 2005). We performed a combined analysis of these data to compare the genomic location of sequence-specific binding proteins with local nucleosome occupancy. The analysis shows that sequence-specific DNA-binding proteins are, in general, bound preferentially to sequences with a low local nucleosome occupancy (Fig. 6A).
Figure 6.

For many sequence-specific DNA-binding proteins, nucleosome occupancy alone predicts promoters bound in vivo almost as accurately as DNA sequence. (A) Most transcription factors are preferentially bound to regions of relatively low nucleosome occupancy. ROCs were used to quantitate the value of low nucleosome occupancy in predicting the in vivo distribution of the indicated transcription factors. ChIP-enriched sequences (Lee et al. 2002) were defined at 10% FDR. Only the 41 ChIPs yielding at least 20 enriched sequences were analyzed. Pho4 (black) appears to be significantly associated with regions of higher nucleosome occupancy, possibly because of different growth conditions under which ChIP-chip and nucleosome data were collected. (B) Motifs derived from bound sequences often predict binding only slightly better (within an AUC-ROC of 0.1) than does nucleosome occupancy alone. Of the 41 factors in A, a significant DNA-sequence motif could be derived for the 34 plotted here (see Supplemental Table 2 for tabular data). PWMs were used to calculate occupancy scores for every intergenic region. ROCs were then used to quantitate the ability of the occupancy scores derived from the factor-specific motifs to predict the in vivo distribution of the corresponding factor (_y_-axis). On the _x_-axis are the nucleosome-occupancy-based AUC-ROCs. AUC-ROC values under 0.5 were converted to (1 − AUC-ROC). Of the transcription factors, 17/34 fall between dashed lines, which indicate AUC-ROC values within 0.1. (Filled black circle) Pho4.
To further explore the relationship between ChIP enrichment, DNA-sequence motifs, and nucleosome occupancy, we developed a cross-validated strategy for motif discovery (E.F. Kloss, D.M. Noll, and N.D. Clarke, unpubl.). The strategy identifies sets of ChIP-enriched sequences for which a significant explanatory motif can be obtained. Significant motifs were discovered for 34 transcription factors, or about a third of the ChIP-chip set examined. Even for this subset of transcription factors, for which the association with a binding motif is strong, nucleosome occupancy is, for many of the factors, nearly as good a predictor of IP-enrichment as genomic sequence (Fig. 6B).
Discussion
An integrated strategy for quantitation of chromatin effects on DNA binding-site utilization
We have described a strategy that integrates genomic, biochemical, and computational approaches to quantitate the contribution of chromatin to DNA binding-site utilization in vivo. The strategy has at its foundation a comparison of DIP-chip and ChIP-chip results, which allows measurement of the distribution of a protein on the same genomic DNA template in the presence and the absence of chromatin.
As part of the strategy for quantitating chromatin effects on binding-site utilization, it was important to first rule out whether differences in intrinsic DNA-binding specificity could explain differences in the pattern of protein–DNA interaction in vivo and in vitro. Using performance-based metrics for measuring the predictive value of binding motifs, we showed that the motifs derived from the DIP-chip and ChIP-chip experiments are functionally indistinguishable in their ability to explain an independent ChIP experiment (Fig. 2). This practical approach to the assessment of PWM similarity is applicable to any situation in which it is desirable to compare two PWMs and for which data are available for cross-prediction by the PWMs.
We then sought to determine whether differences in binding-site utilization can be attributed, at least in part, to chromatin. PWM-derived scores at each locus were weighted with nucleosome occupancy data, which significantly improved the ability of those scores to predict the distribution of Leu3, as determined by an independent experiment (Fig. 3). Quantitation of chromatin influence was achieved by calculating the nucleosome-weight parameter that maximized the predictive value of the weighted score. The optimal weighting value is a reflection of the degree to which nucleosome occupancy affects the binding pattern of a given transcription factor. Determination of this weighting value for each protein in a given system will allow meaningful comparisons of the effect that chromatin exerts on in vivo binding relative to DNA sequence.
Extensibility
The experimental data presented here are specific to yeast Leu3, and further generalizations should be made cautiously. We specifically chose Leu3 because it lacks known cofactors, and is regulated primarily through its activation domain, not at the level of DNA binding. While it is likely that Leu3 binds autonomously to target DNA, this is not true for all factors. There are numerous reported cases of targeting by cooperative interactions with another protein bound at a nearby site. Furthermore, it is not yet clear whether mammalian or other eukaryotic cells contain and use nucleosome-depleted regions to the extent observed in yeast.
However, the general strategy we describe for quantitating the influence of nucleosome occupancy (see the previous section) should be useful in identifying organisms and cell types in which nucleosome occupancy does play a strong role, and in such cases it should be possible to quantitate the relative effect on individual transcription factors. The exceptional conservation of the structure and function of nucleosomes among eukaryotes, along with the mechanisms for regulating their stability and position, suggest that chromatin also plays an instructive role in DNA binding-site selection in more complex systems.
Cause and effect in nucleosome occupancy and transcription factor binding
The data indicate that the correlation between low nucleosome occupancy and transcription factor binding is predominantly a consequence of pre-existing patterns of nucleosome occupancy that subsequently affect binding-site selection. This conclusion was reached by showing that nucleosome occupancies measured in the absence of Leu3 binding have the same ability to improve the prediction of Leu3 binding location in vivo as nucleosome occupancies measured in wild-type strains that express Leu3 (Fig. 5). Furthermore, nucleosome occupancies measured in a strain overexpressing Leu3 are not significantly better at predicting binding of Leu3 protein in that strain, than are nucleosome occupancies measured in a strain lacking Leu3 DNA-binding activity entirely.
Free protein concentration, the number of observed targets in vivo and in vitro, and the preferential binding of sites in vivo
ChIP experiments in yeast typically yield only a small number of detectably bound sequences (Lee et al. 2002). Since our goal was to probe binding-site accessibility in a statistically significant manner (as opposed to identifying physiologically relevant target genes), it was desirable to express epitope-tagged Leu3 at higher-than-physiological levels. Using this strategy, we were successful in obtaining hundreds of detectably bound loci from an estimated 1000–5000 full-length Leu3 proteins per cell (about eight to 40 times higher than endogenous Leu3 expression) (data not shown). We were also able to obtain a sufficiently large number of bound sequences in vitro using 40 nM Leu3. The actual number of in vivo and in vitro locations detected is, of course, a function of the effective concentration of protein and DNA in the two experiments. There is no relevance to the fact that the number of targets in one experiment is greater than the other. For example, Leu3 expressed at endogenous levels yields fewer bound sequences than are obtained with 40 nM Leu3 in vitro, but it yields more bound sequences than are obtained with 4 nM Leu3. What was critical for our purposes was obtaining sufficiently large numbers of bound sequences under both conditions.
The level of expression we achieved is comparable to the levels found for some abundantly expressed transcription factors (Ghaemmaghami et al. 2003), and corresponds to a total nuclear concentration on the order of 100–500 nM. However, it is the effective free concentration of the DNA-binding protein, not the total concentration, that is relevant to the probability of binding. This is an extraordinarily difficult value to estimate, but the many sites that are bound only in the in vivo experiment suggests that the effective free concentration in vivo is substantially higher than the concentrations used in vitro (Fig. 1). Thus, very weak binding sites that can be detectably bound in vivo cannot be detected in vitro.
Why then are there also sites that are uniquely bound in the in vitro experiment? The simplest explanation is that the effective local concentration of Leu3 in vivo was very high, but that the great majority of low-affinity sites were not bound in vivo because they were obscured by chromatin. Accordingly, moderate or even high-affinity sites can be bound in vitro, and yet not be bound in vivo. An alternative possibility is that other proteins bind cooperatively with Leu3 to promote binding at certain sites in vivo, although there is no evidence for a cooperatively bound partner for Leu3.
Use of nucleosome occupancy for improvement of ChIP-chip-based motif identification
The weighting of binding sites based on nucleosome occupancy can also improve the discovery of motifs from ChIP data. We found that conventional motif discovery from the full-length Leu3 ChIP data was complicated by the large number of enriched sequences and by the effects of nucleosome occupancy on the quality of the binding sites selected. To avoid these problems, we assumed that features bound despite relatively high nucleosome occupancies were more likely to have high-affinity Leu3 sites than were features that were bound but have low nucleosome occupancies. We weighted the full-length Leu3 ChIP-chip enrichment values such that higher nucleosome occupancy increased the Leu3 “enrichment” value. By varying the degree of assumed binding inhibition, new sets of weighted Leu3 “enrichment” values were calculated for every locus in the genome and used as input to motif-discovery programs to generate a PWM (Methods). The motif generated with the weighted values (Fig. 2A) was similar to the established Leu3 consensus site, and better correlated to DIP-chip data, than the motif discovered without weighting. Use of nucleosome occupancy weighting for improvement of motif identification from ChIP-chip data is a generally applicable, powerful strategy for estimating the intrinsic specificity of DNA binding in the absence of nucleosome influence.
Control of nucleosome occupancy as the endpoint of epigenetic mechanisms
Nucleosome occupancy can be specified or controlled by several mechanisms, including DNA-sequence variation, chromatin modifications, incorporation of histone variants, DNA modifications, or recruitment of remodeling enzymes. It is remarkable that distilling all of these mechanisms into a single variable, nucleosome occupancy, has such a profound influence on the binding pattern of a regulatory factor. Using the histone modification data themselves seems to provide no additional information. Given this, it is possible that the influence of nucleosome occupancy on regulatory factor binding patterns represents the endpoint of many epigenetic mechanisms that control utilization of genetic information. This hypothesis would be consistent with the idea of a simplified and cumulative epigenetic code (Henikoff 2005) and with the idea that the DNA sequence of eukaryotic genomes has the capacity to directly encode nucleosome position and occupancy (Sekinger et al. 2005; Yuan et al. 2005; Segal et al. 2006). The generation of distinct genomic binding patterns with identical genomic DNA, as we demonstrate here, may represent the essence of epigenetic phenomena observed in living eukaryotic cells.
Methods
DIP-chip and ChIP-chip experiments
The DIP-chip experiments and Leu3 DBD ChIP-chip experiments analyzed here were identical to those performed in Liu et al. (2005). Difficulties in the expression and purification of active full-length Leu3 protein prevented its use in DIP-chip experiments.
For “full-length Leu3” ChIP experiments, BY4720-leu3Δneo (Brachmann et al. 1998) was transformed by plasmid pRS416-TDH3-MBP Leu3R643G, which overexpresses full-length Leu3R643G (see also Supplemental Methods). Leu3R643G is constitutively active regardless of α-isopropylmalate availability (Kirkpatrick and Schimmel 1995; Wang et al. 1999). ChIP was performed as described (Lieb et al. 2001) with anti-MBP (Abcam ab65) and protein G agarose (Sigma 83,219), except that following the IP, the protein G agarose was washed twice with lysis buffer (0.1% SDS, 0.5% Triton X-100, 20 mM Tris-Cl at pH 8.0, 150 mM NaCl, and protease inhibitors), twice with lysis buffer + 2 mM EDTA (pH 8.0), once with LiCl Buffer (0.25 M LiCl, 1% NP-40, 1% deoxycholate, 1 mM EDTA at pH 8.0, and 10 mM Tris-Cl at pH 8.0), and twice with TE (1 mM EDTA at pH 8.0 and 10 mM Tris-Cl at pH 8.0). The input protein–DNA mixture and the IP-enriched DNA were collected by a QIAquick PCR purification kit (Qiagen) after reversing cross-links for 6 h at 65°C. MBP- Leu3R643G ChIPs were performed in replicate seven times. Control experiments were identical to those in Liu et al. (2005), and were performed seven times using an MBP-tagged DNA-binding-deficient Leu3 fragment (deletion of residues 13–601).
Microarray hybridization
ChIP-enriched DNA and genomic DNA from input extract (used as a hybridization reference) were amplified using a random primer, PCR-based method (Lieb et al. 2001). In half of the experiments, IP-enriched DNA was labeled with Cy5 and the reference DNA with Cy3, while in the other half the fluors were reversed. The PCR-based microarrays and data collection procedures are described in Rao et al. (2005).
_P_-values, false discovery rate cutoffs, and estimation of confidence intervals
The significance of enrichment measured at each feature, expressed as a _P_-value, was estimated using a modified single-array error model (Liu et al. 2005). The term “false discovery rate” (FDR) refers to the fraction of target sequences that meet a _P_-value cutoff that are expected to meet that cutoff just by chance. The FDR is defined as (P)(T)/B, where P is the _P_-value cutoff, T is the total number of potential targets for which binding _P_-values have been determined, and B is the number of targets meeting the _P_-value threshold. For a given desired FDR, the least stringent _P_-value cutoff that yields an FDR equal to less than the desired value is used as the threshold.
To generate 95% confidence intervals for AUC-ROC values, the R statistics program was used to generate 1000 bootstrap resamplings of the microarray features with their associated GOMER occupancy scores and DIP- or ChIP-enrichment values. AUC-ROC values were calculated for the bootstrapped samples and ranked. The 26th and 925th AUC-ROCs were defined as the lower and higher end of the 95% confidence interval, respectively.
Motif discovery
Leu3-DBD motifs were discovered as in Liu et al. (2005) (see also Supplemental Methods). For the full-length Leu3 binding motif, we did the following: For each array feature, i, we calculated a weighted _P_-value for Leu3 binding according to

where Nuc_i_ is the nucleosome enrichment ratio for the array feature and Nucref is a reference enrichment ratio, specifically the average enrichment ratio for rDNA-encoding features. W is a weight parameter. Values of W equal to 4, 16, 64, and 256 were tried and for each the weighted _P_-values were used to select the top 20, 40, 60, 80, or 100 features. Motifs were then discovered and evaluated against the weighted ChIP data as described previously (Liu et al. 2005). The motif that best correlated with the ChIP data is shown in Figure 2A. For calculation of the expected number of genomic Leu3 motifs, see the Supplemental Methods.
Leu3 occupancy scores and nucleosome weighting
Predicted occupancy scores for Leu3 and other transcription factors were calculated using GOMER, a computer program that estimates binding probabilities in a physically principled manner (Fig. 2B; Supplemental Methods; Granek and Clarke 2005).
The effect of nucleosome occupancy on predicted Leu3 binding was assessed by modifying the predicted _K_d values for Leu3 binding at each site according to the nucleosome occupancy in that region,

where _K_d is the predicted equilibrium constant based only on the sequence and PWM, W is a weighing parameter that was varied systematically, Nucsite is the nucleosome occupancy in the genomic region spanning the site, and Nucref is the nucleosome occupancy of a reference point. In Figure 5, where we compare weightings using nucleosome occupancy data from different strains, we normalized the histone enrichment ratios within each experiment to the standard deviation for that experiment. Thus, the weight in those cases is calculated as
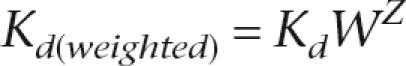
where
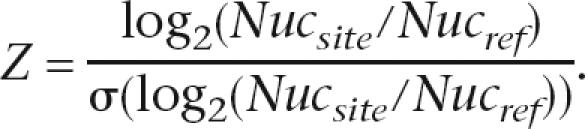
Nucleosome occupancy was derived from the modified single array error model as described (Liu et al. 2005). Nucleosome occupancies higher than the reference result in higher predicted _K_d values for the transcription factor binding site (i.e., lower predicted affinity) and nucleosome occupancies that are lower result in lower _K_d values (i.e., higher predicted affinity). We typically used the median nucleosome occupancy for all probes as the reference, but the choice is arbitrary and a change in reference has an identical effect on all _K_d values. The term “nucleosome occupancy” is used here as shorthand for enrichment ratios in the case of histone ChIP experiments and for nuclease-resistance enrichment ratios in the case of the high-resolution nucleosome mapping experiments (Yuan et al. 2005; see also Supplemental Methods).
Data availability
Additional information, including DNA-sequence definitions, validation of sequence coordinates, and details of the Gene Ontology (GO) analysis used in Table 1 can be found in the Supplemental Methods. All raw data can be downloaded at the UNC Microarray Database (https://genome.unc.edu) or via GEO accession number GSE5785.
Acknowledgments
This work was supported by NIH grants to N.D.C. (GM065179) and J.D.L. (HG02577 and GM072518). We thank Ellen Kloss and David Noll for the PWMs used in Figure 6, and Ai Li Yeo for technical assistance.
Footnotes
References
- Almer A., Rudolph H., Hinnen A., Horz W., Rudolph H., Hinnen A., Horz W., Hinnen A., Horz W., Horz W. Removal of positioned nucleosomes from the yeast PHO5 promoter upon PHO5 induction releases additional upstream activating DNA elements. EMBO J. 1986;5:2689–2696. doi: 10.1002/j.1460-2075.1986.tb04552.x. [DOI] [PMC free article] [PubMed] [Google Scholar]
- Brachmann C.B., Davies A., Cost G.J., Caputo E., Li J., Hieter P., Boeke J.D., Davies A., Cost G.J., Caputo E., Li J., Hieter P., Boeke J.D., Cost G.J., Caputo E., Li J., Hieter P., Boeke J.D., Caputo E., Li J., Hieter P., Boeke J.D., Li J., Hieter P., Boeke J.D., Hieter P., Boeke J.D., Boeke J.D. Designer deletion strains derived from Saccharomyces cerevisiae S288C: A useful set of strains and plasmids for PCR-mediated gene disruption and other applications. Yeast. 1998;14:115–132. doi: 10.1002/(SICI)1097-0061(19980130)14:2<115::AID-YEA204>3.0.CO;2-2. [DOI] [PubMed] [Google Scholar]
- Friden P., Schimmel P., Schimmel P. LEU3 of Saccharomyces cerevisiae activates multiple genes for branched-chain amino acid biosynthesis by binding to a common decanucleotide core sequence. Mol. Cell. Biol. 1988;8:2690–2697. doi: 10.1128/mcb.8.7.2690. [DOI] [PMC free article] [PubMed] [Google Scholar]
- Fried M., Crothers D.M., Crothers D.M. Equilibria and kinetics of lac repressor–operator interactions by polyacrylamide gel electrophoresis. Nucleic Acids Res. 1981;9:6505–6525. doi: 10.1093/nar/9.23.6505. [DOI] [PMC free article] [PubMed] [Google Scholar]
- Ghaemmaghami S., Huh W.K., Bower K., Howson R.W., Belle A., Dephoure N., O’Shea E.K., Weissman J.S., Huh W.K., Bower K., Howson R.W., Belle A., Dephoure N., O’Shea E.K., Weissman J.S., Bower K., Howson R.W., Belle A., Dephoure N., O’Shea E.K., Weissman J.S., Howson R.W., Belle A., Dephoure N., O’Shea E.K., Weissman J.S., Belle A., Dephoure N., O’Shea E.K., Weissman J.S., Dephoure N., O’Shea E.K., Weissman J.S., O’Shea E.K., Weissman J.S., Weissman J.S. Global analysis of protein expression in yeast. Nature. 2003;425:737–741. doi: 10.1038/nature02046. [DOI] [PubMed] [Google Scholar]
- Granek J., Clarke N., Clarke N. Explicit equilibrium modeling of transcription-factor binding and gene regulation. Genome Biol. 2005;6:R87. doi: 10.1186/gb-2005-6-10-r87. [DOI] [PMC free article] [PubMed] [Google Scholar]
- Guillemette B., Bataille A.R., Gevry N., Adam M., Blanchette M., Robert F., Gaudreau L., Bataille A.R., Gevry N., Adam M., Blanchette M., Robert F., Gaudreau L., Gevry N., Adam M., Blanchette M., Robert F., Gaudreau L., Adam M., Blanchette M., Robert F., Gaudreau L., Blanchette M., Robert F., Gaudreau L., Robert F., Gaudreau L., Gaudreau L. Variant histone H2A.Z is globally localized to the promoters of inactive yeast genes and regulates nucleosome positioning. PLoS Biol. 2005;3:e384. doi: 10.1371/journal.pbio.0030384. [DOI] [PMC free article] [PubMed] [Google Scholar]
- Harbison C.T., Gordon D.B., Lee T.I., Rinaldi N.J., Macisaac K.D., Danford T.W., Hannett N.M., Tagne J.B., Reynolds D.B., Yoo J., Gordon D.B., Lee T.I., Rinaldi N.J., Macisaac K.D., Danford T.W., Hannett N.M., Tagne J.B., Reynolds D.B., Yoo J., Lee T.I., Rinaldi N.J., Macisaac K.D., Danford T.W., Hannett N.M., Tagne J.B., Reynolds D.B., Yoo J., Rinaldi N.J., Macisaac K.D., Danford T.W., Hannett N.M., Tagne J.B., Reynolds D.B., Yoo J., Macisaac K.D., Danford T.W., Hannett N.M., Tagne J.B., Reynolds D.B., Yoo J., Danford T.W., Hannett N.M., Tagne J.B., Reynolds D.B., Yoo J., Hannett N.M., Tagne J.B., Reynolds D.B., Yoo J., Tagne J.B., Reynolds D.B., Yoo J., Reynolds D.B., Yoo J., Yoo J., et al. Transcriptional regulatory code of a eukaryotic genome. Nature. 2004;431:99–104. doi: 10.1038/nature02800. [DOI] [PMC free article] [PubMed] [Google Scholar]
- Henikoff S. Histone modifications: Combinatorial complexity or cumulative simplicity? Proc. Natl. Acad. Sci. 2005;102:5308–5309. doi: 10.1073/pnas.0501853102. [DOI] [PMC free article] [PubMed] [Google Scholar]
- Iyer V.R., Horak C.E., Scafe C.S., Botstein D., Snyder M., Brown P.O., Horak C.E., Scafe C.S., Botstein D., Snyder M., Brown P.O., Scafe C.S., Botstein D., Snyder M., Brown P.O., Botstein D., Snyder M., Brown P.O., Snyder M., Brown P.O., Brown P.O. Genomic binding sites of the yeast cell-cycle transcription factors SBF and MBF. Nature. 2001;409:533–538. doi: 10.1038/35054095. [DOI] [PubMed] [Google Scholar]
- Kirkpatrick C.R., Schimmel P., Schimmel P. Detection of leucine-independent DNA site occupancy of the yeast Leu3p transcriptional activator in vivo. Mol. Cell. Biol. 1995;15:4021–4030. doi: 10.1128/mcb.15.8.4021. [DOI] [PMC free article] [PubMed] [Google Scholar]
- Lee T.I., Rinaldi N.J., Robert F., Odom D.T., Bar-Joseph Z., Gerber G.K., Hannett N.M., Harbison C.T., Thompson C.M., Simon I., Rinaldi N.J., Robert F., Odom D.T., Bar-Joseph Z., Gerber G.K., Hannett N.M., Harbison C.T., Thompson C.M., Simon I., Robert F., Odom D.T., Bar-Joseph Z., Gerber G.K., Hannett N.M., Harbison C.T., Thompson C.M., Simon I., Odom D.T., Bar-Joseph Z., Gerber G.K., Hannett N.M., Harbison C.T., Thompson C.M., Simon I., Bar-Joseph Z., Gerber G.K., Hannett N.M., Harbison C.T., Thompson C.M., Simon I., Gerber G.K., Hannett N.M., Harbison C.T., Thompson C.M., Simon I., Hannett N.M., Harbison C.T., Thompson C.M., Simon I., Harbison C.T., Thompson C.M., Simon I., Thompson C.M., Simon I., Simon I., et al. Transcriptional regulatory networks in. Saccharomyces cerevisiae. Science. 2002;298:799–804. doi: 10.1126/science.1075090. [DOI] [PubMed] [Google Scholar]
- Lee C.K., Shibata Y., Rao B., Strahl B.D., Lieb J.D., Shibata Y., Rao B., Strahl B.D., Lieb J.D., Rao B., Strahl B.D., Lieb J.D., Strahl B.D., Lieb J.D., Lieb J.D. Evidence for nucleosome depletion at active regulatory regions genome-wide. Nat. Genet. 2004;36:900–905. doi: 10.1038/ng1400. [DOI] [PubMed] [Google Scholar]
- Lieb J.D., Clarke N.D., Clarke N.D. Control of transcription through intragenic patterns of nucleosome composition. Cell. 2005;123:1187–1190. doi: 10.1016/j.cell.2005.12.010. [DOI] [PubMed] [Google Scholar]
- Lieb J.D., Liu X., Botstein D., Brown P.O., Liu X., Botstein D., Brown P.O., Botstein D., Brown P.O., Brown P.O. Promoter-specific binding of Rap1 revealed by genome-wide maps of protein–DNA association. Nat. Genet. 2001;28:327–334. doi: 10.1038/ng569. [DOI] [PubMed] [Google Scholar]
- Liu X., Clarke N.D., Clarke N.D. Rationalization of gene regulation by a eukaryotic transcription factor: Calculation of regulatory region occupancy from predicted binding affinities. J. Mol. Biol. 2002;323:1–8. doi: 10.1016/s0022-2836(02)00894-x. [DOI] [PubMed] [Google Scholar]
- Liu X., Brutlag D.L., Liu J.S., Brutlag D.L., Liu J.S., Liu J.S. BioProspector: Discovering conserved DNA motifs in upstream regulatory regions of co-expressed genes. Pac. Symp. Biocomput. 2001;2001:127–138. [PubMed] [Google Scholar]
- Liu X.S., Brutlag D.L., Liu J.S., Brutlag D.L., Liu J.S., Liu J.S. An algorithm for finding protein–DNA binding sites with applications to chromatin-immunoprecipitation microarray experiments. Nat. Biotechnol. 2002;20:835–839. doi: 10.1038/nbt717. [DOI] [PubMed] [Google Scholar]
- Liu X., Noll D.M., Lieb J.D., Clarke N.D., Noll D.M., Lieb J.D., Clarke N.D., Lieb J.D., Clarke N.D., Clarke N.D. DIP-chip: Rapid and accurate determination of DNA-binding specificity. Genome Res. 2005;15:421–427. doi: 10.1101/gr.3256505. [DOI] [PMC free article] [PubMed] [Google Scholar]
- Mai X., Chou S., Struhl K., Chou S., Struhl K., Struhl K. Preferential accessibility of the yeast his3 promoter is determined by a general property of the DNA sequence, not by specific elements. Mol. Cell. Biol. 2000;20:6668–6676. doi: 10.1128/mcb.20.18.6668-6676.2000. [DOI] [PMC free article] [PubMed] [Google Scholar]
- Mellor J. The dynamics of chromatin remodeling at promoters. Mol. Cell. 2005;19:147–157. doi: 10.1016/j.molcel.2005.06.023. [DOI] [PubMed] [Google Scholar]
- Millar C.B., Grunstein M., Grunstein M. Genome-wide patterns of histone modifications in yeast. Nat. Rev. Mol. Cell Biol. 2006;7:657–666. doi: 10.1038/nrm1986. [DOI] [PubMed] [Google Scholar]
- Oliphant A.R., Brandl C.J., Struhl K., Brandl C.J., Struhl K., Struhl K. Defining the sequence specificity of DNA-binding proteins by selecting binding sites from random-sequence oligonucleotides: Analysis of yeast GCN4 protein. Mol. Cell. Biol. 1989;9:2944–2949. doi: 10.1128/mcb.9.7.2944. [DOI] [PMC free article] [PubMed] [Google Scholar]
- Pokholok D.K., Harbison C.T., Levine S., Cole M., Hannett N.M., Lee T.I., Bell G.W., Walker K., Rolfe P.A., Herbolsheimer E., Harbison C.T., Levine S., Cole M., Hannett N.M., Lee T.I., Bell G.W., Walker K., Rolfe P.A., Herbolsheimer E., Levine S., Cole M., Hannett N.M., Lee T.I., Bell G.W., Walker K., Rolfe P.A., Herbolsheimer E., Cole M., Hannett N.M., Lee T.I., Bell G.W., Walker K., Rolfe P.A., Herbolsheimer E., Hannett N.M., Lee T.I., Bell G.W., Walker K., Rolfe P.A., Herbolsheimer E., Lee T.I., Bell G.W., Walker K., Rolfe P.A., Herbolsheimer E., Bell G.W., Walker K., Rolfe P.A., Herbolsheimer E., Walker K., Rolfe P.A., Herbolsheimer E., Rolfe P.A., Herbolsheimer E., Herbolsheimer E., et al. Genome-wide map of nucleosome acetylation and methylation in yeast. Cell. 2005;122:517–527. doi: 10.1016/j.cell.2005.06.026. [DOI] [PubMed] [Google Scholar]
- Rao B., Shibata Y., Strahl B.D., Lieb J.D., Shibata Y., Strahl B.D., Lieb J.D., Strahl B.D., Lieb J.D., Lieb J.D. Dimethylation of histone h3 at lysine 36 demarcates regulatory and nonregulatory chromatin genome-wide. Mol. Cell. Biol. 2005;25:9447–9459. doi: 10.1128/MCB.25.21.9447-9459.2005. [DOI] [PMC free article] [PubMed] [Google Scholar]
- Ren B., Robert F., Wyrick J.J., Aparicio O., Jennings E.G., Simon I., Zeitlinger J., Schreiber J., Hannett N., Kanin E., Robert F., Wyrick J.J., Aparicio O., Jennings E.G., Simon I., Zeitlinger J., Schreiber J., Hannett N., Kanin E., Wyrick J.J., Aparicio O., Jennings E.G., Simon I., Zeitlinger J., Schreiber J., Hannett N., Kanin E., Aparicio O., Jennings E.G., Simon I., Zeitlinger J., Schreiber J., Hannett N., Kanin E., Jennings E.G., Simon I., Zeitlinger J., Schreiber J., Hannett N., Kanin E., Simon I., Zeitlinger J., Schreiber J., Hannett N., Kanin E., Zeitlinger J., Schreiber J., Hannett N., Kanin E., Schreiber J., Hannett N., Kanin E., Hannett N., Kanin E., Kanin E., et al. Genome-wide location and function of DNA binding proteins. Science. 2000;290:2306–2309. doi: 10.1126/science.290.5500.2306. [DOI] [PubMed] [Google Scholar]
- Schneider T.D., Stephens R.M., Stephens R.M. Sequence logos: A new way to display consensus sequences. Nucleic Acids Res. 1990;18:6097–6100. doi: 10.1093/nar/18.20.6097. [DOI] [PMC free article] [PubMed] [Google Scholar]
- Segal E., Fondufe-Mittendorf Y., Chen L., Thastrom A., Field Y., Moore I.K., Wang J.P., Widom J., Fondufe-Mittendorf Y., Chen L., Thastrom A., Field Y., Moore I.K., Wang J.P., Widom J., Chen L., Thastrom A., Field Y., Moore I.K., Wang J.P., Widom J., Thastrom A., Field Y., Moore I.K., Wang J.P., Widom J., Field Y., Moore I.K., Wang J.P., Widom J., Moore I.K., Wang J.P., Widom J., Wang J.P., Widom J., Widom J. A genomic code for nucleosome positioning. Nature. 2006;442:772–778. doi: 10.1038/nature04979. [DOI] [PMC free article] [PubMed] [Google Scholar]
- Sekinger E.A., Moqtaderi Z., Struhl K., Moqtaderi Z., Struhl K., Struhl K. Intrinsic histone–DNA interactions and low nucleosome density are important for preferential accessibility of promoter regions in yeast. Mol. Cell. 2005;18:735–748. doi: 10.1016/j.molcel.2005.05.003. [DOI] [PubMed] [Google Scholar]
- Tuerk C., Gold L., Gold L. Systematic evolution of ligands by exponential enrichment: RNA ligands to bacteriophage T4 DNA polymerase. Science. 1990;249:505–510. doi: 10.1126/science.2200121. [DOI] [PubMed] [Google Scholar]
- Venter U., Svaren J., Schmitz J., Schmid A., Horz W., Svaren J., Schmitz J., Schmid A., Horz W., Schmitz J., Schmid A., Horz W., Schmid A., Horz W., Horz W. A nucleosome precludes binding of the transcription factor Pho4 in vivo to a critical target site in the PHO5 promoter. EMBO J. 1994;13:4848–4855. doi: 10.1002/j.1460-2075.1994.tb06811.x. [DOI] [PMC free article] [PubMed] [Google Scholar]
- Wang D., Zheng F., Holmberg S., Kohlhaw G.B., Zheng F., Holmberg S., Kohlhaw G.B., Holmberg S., Kohlhaw G.B., Kohlhaw G.B. Yeast transcriptional regulator Leu3p. Self-masking, specificity of masking, and evidence for regulation by the intracellular level of Leu3p. J. Biol. Chem. 1999;274:19017–19024. doi: 10.1074/jbc.274.27.19017. [DOI] [PubMed] [Google Scholar]
- Yuan G.C., Liu Y.J., Dion M.F., Slack M.D., Wu L.F., Altschuler S.J., Rando O.J., Liu Y.J., Dion M.F., Slack M.D., Wu L.F., Altschuler S.J., Rando O.J., Dion M.F., Slack M.D., Wu L.F., Altschuler S.J., Rando O.J., Slack M.D., Wu L.F., Altschuler S.J., Rando O.J., Wu L.F., Altschuler S.J., Rando O.J., Altschuler S.J., Rando O.J., Rando O.J. Genome-scale identification of nucleosome positions in S. cerevisiae. Science. 2005;309:626–630. doi: 10.1126/science.1112178. [DOI] [PubMed] [Google Scholar]
- Zhang H., Roberts D.N., Cairns B.R., Roberts D.N., Cairns B.R., Cairns B.R. Genome-wide dynamics of Htz1, a histone H2A variant that poises repressed/basal promoters for activation through histone loss. Cell. 2005;123:219–231. doi: 10.1016/j.cell.2005.08.036. [DOI] [PMC free article] [PubMed] [Google Scholar]
Associated Data
This section collects any data citations, data availability statements, or supplementary materials included in this article.
Data Availability Statement
Additional information, including DNA-sequence definitions, validation of sequence coordinates, and details of the Gene Ontology (GO) analysis used in Table 1 can be found in the Supplemental Methods. All raw data can be downloaded at the UNC Microarray Database (https://genome.unc.edu) or via GEO accession number GSE5785.