Tools for the automatic identification and classification of RNA base pairs (original) (raw)
Abstract
Three programs have been developed to aid in the classification and visualization of RNA structure. BPViewer provides a web interface for displaying three-dimensional (3D) coordinates of individual base pairs or base pair collections. A web server, RNAview, automatically identifies and classifies the types of base pairs that are formed in nucleic acid structures by various combinations of the three edges, Watson–Crick, Hoogsteen and the Sugar edge. RNAView produces two-dimensional (2D) diagrams of secondary and tertiary structure in either Postscript, VRML or RNAML formats. The application RNAMLview can be used to rearrange various parts of the RNAView 2D diagram to generate a standard representation (like the cloverleaf structure of tRNAs) or any layout desired by the user. A 2D diagram can be rapidly reformatted using RNAMLview since all the parts of RNA (like helices and single strands) are dynamically linked while moving the selected parts. With the base pair annotation and the 2D graphic display, RNA motifs are rapidly identified and classified. A survey has been carried out for 41 unique structures selected from the NDB database. The statistics for the occurrence of each edge and of each of the 12 bp families are given for the combinations of the four bases: A, G, U and C. The program also allows for visualization of the base pair interactions by using a symbolic convention previously proposed for base pairs. The web servers for BPViewer and RNAview are available at http://ndbserver.rutgers.edu/services/. The application RNAMLview can also be downloaded from this site. The 2D diagrams produced by RNAview are available for RNA structures in the Nucleic Acid Database (NDB) at http://ndbserver.rutgers.edu/atlas/.
INTRODUCTION
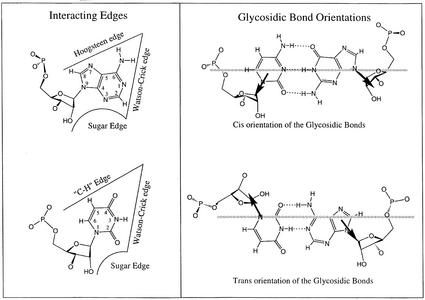
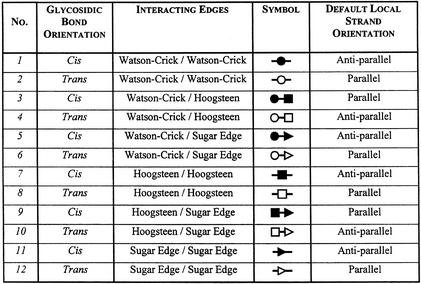
Nucleic acid structures are being published at a great pace following enhanced X-ray, NMR and chemical synthesis technologies. The complex and intricate RNA structures solved to date reveal a great diversity of base to base interactions (reviewed in 1). Various approaches exist for describing nucleic acid base pairs (2). Recently, Leontis and Westhof (LW) (3) proposed a base pair classification for nucleic acids based on the observation that the planar edge-to-edge hydrogen bonding interactions between two bases involve one of three distinct edges: the Watson–Crick edge, the Hoogsteen edge and the Sugar edge. The classification applies to those base pairs with at least two H-bonds. To define the relative orientation of the two bases, a line is drawn parallel to and between the two connecting H-bonds. The interaction of the bases is called trans if the glycosidic bonds of the interacting nucleotides lie on opposite sides of the line. It is called cis if the glycosidic bonds of the nucleotides are on the same side of the line. This classification gives rise to 12 basic geometric families of pairing arrangements between nucleic acid bases. For each geometric type, the relative orientations of the strands can be easily deduced. The base pair interaction diagram is given in Figure 1. The 12 different families of base pairs together with the local strand orientations are given in Table 1. A graphical convention for displaying non-Watson–Crick interactions on a secondary structure diagram has also been proposed (3). According to the proposed convention, a circle represents the Watson–Crick edge of a base, a square represents its Hoogsteen edge and a triangle represents the Sugar edge. Cis interactions are designated by filled symbols and trans base pairs by open symbols. The symbols corresponding to each base pair family are also given in Table 1.
Figure 1.
(Left) Identification of edges in RNA bases. (Right) Cis versus trans orientation of glycosidic bonds. The three edges are Waston–Crick, Hoogsteen and Sugar. The trans is formed if the glycosidic bonds of the interacting nucleotides lie on opposite sides of the line. The cis is formed, if the glycosidic bonds of the nucleotides are on the same side of the line. Figure reproduced from (3) with permission from Oxford University Press.
Table 1. The local strand orientations of the 12 families of base pairs.
The analysis of the detailed three-dimensional (3D) interactions for each type of base pair interaction has been greatly facilitated by the program, BPViewer. The geometrical classification along with the symbolic diagrams provides a set of simple mnemonics for each type of base pair interaction. The full diagram convention simplifies and clarifies the annotation, description and comparison of secondary structure, RNA motifs and tertiary interactions present in a folded RNA. We have developed a program, RNAview, to quickly perform LW base pair classifications and RNA motif searches. The program generates the secondary structure with base pair symbols and tertiary interactions. RNAView also exports the VRML (Virtual Reality Markup Language) file so that the user can dynamically visualize the 3D structure. The detailed secondary structure annotations are also exported in the RNAML format (4). A companion program, RNAMLview, accepts RNAML input and allows the dynamic editing of the two-dimensional (2D) projections produced by RNAview. Web servers for BPViewer and RNAView are provided by the Nucleic Acid Database (NDB) (5). The application RNAMLview can also be downloaded from the NDB site. The RNAView server can accept structure input stored in PDB (6,7), mmCIF (8) or RNAML (4) file formats. The present set of programs is complementary to others (9,10) and the results of either can be used or compared using the RNAML files.
METHODS AND ALGORITHMS
Finding the base pairs
Choice of coordinate frame.
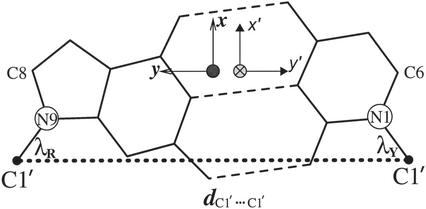
A standard reference frame is used for base pair determination (11). Models of the seven bases (A, U, G, C, T, I and P) were generated in a survey of high resolution crystal structures of nucleic acid analogs stored in the recent version of the Cambridge Structure Database (12). The coordinate frames are chosen so that the complementary bases form an ideal, planar Watson–Crick base pair in the undistorted reference state. The hydrogen bond donor–acceptor distance (N, O)…(N, O), the C1′…C1′ distance, the angles N9-C1′…C1′ and N1-C1′…C1′ between the base paired purine and pyrimidine should be consistent with values observed in the relevant small molecule in the Cambridge Structure Database. A right-handed coordinate frame is generated and attached to each base. The _x_-axis points in the direction of the major groove, along the perpendicular bisector of the C1′…C1′ vector. The origins are between the Watson–Crick edges of the standard base pair (Fig. 2) and are at the intersection point between the _x_-axis and a line connecting the pyrimidine Y(C6) and purine R(C8) atoms. The _y_-axis points in the direction of the sugar–phosphate backbone (of the sequence strand), parallel to the C1′…C1′ vector. The _z_-axis is determined by the right-handed rule, i.e. z=x×y. For right-handed A- and B-DNA the _z_-axis accordingly points in the 5′- to 3′-direction of the sequence strand. For a standard base pair, the origins of the two coordinate systems, one for the pyrimidine and one for the purine, overlap. Here, the two coordinate axes are separated slightly for easy visualization. The _x_-directions for the two local coordinates are the same while the y and z directions are opposite (Fig. 2). The coordinates satisfying the above criteria can be found in Table 1 of (11).
Figure 2.
Coordinate frames for each base. For an ideal Watson–Crick pair, the two frames overlap with opposite y and z directions. In this picture, the two frames are separated a little for visualization. The solid circle means the _z_-axis is pointing outside of the paper and the crossed circle means that the _z_-axis is pointing inside of the paper [The picture is taken from Olson (11) with some modification].
Determination of base pairs.
For determining base pairs in a real structure, a least-square fit is carried out for each base. Each standard base, as described above, is fitted to the corresponding base in the real structure. However, some residues in the structure may be chemically modified. In such a situation, the program will use the standard base which best matches the modified base by least square fitting. For example, the modified residue +C is fitted to the corresponding standard coordinates for C. When fitting to each real base, the standard coordinate frame is rigidly rotated and translated to bring the standard base into coincidence with the real base. In carrying out the least square fittings, several useful parameters, including shear, stretch, stagger, buckle, propeller and opening, can be easily calculated. There are two important parameters for base pair determination. One is the angle between the planes of the two bases and the other is the vertical distance between these planes. The angle of the two bases in the real structure can be calculated by the equation: (180°/π)×a cos(zi·zj), where zi·zj is the dot product of unit vectors zi and zj, which are the normal vectors to the planes of base i and base j, respectively. The vertical distance, dv, of two bases is calculated as the norm of the vector dot product, i.e. |n·d|, where n is the unit vector averaged over vector zi and zj and d is a vector connecting the two origins.
To determine the glycosidic bond configuration (cis or trans) for each basepair, we generated V12, the vector connecting the geometric centers of the ring systems of the interacting bases. V12 is directed from the geometric center of base 1 to the center of base 2. V1C and V2C are vectors coinciding with the glycosidic bonds of bases 1 and 2. They are directed from Sugar C1′ to the corresponding glycosidic nitrogen (N1 for pyrimidines or N9 for purines) of the base. When the dot product (V12×V1C)·(V12×V2C) < 0, the base pair is in the trans orientation. Otherwise, it is in the cis configuration.
The Watson–Crick base pairs.
The criteria for determining the canonical Watson–Crick base pairs are the following:
- The base pair must be either AU, AT, GC or IC.
- The angle between the two local _x_-axes must lie in the range 0–17°; the angle between the two local _y_-axes must in the range 157–180°; and the angle between the two local _z_-axes must be in the range 0–30°. This defines the standard Watson–Crick geometry in which the glycosidic bond configuration is automatically cis.
- The distance separating the two base pair origins must be <2.5 Å.
- The vertical distance between the two base planes must be <1.5 Å.
The non-Watson–Crick base pairs.
If the base pair does not belong to the canonical Watson–Crick base pair as defined above, it is examined to see whether it belongs to one of the other 12 non-Watson–Crick base pair families. The criteria for determining the type of base pair family are the following:
- The angle αb between two base planes (or equivalently, between the two local _z_-axes) must be <65°.
- The vertical distance dv between the two bases planes must be <2.5 Å.
- At least two hydrogen bonds must exist, one of which should be a H-bond that occurs between donor and acceptor atoms, both of which belong to a base, and with the distance between the two atoms (N or O) <3.4 Å. The second H-bond is determined with extended distances. The distance between donor and acceptor for base (N, O)…base (N, O) <3.75 Å, for base (N, O)…base (C–H) <3.9 Å, for base (N, O)…ribose (O2′) <3.75 Å.
If the pair has only two H-bonds and they are bifurcated with two acceptor atoms and one donor atom, the pair will be further examined. Only those with better geometry (angle αb between two base planes <50°, and vertical distance dv between the two base planes <2.1 Å) will be assigned to one of the 12 families. Another special case for rejecting a base pair is when αb<10° and dv>2.2 Å.
All the pairs which do not belong to one of the 12 families will be classified as a tertiary interaction if there exists at least one H-bond that meets the following criteria: the distance between donor and acceptor for base (N, O)…base (N, O) <3.4 Å; for base (N, O)…base (O2′) <3.4 Å; for base (N, O)…base (O1P/O2P) <3.2 Å; and for all others <3.1 Å. The tertiary interactions are represented in our graphic display by red dashed lines.
The geometrical edge for each base of the 12 families is determined by counting the contact distances between the two bases. In order to correctly identify the base edges, all the atoms on the edge have to be used and the distance between heavy atoms (the contact distance) is set to 4.0 Å. However, for the bifurcated pairs with only two H-bonds, the distance is set to 4.3 Å, since in this type of pair the bases are normally further from each other.
A stacked arrangement of bases does not belong to the 12 families. However, since stacking is believed to play a major role in nucleic acid structure folding, we also listed the stacked bases. The criteria for stacking are the following: the distance between the two centers of the ring is <5.7 Å, the vertical distance between the two base planes is <2.7 Å, and the base angles are <40°.
Graphic representations of secondary structure with tertiary interactions
In establishing the above base pairing criteria it was necessary to visualize a large number of these interactions. To simplify this process, a web visualization tool, BPViewer, was developed. This tool provides the means to navigate through the list of base pairs, selecting and viewing the 3D coordinates for individual or sets of base pairs of interest.
In order to convey the 3D contacts present in a folded RNA, it is usually necessary to represent in a planar drawing the secondary and tertiary base pairs and interactions. The secondary base pairs are the cis Watson–Crick pairs together with the wobble pairs and those are normally represented in standard 2D diagrams. The tertiary interactions can be decomposed into base–base or base–backbone interactions. Most generally, the base–base interactions belong to one of the 12 families of the pairs discussed above. We wanted to produce a program able to deduce such a diagram starting from a set of 3D coordinates.
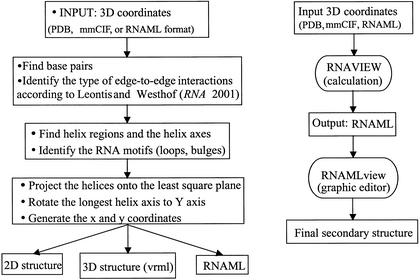
We have developed a program called RNAview that provides a detailed annotation for the secondary and tertiary structures of a nucleic acid with the diagram convention for the 12 families of pairs. Figure 3A gives the flow chart of the program. A minimum of two consecutive Watson–Crick base pairs is needed to define a helical region. If several adjacent helices with their axes are roughly in the same direction, a longer pseudo-helix axis in this direction will be determined. All the helix axes are projected onto the 2D plane which is a least square plane formed by the atoms from all the helices. The 2D picture is automatically rotated with the longest pseudo-helix axis along the vertical direction (y coordinate for a postscript file). The 2D coordinates (x, y) of each base is generated perpendicular to each axis. All the loops are represented by circles. The standard Watson–Crick base pairs as defined above are presented by two short parallel lines for G·C pairs and a single short line for A·U pairs. The G·U wobble pairs are represented by small circles. The other 12 non-Watson–Crick base pair interactions are fully implemented with diagram conventions described in Table 1. The tertiary interactions as defined above are represented by single red dashed lines. All the standard nucleic acids are displayed by the single letter codes (i.e. A, U, G and C). If the base is modified, it will be displayed as a lower case letter code (i.e. a, u, g and c). For each nucleic acid, if the base is in the syn conformation with respect to the Sugar (note the difference with cis as defined above), the nucleic acid name is displayed as a red letter. The graphic secondary structure is exported as a postscript file. All the calculated structure annotations (such as the helices, single strands, bulges, loops, 2D coordinate of each base, the LW type of base pair, base modification carried out from the PDB file, etc.) are stored in the RNAML file, which uses the XML (eXtensible Markup Language) format as data exchange. Another output of the program is the VRML format. Detailed base pair interactions are displayed the same as the above conventions, but the squares are substituted by cubes, triangles by cones, circles by spheres and lines by sticks. The VRML file gives 3D dynamic structures that can be displayed from a web navigator with the VRML plug in.
Figure 3.
The flowchart of the RNAview program is given at the left and the right drawing gives the scenario of how the RNAview and the RNAMLview programs are integrated.
The secondary structure with tertiary interactions from most of the NDB can be obtained without further modification. Some examples are given in Figures 4–6. For large complicated structures, some elements of the 2D picture may overlap. Therefore, it may be necessary to modify the automatically generated projections.
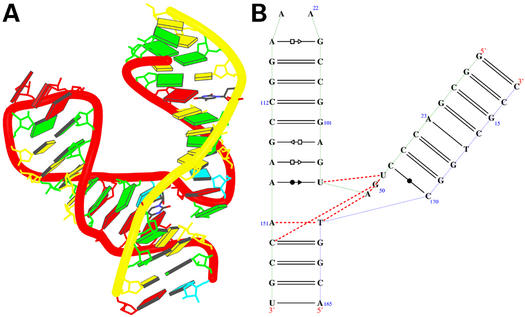
Figure 4.
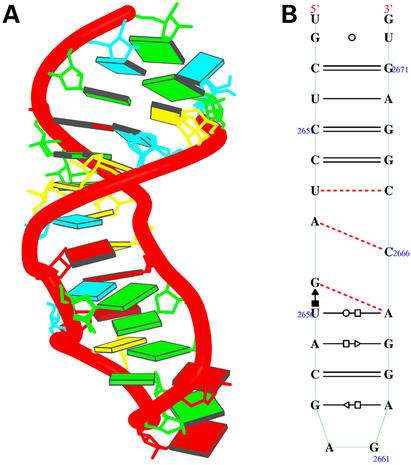
The crystal structure of the sarcin/ricin domain from E.coli 23S rRNA [NDBID UR0007 (16)]. (A) The 3D structure. Each block represents the base of nucleic acid: A, red; C, yellow; G, green; U, cyan. The secondary structure (B) was obtained directly from the RNAview program without further modification. The red single dashed lines mean that the base pairs only involve one H-bond.
Figure 6.
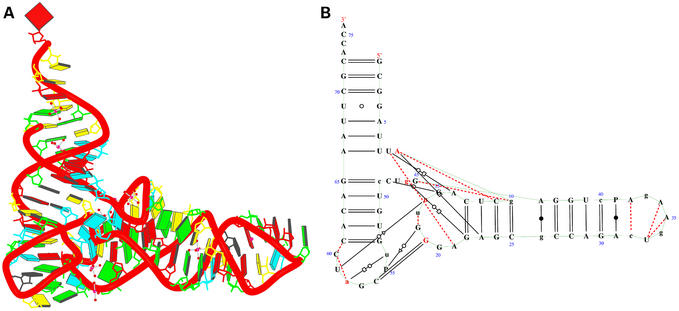
Crystal structure of tRNA [NDBID TR0001 (13)]. (A) The 3D structure. Color code is the same as in Figure 4. The secondary structure (B) was obtained directly from the RNAview program without further modification. The red single dashed lines mean that the base pair involve only one H-bond. The modified bases are given the corresponding lower case letter. The letter P means pseudouracil. The four red letters (a, A, G, g) indicate that the nucleic acids have syn conformations. Modified bases are given as lower case.
Another graphics application, RNAMLview, is able to manipulate the 2D view of RNA secondary structure stored in a RNAML file. RNAMLview is a versatile graphical editor that permits the user to adjust the layout and presentation of intramolecular interactions. The interactions are divided into secondary and tertiary interactions. Base pairing interactions are displayed by the same diagrams as those of the RNAview program. For each base in the secondary representation, the user is presented options for displaying the tertiary interactions.
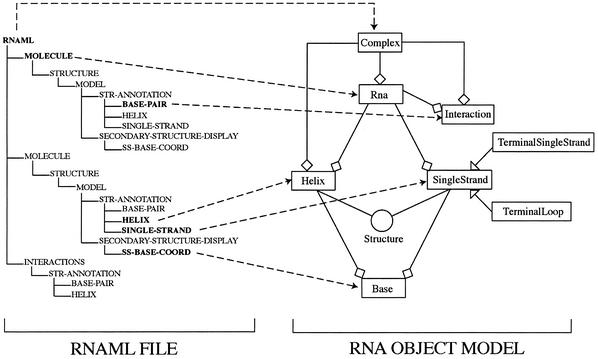
An RNAML file can store different secondary representations for a single molecule. Each representation is defined in the RNAML file as a separate model. RNAMLview will generate distinct graphical representations for each model and each representation will be displayed in a separate panel of the application and can be manipulated independently. The RNAMLview program uses the Java language (e.g. http://www.java.sun.com) to provide platform and operating system independence. The open source JDOM library (e.g. http://www.jdom.org) is used to parse the RNAML file. The program constructs two graphical views of an RNAML file: (i) a tree representation with all the elements stored; and (ii) a 2D picture for each secondary representation stored. The program creates an object model of the secondary representation (Fig. 7). This model includes all components of RNA secondary and tertiary structure such as the representations of helix, single strand, terminal loop and terminal single strand. All these components are modeled in Java as 〈Structure〉 objects in an inheritance relationship described in Figure 3.
Figure 7.
The correspondence of the RNAML tree structure with the RNA object model generated and used by RNAMLview.
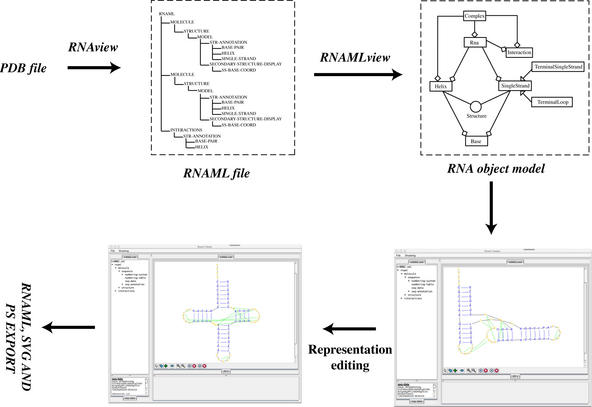
The programs RNAview and RNAMLview are fully integrated using the data exchange protocol of RNAML. Figure 3B shows a typical scenario in which either a PDB, mmCIF or RNAML file is read by RNAview. RNAview calculates all intra-molecular interactions and stores this information in RNAML. RNAMLview reads the RNAML file produced by RNAview and, for the convenience of the user, the RNAview is wrapped by RNAMLview so that a user can directly import PDB, mmCIF or RNAML into the graphical interface. Using the RNAMLview graphic interface, a user can save the new representation in RNAML, SVG or PS formats.
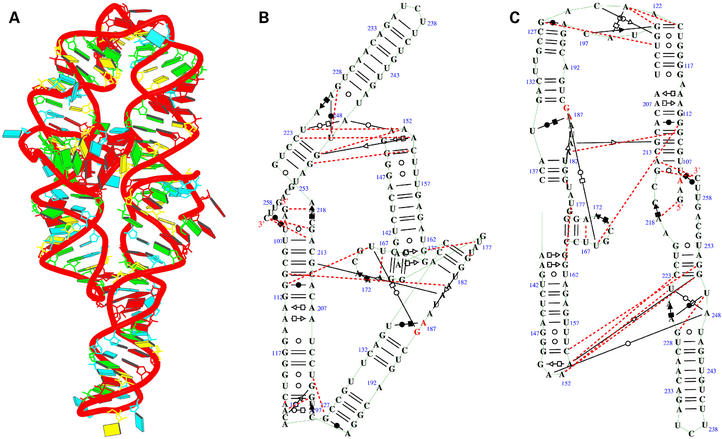
RNAMLview can be used in a variety of ways. Figure 8 shows the procedure for generating a conventional secondary diagram. An NDB file is selected [in this example we use TR0001 (13)] and the program calls the RNAview program to generate a projection. Using RNAMLview, this projection can be manipulated to produce the familiar Holley diagram. The program can also be used to edit a complex secondary structure projection. A structure of P4–P6 domain (14) (Fig. 9A) is given for demonstration. Figure 9B was directly obtained using RNAview. Although technically correct, many hydrogen bonds are overlapped. RNAMLview was used to modify the projection diagram to produce Figure 9C. In this figure the overlap of hydrogen bonds is minimized.
Figure 8.
Schematic illustrating the use of RNAview and RNAMLview. The upper left panel gives the RNAML file generated by RNAview from a PDB file (NDBID TR0001). The upper right panel gives the RNA object model generated by the RNAMLview program. The lower right panel gives the picture of tRNA secondary structure (NDBID TR0001) generated by RNAMLview from the RNA object model. Finally, the lower left panel gives the modified picture created by the RNAMLview.
Figure 9.
Crystal structure of mutant P4–P6 domain of Tetrahymena themophila group I intron [NDBID UR0012 (14)]. One monomer (chain A) was selected for demonstration. (A) The 3D structure. Color code is the same as Figure 4a. (B) View obtained directly from the RNAview program without modification. (C) View resulting from modification using RNAMLview. Note that the orientation of (C) matches (A). Red dashed lines means the pair interact by a single H-bond. The red letters indicate that the nucleic acids have syn conformations.
RESULTS
Graphic representation of RNA
We have provided two graphic programs (RNAview and RNAMLview) that allow rapid visualization of RNA secondary structure. We calculated all the selected 41 RNA structures in ∼1 min by using a PC (Dell 340, Pentium 4, with CPU 1.8G) with Linux operating system. This can greatly expedite looking for RNA patterns [or motifs (15)] from the fully annotated RNA structures. RNAMLview can be used to manipulate the 2D structure so that each element does not overlap for some complicated structures. The advantage of this program is that all the base pair interaction patterns are dynamically linked, while moving individual elements.
Some examples of the results of the programs are given in Figures 4–6 and 9. Figure 4A shows the 3D crystal structure of the sarcin/ricin domain from Escherichia coli 23S rRNA (16). Figure 4B was directly obtained from RNAview. The structure consists of a single chain with 27 nucleic acids forming 10 bp. The two helices are roughly in the same direction. Therefore, the RNAview program gives one longer pseudo-helix on the y axis.
Figure 5A shows the 3D crystal structure of hammerhead ribozyme (17). The structure consists of two chains with 47 nucleic acids forming 20 bp. Figure 5B was directly obtained from RNAview. The three anti-parallel helices form two pseudo-helices that make an angle of ∼30°. From the annotated 2D structure, one can see the rich non-Watson–Crick base pairing interactions at the junction of the helices.
Figure 5.
Crystal structure of hammerhead ribozyme [NDBID UHX026 (17)]. One biological unit is used for demonstration. (A) The 3D structure. Color code is the same as in Figure 4. The secondary structure (B) was obtained directly from the RNAview program without further modification. The red single dashed lines mean that the base pair only involve one H-bond.
Figure 6 shows the transfer RNA crystal structure (13). The structure is a single strand and forms four double helices [the acceptor, anticodon, D and T arms as annotated in (18)]. There are 30 bp from the total 76 bases. Figure 6A shows the 3D structure. Figure 6B shows the secondary structure projection that was directly obtained from RNAview. The four helices form two pseudo-helices which are perpendicular to each other. The view shows an L-shaped fold on the least square plane. Bases at the junctions (Terminal T and D loops) involve many tertiary and trans interactions. The 2D structure is comparable to the edited picture by Ferré-D'Amaré and Doudna (18); it took ∼0.1 s (Del 340, Pentium 4, CPU 1.8G, with Linux system) to get the fully annotated structure by the RNAview program.
Figure 9 shows the crystal structure of a group I ribozyme P4–P6 domain (14). The P4–P6 domain can assemble with the remainder of the introns in trans to reconstitute catalytic activity. The structure has one chain for each monomer, consisting of nine anti-parallel helices. There are 67 bp from the total 157 bases. Figure 9A shows the 3D structure. Figure 9B shows the secondary structure that was directly obtained from RNAview. The nine anti-parallel helices make four long pseudo-helices. The two pseudo-helix axes [also annotated as P5a and P5b by Ferré-D'Amaré and Doudna (18)] on the left side of Figure 9B make an angle of ∼155°. The two pseudo-helix axes on the right make an angle of ∼160°. Since this is a complicated structure, some elements of the secondary structure from the RNAview are overlapped. Therefore, the graphic editor (RNAMLview) is required to rearrange the overlapped elements. Figure 9C shows the secondary structure that was modified by RNAMLview program. It is seen that the secondary structure gives detailed annotation of the base pair interactions. The CPU time to generate this picture by RNAview program only takes 0.3 s (Del 340, Pentium 4, CPU 1.8G, with Linux system).
Base pair survey and statistics
Various examples of the 12 families of base pairs have been given (1). Here we report some statistics for these families of base pairs identified with the criteria described above. We selected 41 unique, well-refined X-ray crystal structures with resolutions of at least 3.0 Å from the current NDB database. If the structures were from the same source and similar, only one well-refined structure or the one with the highest resolution was selected. Nucleotides, dinucleotides and standard double-stranded helices were excluded. The selection of structures is representative of the different types of available crystal structures in which RNA is found alone or complexed to other molecules.
Calculations have been performed for four groups of structures (Table 2). The first group contains the structures of mostly single-stranded RNAs. The second group includes the protein–RNA complexes. The third group contains only the 30S and 50S ribosomal subunits. The fourth group contains protein–tRNA complexes.
Table 2. Representative RNA structures from the NDB grouped according to the structure type.
| NDB ID | Structure description | Res. (Å) | Reference |
|---|---|---|---|
| RNA | |||
| UR0007 | Sarcin/Ricin rRNA domain | 1.1 | (16) |
| UR0008 | Vitamin B12 binding RNA, cobalamin (vitamin B12) | 3.0 | (20) |
| UR0011 | Malachite green RNA aptamer, tetramethyl-rosamine | 2.8 | (21) |
| UR0015 | HIV-1(Lai) genomic RNA DIS. | 2.6 | (22) |
| UR0018 | JIIIabc | 2.9 | (23) |
| UR0019 | Ai5g group II self-splicing intron | 3.0 | (24) |
| UR0020 | RNA pseudoknot | 1.3 | (25) |
| URT068 | Tetraloop, hairpin | 3.0 | (26) |
| TR0001 | transfer RNA (Phe) | 1.9 | (13) |
| UR0012 | P4–P6 mutant RNA group I domain | 2.3 | (14) |
| DR0004 | RNA aptamer/cobalamin | 2.3 | (27) |
| DR0005 | Biotin-binding RNA pseudoknot, biotin | 1.3 | (28) |
| UHX026 | RNA/DNA hammerhead ribozyme | 2.6 | (17) |
| UR0009 | 4.5S RNA domain IV | 2.7 | (29) |
| Protein RNA complex | |||
| PR0037 | Signal recognition protein/RNA complex | 1.5 | (30) |
| PR0054 | Signal recognition particle 19 kDa protein/RNA complex | 1.8 | (31) |
| PRV002 | U1a mutant/RNA complex+glycerol | 1.9 | (32) |
| PRV020 | Satellite tobacco mosaic virus/RNA complex | 1.8 | (33) |
| PR0018 | Ribosomal protein L25/5 S rRNA complex | 1.8 | (34) |
| PR0055 | 15.5 kDa RNA binding protein/RNA complex | 2.9 | (35) |
| PR0074 | U1 ribonucleoprotein/RNA Hairpin ribozyme complex | 2.4 | (36) |
| PR0052 | Restrictocin/29-mer SRD RNA complex | 2.0 | (37) |
| PTR016 | Spliceosomal U2B′′-U2A′ protein complex bound to a fragment of U2 small nuclear RNA | 2.4 | (38) |
| PR0022 | RNA-binding protein nova-2/RNA | 2.4 | (39) |
| PR0047 | 30 S ribosomal protein S8p/RNA complex | 2.6 | (40) |
| PR0010 | HDV ribozyme/U1a protein (RNA binding domain) complex | 2.3 | (41) |
| RR0009 | Ribosomal protein L11/RNA complex | 2.6 | (42) |
| RR0012 | 50 S ribosomal protein L25/rRNA complex | 2.3 | (43) |
| PR0073 | Signal recognition particle 19 kDa protein/RNA complex | 2.3 | (44) |
| Ribosomal subunits | |||
| RR0033 | Refined large ribosomal subunit (50 S) | 2.4 | (45) |
| RR0056 | 30 S ribosomal subunit | 3.0 | (46) |
| Protein tRNA complexes | |||
| PR0006 | Threonyl-tRNA synthetase/tRNA(Thr) complex (e.c. 6.1.1.3) | 2.9 | (47) |
| PR0014 | Isoleucyl-tRNA synthetase (e.c. 6.1.1.5)/tRNA complex | 2.2 | (48) |
| PR0019 | Aspartyl-tRNA synthetase (e.c. 6.1.1.12)/tRNA complex, adenosine monophosphate, aspartyl-2′-deoxy-adenosine-5′-monophosphate | 2.4 | (49) |
| PR0029 | Valyl-tRNA synthetase (e.c. 6.1.1.9)/tRNA complex | 2.9 | (50) |
| PR0030 | Arginyl-tRNA synthetase (e.c. 6.1.1.19)/tRNA(Arg) complex | 2.2 | (51) |
| PR0057 | Prolyl-tRNA synthetase (e.c. 6.1.1.15) /tRNA complex | 2.9 | (52) |
| PR0059 | fMet formyltransferase (e.c. 2.1.2.9) /methionyl-tRNA complex | 2.8 | (53) |
| PTE003 | Glutaminyl-tRNA synthetase/tRNA complex | 2.3 | (54) |
| PR0004 | Elongation factor Tu/Cysteinyl tRNA complex | 2.6 | (55) |
| PR0060 | tRNA pseudouridine synthase B (e.c. 4.2.1.70)/RNA complex | 1.9 | (56) |
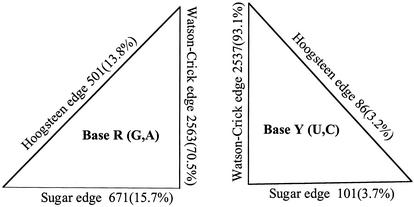
The edge occurrences for pyrimidines (Y) and purines (R) for the ensemble of structures (group 1) are shown in Figure 10. It is seen that the Watson–Crick edge dominates all other edges, since it includes both the standard and non-standard pairs with Watson–Crick geometry. While, for purine bases, interactions at the Hoogsteen and Sugar edges represent each ∼15% of base pairs, for pyrimidine bases the same edges represent only ∼3%. These numbers are the highest in the highly structured 50S and 30S rRNAs. Clearly, in purines, the N3 and N7 nitrogen atoms can make extra H bonds compared to pyrimidines. Interestingly also, the adenine bases present a clear preference for the Hoogsteen edge over the Sugar edge, while the opposite is true for the guanine bases. This can be understood from the edges of the R bases. For adenine, the amino group which is active as a donor in H bonds is on the Hoogsteen side, while for guanosine this group is on the Sugar side. For the pyrimidine bases, the Sugar edge is invariant.
Figure 10.
Statistics of the occurrences at each of the three edges for the R and Y bases. They were calculated from the 41 selected structures.
The occurrences of each type of base pair in each of the 12 families are given in Table 3 according to the family and the base pair type. As expected, the cis Watson–Crick/Watson–Crick pairs dominate the statistics and the Hoogsteen–Hoogsteen pairs in cis are not represented. This indicates that when the two glycosidic bonds are on the same side of the line connecting to the center of the two bases, the two bases are very favorable to form the Watson–Crick geometry but not at all to form Hoogsteen geometry. Among the non-canonical pairs, the cis families represent <10% and the trans families ∼20%. The cis Sugar/Sugar family is dominated by the isosteric A·G and G·A pairs [some pairs present in the tables of (1) would not appear in the numbers calculated here because of the condition imposed about the presence of at least one H-bond between heavy atoms]. In the cis Watson–Crick/Hoogsteen family, one finds mainly U·A and G·G pairs, while in the cis Watson–Crick/Sugar family, the isosteric A·A and A·C pairs are the most frequently observed (interestingly, the C·A pairs are much less frequent than the A·C pairs). The cis Hoogsteen/Sugar family, the platform family (19), contains essentially the A·A and U·G pairs with about twice as many U·G as A·A pairs.
Table 3. The occurrences of each type of base pair in each of the 12 families.
| All the unique RNA (RNA, protein-RNA, ribosomal, protein-tRNA) | ||||||||||||||||||
|---|---|---|---|---|---|---|---|---|---|---|---|---|---|---|---|---|---|---|
| Pair | A·A | A·C | C·A | A·G | G·A | A·U | U·A | C·C | C·G | G·C | C·U | U·C | G·G | G·U | U·G | U·U | SUM | % |
| WWc | 6 | 17 | 13 | 16 | 25 | 205 | 238 | 16 | 762 | 771 | 1 | 1 | 4 | 108 | 88 | 21 | 2292 | 72.3 |
| WHc | 1 | 0 | 0 | 1 | 0 | 1 | 14 | 4 | 1 | 0 | 0 | 2 | 18 | 0 | 2 | 1 | 45 | 1.4 |
| HWc | 0 | 0 | 1 | 1 | 2 | 5 | 0 | 0 | 0 | 1 | 0 | 0 | 2 | 0 | 1 | 2 | 15 | 0.5 |
| WSc | 7 | 4 | 4 | 2 | 0 | 0 | 2 | 4 | 4 | 4 | 0 | 0 | 2 | 2 | 2 | 0 | 37 | 1.2 |
| SWc | 3 | 2 | 13 | 1 | 4 | 2 | 8 | 2 | 2 | 3 | 0 | 1 | 1 | 1 | 2 | 0 | 45 | 1.4 |
| HHc | 0 | 0 | 0 | 0 | 0 | 0 | 0 | 0 | 0 | 0 | 1 | 0 | 0 | 0 | 0 | 0 | 1 | 0.0 |
| HSc | 1 | 0 | 0 | 0 | 0 | 4 | 0 | 0 | 0 | 0 | 0 | 0 | 0 | 0 | 1 | 0 | 6 | 0.2 |
| SHc | 13 | 1 | 2 | 0 | 2 | 0 | 2 | 1 | 0 | 1 | 0 | 2 | 0 | 25 | 0 | 0 | 49 | 1.5 |
| SSc | 0 | 0 | 0 | 13 | 13 | 0 | 0 | 0 | 2 | 4 | 0 | 0 | 2 | 2 | 2 | 0 | 38 | 1.2 |
| WWt | 24 | 1 | 1 | 0 | 1 | 6 | 8 | 1 | 4 | 10 | 1 | 0 | 5 | 2 | 2 | 3 | 69 | 2.2 |
| WHt | 8 | 0 | 15 | 0 | 0 | 0 | 72 | 3 | 3 | 0 | 0 | 0 | 3 | 0 | 1 | 1 | 106 | 3.3 |
| HWt | 9 | 9 | 1 | 0 | 0 | 26 | 0 | 1 | 0 | 1 | 0 | 0 | 8 | 0 | 3 | 8 | 66 | 2.1 |
| WSt | 0 | 0 | 0 | 9 | 0 | 0 | 1 | 0 | 2 | 1 | 0 | 0 | 0 | 3 | 0 | 1 | 17 | 0.5 |
| SWt | 1 | 1 | 0 | 0 | 14 | 2 | 1 | 2 | 1 | 2 | 0 | 0 | 0 | 1 | 6 | 2 | 33 | 1.0 |
| HHt | 28 | 0 | 2 | 2 | 0 | 0 | 1 | 0 | 4 | 0 | 0 | 0 | 0 | 0 | 0 | 0 | 37 | 1.2 |
| HSt | 6 | 3 | 1 | 76 | 0 | 0 | 0 | 2 | 0 | 0 | 1 | 0 | 4 | 0 | 1 | 0 | 94 | 3.0 |
| SHt | 7 | 0 | 5 | 0 | 97 | 0 | 2 | 3 | 0 | 0 | 0 | 5 | 4 | 4 | 0 | 0 | 127 | 4.0 |
| SSt | 0 | 0 | 0 | 38 | 49 | 0 | 0 | 0 | 0 | 0 | 0 | 0 | 7 | 0 | 0 | 0 | 94 | 3.0 |
| SUM | 114 | 38 | 58 | 159 | 207 | 251 | 349 | 39 | 785 | 798 | 4 | 11 | 60 | 148 | 111 | 39 | ||
| % | 3.6 | 1.2 | 1.8 | 5.0 | 6.5 | 7.9 | 11 | 1.2 | 24.8 | 25.2 | 0.1 | 0.3 | 1.9 | 4.7 | 3.5 | 1.2 |
In the trans families, sharp differences appear. For example the most frequent trans Watson–Crick/Watson–Crick pairs are the A·A followed by the G·C and then A·U pairs. The trans Watson–Crick/Hoogsteen family is dominated by A·U and U·A pairs. The typical hydrogen bond pattern is N3-H…N7 and N6-H…O2, where N6 and N7 are for adenine. The trans Sugar/Sugar family is dominated, like its cis counterpart, by the A·G and G·A pairs. The least populated trans family is the Watson–Crick/Sugar one, where the most significant pair is the A·G pair with the A sharing its Watson–Crick with the Sugar edge of the G exclusively. In the family with a highest population, the trans Hoogsteen/Sugar, the most significant pair is again the A·G pair with the A sharing its Hoogsteen edge with the Sugar edge of the G exclusively.
The LW classification is based on geometry as defined by the types of edges with H-bonding interactions. In order to understand an RNA fold and recognize its variations, it is more important to visualize and remember which edges interact rather than the types of atoms in close contacts (which can, in principle, be deduced from the knowledge of the interacting edges). The proposed classification is clearly a simplification (10) but it still allows, at the same time, constraints on the topology of the interacting strands and variability in the precise types and numbers of H-bonds being formed. Variability in number and types of H-bonds may have several origins, like molecular dynamics, local environments, availability of water and ionic contacts, or experimental, refinement or human errors in the crystallographic work. Here, we do not tabulate single and bifurcated H-bonds.
CONCLUSIONS
In order to identify and classify automatically RNA base pairs, three programs have been developed. BPView allows dynamic navigation through the base pairing of the 3D RNA structure. A web interface to this tool is available from http://ndbserver.rutgers.edu/services/BPviewer/. RNAview and RNAMLview produce projections of the structures following the nomenclature previously proposed (3) and produce visual representations as well as outputs in the accepted RNAML syntax for exchange of data (4). The base pairing interactions are annotated on secondary structure diagrams which can be easily manipulated with a symbolic representation which allows for a rapid identification of RNA motifs (15). RNAview is available as a web service at http://ndbserver.rutgers.edu/services/rna_viewer/. The application RNAMLView may be downloaded from http://ndbserver.rutgers.edu/services/ and a new version, as a web service, will be available soon. In addition RNAview 2D projections have been calculated for all structures in the NDB and these are available on the NDB Atlas pages (http://ndbserver.rutgers.edu/atlas/).
Acknowledgments
ACKNOWLEDGEMENTS
We would like to thank Dr Xiang-Jun Lu and Dr Zukang Feng for helpful discussions. This work was funded by grants from the NSF and DOE supporting the NDB project and by the Institut Universitaire de France. N.L. is supported by NIH 2R15 GM55898.
REFERENCES
- 1.Leontis N., Stombaugh,J. and Westhof,E. (2002) The non-Watson–Crick base pairs and their associated isostericity matrices. Nucleic Acids Res., 30, 3497–3531. [DOI] [PMC free article] [PubMed] [Google Scholar]
- 2.Saenger W. (1983) Principles of Nucleic Acid Structure. Springer-Verlag, New York, NY. [Google Scholar]
- 3.Leontis N.B. and Westhof,E. (2001) Geometric nomenclature and classification of RNA base pairs. RNA, 7, 499–512. [DOI] [PMC free article] [PubMed] [Google Scholar]
- 4.Waugh A., Gendron,P., Altman,R., Brown,J.W., Case,D., Gautheret,D., Harvey,S.C., Leontis,N., Westbrook,J., Westhof,E. et al. (2002) A standard syntax for exchanging RNA information. RNA, 8, 707–717. [DOI] [PMC free article] [PubMed] [Google Scholar]
- 5.Berman H.M., Olson,W.K., Beveridge,D.L., Westbrook,J., Gelbin,A., Demeny,T., Hsieh,S.H., Srinivasan,A.R. and Schneider,B. (1992) The Nucleic Acid Database—a comprehensive relational database of three-dimensional structures of nucleic acids. Biophys. J., 63, 751–759. [DOI] [PMC free article] [PubMed] [Google Scholar]
- 6.Berman H.M., Westbrook,J., Feng,Z., Gilliland,G., Bhat,T.N., Weissig,H., Shindyalov,I.N. and Bourne,P.E. (2000) The Protein Data Bank. Nucleic Acids Res., 28, 235–242. [DOI] [PMC free article] [PubMed] [Google Scholar]
- 7.Bernstein F.C., Koetzle,T.F., Williams,G.J., Meyer,E.E., Brice,M.D., Rodgers,J.R., Kennard,O., Shimanouchi,T. and Tasumi,M. (1977) Protein Data Bank: a computer-based archival file for macromolecular structures. J. Mol. Biol., 112, 535–542. [DOI] [PubMed] [Google Scholar]
- 8.Bourne P.E., Berman,H.M., Watenpaugh,K., Westbrook,J.D. and Fitzgerald,P.M.D. (1997) The macromolecular Crystallographic Information File (mmCIF). Methods Enzymol., 277, 571–590. [DOI] [PubMed] [Google Scholar]
- 9.Gendron P., Lemieux,S. and Major,F. (2001) Quantitative analysis of nucleic acid three-dimensional structures. J. Mol. Biol., 308, 919–936. [DOI] [PubMed] [Google Scholar]
- 10.Lemieux S. and Major,F. (2002) RNA canonical and non-canonical base pairing types: a recognition method and complete repertoire. Nucleic Acids Res., 30, 4250–4263. [DOI] [PMC free article] [PubMed] [Google Scholar]
- 11.Olson W.K., Bansal,M., Burley,S.K., Dickerson,R.E., Gerstein,M., Harvey,S.C., Heinemann,U., Lu,X.-J., Neidle,S., Shakked,Z. et al. (2001) A standard reference frame for the description of nucleic acid base-pair geometry. J. Mol. Biol., 313, 229–237. [DOI] [PubMed] [Google Scholar]
- 12.Allen F.H., Bellard,S., Brice,M.D., Cartright,B.A., Doubleday,A., Higgs,H., Hummelink,T., Hummelink-Peters,B.G., Kennard,O., Motherwell,W.D.S. et al. (1979) The Cambridge Crystallographic Data Centre: computer-based search, retrieval, analysis and display of information. Acta Crystallogr. A, 35, 2331–2339. [Google Scholar]
- 13.Shi H. and Moore,P.B. (2000) The crystal structure of yeast phenylalanine tRNA at 1.93 Å resolution: a classic structure revisited. RNA, 6, 1091–1105. [DOI] [PMC free article] [PubMed] [Google Scholar]
- 14.Juneau K., Podell,E.R., Harringon,D.J. and Cech,T.R. (2001) Structural basis of the enhanced stability of a mutant ribozyme domain and a detailed view of RNA-solvent interactions. Structure, 9, 221–231. [DOI] [PubMed] [Google Scholar]
- 15.Leontis N., Stombaugh,J. and Westhof,E. (2002) Motif prediction in ribosomal RNAs. Lessons and prospects for automated motif prediction in homologous RNA molecules. Biochimie, 84, 961–973. [DOI] [PubMed] [Google Scholar]
- 16.Correll C.C., Wool,I.G. and Munishkin,A. (1999) The two faces of the Escherichia coli 23 S rRNA sarcin/ricin domain: the structure at 1.11 Å resolution. J. Mol. Biol., 292, 275–287. [DOI] [PubMed] [Google Scholar]
- 17.Pley H.W., Flaherty,K.M. and McKay,D.B. (1994) Three-dimensional structure of a hammerhead ribozyme. Nature, 372, 68–74. [DOI] [PubMed] [Google Scholar]
- 18.Ferré-D'Amaré A.R. and Doudna,J.A. (1999) RNA folds: insights from recent crystal structures. Annu. Rev. Biophys. Biomol. Struct., 28, 57–73. [DOI] [PubMed] [Google Scholar]
- 19.Cate J.H., Gooding,A.R., Podell,E., Zhou,K., Golden,B.L., Szewczak,A.A., Kundrot,C.E., Cech,T.R. and Doudna,J.A. (1996) RNA tertiary structure mediation by adenosine platforms. Science, 273, 1696–1699. [DOI] [PubMed] [Google Scholar]
- 20.Sussman D., Nix,J.C. and Wilson,C. (2000) The structural basis for molecular recognition by the vitamin B12 RNA aptamer. Nature Struct. Biol., 7, 53–57. [DOI] [PubMed] [Google Scholar]
- 21.Baugh C., Grate,D. and Wilson,C. (2000) 2.8 Å crystal structure of the malachite green aptamer. J. Mol. Biol., 301, 117–128. [DOI] [PubMed] [Google Scholar]
- 22.Ennifar E., Walter,P., Ehresmann,B., Ehresmann,C. and Dumas,P. (2001) Crystal structures of coaxially-stacked kissing complexes of the HIV-1 RNA dimerization initiation. Nature Struct. Biol., 8, 1064–1068. [DOI] [PubMed] [Google Scholar]
- 23.Kieft J.S., Zhou,K., Grech,A., Jubin,R. and Doudna,J.A. (2002) Crystal structure of an RNA tertiary domain essential to HCV IRES-mediated translation initiation. Nature Struct. Biol., 9, 370–374. [DOI] [PubMed] [Google Scholar]
- 24.Zhang L. and Doudna,J.A. (2002) Structural insights into group II Intron catalysis and branch-site selection. Science, 295, 2084–2088. [DOI] [PubMed] [Google Scholar]
- 25.Egli M., Minasov,G., Su,L. and Rich,A. (2002) Metal ions and flexibility in viral RNA pseudoknot at atomic resolution. Proc. Natl Acad. Sci. USA, 99, 4302–4307. [DOI] [PMC free article] [PubMed] [Google Scholar]
- 26.Perbandt M., Nolte,A., Lorenz,S., Erdmann,V.A. and Betzel,C. (1998) Crystal structure of domain E of Thermus flavus 5S rRNA: a helical RNA structure including a hairpin loop. FEBS Lett., 429, 211–215. [DOI] [PubMed] [Google Scholar]
- 27.Sussman D. and Wilson,C. (2000) A water channel in the core of the vitamin B(12) RNA aptamer. Structure Fold Des., 8, 719–727. [DOI] [PubMed] [Google Scholar]
- 28.Nix J., Sussman,D. and Wilson,C. (2000) The 1.3 Ångstrom crystal structure of a biotin-binding pseudoknot and the basis for RNA molecular recognition. J. Mol. Biol., 296, 1235–1244. [DOI] [PubMed] [Google Scholar]
- 29.Jovine L., Hainzl,T., Oubridge,C., Scott,W.G., Li,J., Sixma,T.K., Wonacott,A., Skarzynski,T. and Nagai,K. (2000) Crystal structure of the Ffh and EF-G binding sites in the conserved domain IV of Escherichia coli 4.5S RNA. Structure, 8, 527–540. [DOI] [PubMed] [Google Scholar]
- 30.Batey R.T., Sagar,M.B. and Doudna,J.A. (2001) Structural and energetic analysis of RNA recognition by a universally conserved protein from the signal recognition particle. J. Mol. Biol., 307, 229–246. [DOI] [PubMed] [Google Scholar]
- 31.Wild K., Sinning,I. and Cusack,S. (2001) Crystal structure of an early protein-RNA assembly complex of the signal recognition particle. Science, 294, 598–601. [DOI] [PubMed] [Google Scholar]
- 32.Oubridge C., Ito,H., Evans,P.R., Teo,C.H. and Nagai,K. (1994) Crystal structure at 1.92 Å resolution of the RNA-binding domain of the U1A spliceosomal protein complexed with an RNA hairpin. Nature, 372, 432–438. [DOI] [PubMed] [Google Scholar]
- 33.Larson S.B., Day,J., Greenwood,A. and McPherson,A. (1998) Refined structure of satellite tobacco mosaic virus at 1.8 Å resolution. J. Mol. Biol., 277, 37–59. [DOI] [PubMed] [Google Scholar]
- 34.Lu M. and Steitz,T.A. (2000) Structure of Escherichia coli ribosomal protein L25 complexed with a 5S rRNA fragment at 1.8 Å resolution. Proc. Natl Acad. Sci. USA, 97, 2023–2028. [DOI] [PMC free article] [PubMed] [Google Scholar]
- 35.Vidovic I., Nottrott,S., Hartmuth,K., Luhrmann,R. and Ficner,R. (2000) Crystal structure of the spliceosomal 15.5 Kd protein bound to a U4 Snrna fragment. Mol. Cell, 6, 1331–1342. [DOI] [PubMed] [Google Scholar]
- 36.Rupert P.B., Massey,A.P., Sigurdsson,S.T. and Ferré-D'Amaré,A.R. (2002) Transition state stabilization by a catalytic RNA. Science, 298, 1421–1424. [DOI] [PubMed] [Google Scholar]
- 37.Yang X., Gerczei,T., Glover,L. and Correll,C.C. (2001) Crystal structures of restrictocin-inhibitor complexes with implications for RNA recognition and base flipping. Nature Struct. Biol., 8, 968–973. [DOI] [PubMed] [Google Scholar]
- 38.Price S.R., Evans,P.R. and Nagai,K. (1998) Crystal structure of the spliceosomal U2B′′-U2A′ protein complex bound to a fragment of U2 small nuclear RNA. Nature, 394, 645–650. [DOI] [PubMed] [Google Scholar]
- 39.Lewis H.A., Musunuru,K., Jensen,K.B., Edo,C., Chen,H., Darnell,R.B. and Burley,S.K. (2000) Sequence-specific RNA binding by a Nova KH domain: implications for paraneoplastic disease and the fragile X syndrome. Cell, 100, 323–332. [DOI] [PubMed] [Google Scholar]
- 40.Tishchenko S., Nikulin,A., Fomenkova,N., Nevskaya,N., Nikonov,O., Dumas,P., Moine,H., Ehresmann,B., Ehresmann,C., Piendl,W. et al. (2001) Detailed analysis of RNA-protein interactions within the ribosomal protein S8-rRNA complex from the Archaeon Methanococcus jannaschii. J. Mol. Biol., 311, 311–324. [DOI] [PubMed] [Google Scholar]
- 41.Ferré-D'Amaré A.R., Zhou,K. and Doudna,J.A. (1998) Crystal structure of a hepatitis delta virus ribozyme. Nature, 395, 567–574. [DOI] [PubMed] [Google Scholar]
- 42.Wimberly B.T., Guymon,R., McCutcheon,J.P., White,S.W. and Ramakrishnan,V. (1999) A detailed view of a ribosomal active site: the structure of the L11-RNA complex. Cell, 97, 491–502. [DOI] [PubMed] [Google Scholar]
- 43.Fedorov R.V., Meshcheryakov,V.A., Gongadze,G.M., Fomenkova,N.P., Nevskaya,N.A., Selmer,M., Laurberg,M., Kristensen,O., Al-Karadaghi,S., Liljas,A. et al. (2001) Structure of ribosomal protein TL5 complexed with RNA provides new insights into the CTC family of stress proteins. Acta Crystallogr., D. Biol. Crystallogr., 57, 968–976. [DOI] [PubMed] [Google Scholar]
- 44.Hainzl T., Huang,S. and Sauer-Eriksson,A.E. (2002) Structure of the SRP19-RNA complex and implications for signal recognition particle assembly. Nature, 417, 767–771. [DOI] [PubMed] [Google Scholar]
- 45.Klein D.J., Schmeing,T.M., Moore,P.B. and Steitz,T.A. (2001) The Kink-Turn: a new RNA secondary structure motif. EMBO J., 20, 4214–4221. [DOI] [PMC free article] [PubMed] [Google Scholar]
- 46.Ogle J.M., Murphy,F.V.IV, Tarry,M.J. and Ramakrishnan,V. (2002) Selection of tRNA by the ribosome requires a transition from an open to a closed form. Cell, 111, 721–732. [DOI] [PubMed] [Google Scholar]
- 47.Sankaranarayanan R., Dock-Bregeon,A.-C., Romby,P., Caillet,J., Springer,M., Rees,B., Ehresmann,C., Ehresmann,B. and Moras,D. (1999) The xtructure of threonyl-tRNA synthetase-tRNA(Thr) complex enlightens its repressor activity and reveals an essential zinc ion in the active site. Cell, 97, 371–381. [DOI] [PubMed] [Google Scholar]
- 48.Silvian L.F., Wang,J. and Steitz,T.A. (1999) Insights into editing from an Ile-tRNA synthetase structure with tRNA(IIe) and Muciprocin. Science, 285, 1074–1077. [PubMed] [Google Scholar]
- 49.Eiler S., Dock-Bregeon,A.-C., Moulinier,L., Thierry,J.-C. and Moras,D. (1999) Synthesis of aspartyl-tRNA(Asp) in _Escherichia coli_—a snapshot of the second step. EMBO J, 18, 6532–6541. [DOI] [PMC free article] [PubMed] [Google Scholar]
- 50.Fukai S., Nureki,O., Sekine,S., Shimada,A., Tao,J., Vassylyev,D.G. and Yokoyama,S. (2000) Structural basis for double-sieve discrimination of L-valine from L-isoleucine and L-threonine by the complex of tRNA(val) and valyl-tRNA synthetase. Cell, 103, 793–803. [DOI] [PubMed] [Google Scholar]
- 51.Delagoutte B., Moras,D. and Cavarelli,J. (2000) tRNA aminoacylation by arginyl-tRNA synthetase: induced conformations during substrates binding. EMBO J., 19, 5599–5610. [DOI] [PMC free article] [PubMed] [Google Scholar]
- 52.Yaremchuk A., Tukalo,M., Grotli,M. and Cusack,S. (2001) A succession of substrate induced confomational changes ensures the amino acid specificity of Thermus thermophilus prolyl-tRNA synthetase: comparison with histidyl-tRNA synthetase. J. Mol. Biol., 309, 989–1002. [DOI] [PubMed] [Google Scholar]
- 53.Schmitt E., Panvert,M., Blanquet,S. and Mechulam,Y. (1998) Crystal structure of methionyl-tRNAfMet transformylase complexed with the initiator formyl-methionyl-tRNAfMet. EMBO J., 17, 6819–6826. [DOI] [PMC free article] [PubMed] [Google Scholar]
- 54.Rath V.L., Silvian,L.F., Beijer,B., Sproat,B.S. and Steitz,T.A. (1998) How glutaminyl-tRNA synthetase selects glutamine. Structure, 6, 439–449. [DOI] [PubMed] [Google Scholar]
- 55.Nissen P., Thirup,S., Kjeldgaard,M. and Nyborg,J. (1999) The crystal structure of Cys-tRNACys-EF-Tu-GDPNP reveals general and specific features in the ternary complex and in tRNA. Structure, 7, 143–156. [DOI] [PubMed] [Google Scholar]
- 56.Hoang C. and Ferré-D'Amaré,A.R. (2001) Cocrystal structure of a tRNA Psi55 pseudouridine synthase: nucleotide flipping by an RNA-modifying enzyme. Cell, 107, 929–939. [DOI] [PubMed] [Google Scholar]
