A nuclear protein tyrosine phosphatase is required for the inactivation of Stat1 (original) (raw)
Abstract
The Stat1 activation-inactivation cycle involves phosphorylation of Stat1 in the cytoplasm, translocation to the nucleus, and then a return of the protein to the cytoplasm in a dephosphorylated state. However, the intracellular site of Stat1 dephosphorylation has not been determined. As receptor signaling declines, the flow of activated Stat1 molecules should be to the site of their dephosphorylation. We found that upon receptor-Janus kinase inactivation, either gradual or abruptly induced by staurosporine treatment, the flow of Stat1 was from cytoplasm to the nucleus and the nucleus was the final compartment in which phosphorylated Stat1 was detected. N-terminal mutants of Stat1, previously shown to remain phosphorylated for a longer time than wild-type Stat1, were able to enter the nucleus and were not inactivated in the presence of staurosporine, directly demonstrating that these mutations affect phosphatase access and/or activity during the normal dephosphorylation of Stat1. In the presence of sodium vanadate, a phosphatase inhibitor, phosphorylated Stat1 accumulated in the nucleus as the total amount of Stat1 in the cytoplasm declined to low levels. We conclude that the nucleus is the site of Stat1 inactivation and that dephosphorylation is required for the rapid nuclear export of Stat1.
A wide variety of cytokines and growth factors activate intracellular signaling events involving Janus kinases (JAKs) and signal transducers and activators of transcription (STATs). Ligand activation of JAKs leads to phosphorylation of the receptor chains to which the STATs bind. In turn the STATs become phosphorylated on tyrosine, dimerize, translocate to the nucleus, and activate transcription (reviewed in refs. 1–6). Cessation of signaling from the cell surface probably involves at least two events. Evidence shows that receptor inactivation requires some proteolytic event, perhaps internalization and turnover at least of the ligand (reviewed in refs. 7 and 8). In addition, proteins (variously termed SOCS, SSI, or JAB) are induced by cytokine action. These proteins bind to the JAKs or receptors and inhibit further activity (9–12). Because signaling to the nucleus by cytokines typically lasts only minutes to a few hours, activated STAT molecules also must be removed (13–15). Aberrant activation of JAKs or STATs is associated with abnormal development and cellular transformation, demonstrating the importance of understanding the cessation of cytokine signaling (16, 17).
We previously have demonstrated that upon IFN-γ treatment, Stat1 undergoes an activation-inactivation cycle (18). The Stat1 is phosphorylated in the cytoplasm, translocates to the nucleus, and then returns quantitatively to the cytoplasm in a dephosphorylated state, clearly implying that inactivation of Stat1 requires dephosphorylation. Other groups have reached similar conclusions about other STAT molecules (19–21). However, the intracellular compartment in which dephosphorylation occurs remains unknown. By analyzing the flow of Stat1 from cytoplasm to nucleus upon receptor-JAK inactivation and the effect of phosphatase inhibition on Stat1 subcellular localization, we provide evidence that a nuclear tyrosine phosphatase plays a major role in Stat1 inactivation and nuclear export.
MATERIALS AND METHODS
Cell Culture, Antibodies, and Inhibitors.
Bud-8 euploid human fibroblasts (American Type Culture Collection) were grown in DMEM supplemented with 10% FCS and nonessential amino acids (complete medium). U3A cells and derivatives were grown in DMEM supplemented with 10% cosmic calf serum (HyClone). U3A cells complemented with murine wild-type Stat1 (p91) and murine Stat1 lacking the first 154 aa (Δ154) were obtained from Robert Schreiber, Washington University (22). U3A cells complemented with human p91 and p84 have been described (23). A U3A line containing Stat1 with an arginine to alanine mutation at amino acid 31 (U3R) was obtained from Ke Shuai, University of California, Los Angeles (24). Human IFN-γ (a gift from Amgen Biologicals) was used at 5 ng/ml. A mAb to the C terminus of Stat1 was purchased from Santa Cruz Biotechnology. Staurosporine (Sigma) was dissolved in DMS0 and used at a final concentration of 500 nM.
Cell Extracts, Immunoprecipitations, and SDS/PAGE. Cytoplasmic and nuclear extracts were prepared as described (18, 23). Cells first were lysed at 4°C by gently pipetting after 5 min in hypotonic buffer (20 mM Hepes, pH 7.9/10 mM KCl/0.1 mM Na3VO4/1 mM EDTA/10% glycerol/0.5 mM PMSF/1 μg/ml aprotinin/1 μg/ml pepstatin/1 μg/ml leupeptin/1 mM DTT) with 0.2% NP-40. After centrifugation at 4°C (13,000 rpm in microfuge) for 10 sec, supernatants were collected as cytoplasmic extracts. Nuclear extracts were prepared by resuspension of the crude nuclei in high-salt buffer (hypotonic buffer with 20% glycerol and 420 mM NaCl) at 4°C for 30 min, and the supernatants were collected after centrifugation at 4°C (13,000 rpm) for 5 min. Whole-cell extracts were prepared as described (18, 23).
Immunoprecipitations were carried out by adding 3 μg of anti-Stat1 C-terminal mAb to each extract and incubating for 1–2 hr at 4°C followed by incubation at 4°C with protein G-Sepharose for 2 hr. Samples then were washed three times with whole-cell extract buffer and then twice with PBS followed by resuspension in 2× Laemmli running buffer. Samples then were heated at 80°C for 4 min and subjected to SDS/PAGE on a 6% gel.
Electrophoretic Mobility Shift Assay (EMSA).
Cytoplasmic, nuclear, and whole-cell extracts (see above) were used for EMSA. EMSA was carried out on 4% 29:1 acrylamide-bisacrylamide gels as described (18, 25) by using M67 SIE (26) oligonucleotide as probe.
Pulse–Chase Experiments.
Bud-8 fibroblasts were cultured in methionine-free DMEM containing 1% fetal bovine serum and nonessential amino acids. 35S-labeled methionine (1,175 Ci/mmol; NEN) was added at 100 μCI/ml to each 10-cM plate for 2.5 hr. Label then was removed, and fresh medium was added. After IFN-γ treatment for the indicated times, nuclear and cytoplasmic extracts were prepared and immunoprecipitation and SDS/PAGE was carried out as described above. Gels then were soaked in fixative (25% isopropanol, 10% acetic acid) for 35 min followed by soaking in Amplify (Amersham Pharmacia) for 45 min. Gels were dried at 80°C for 1 hr and then exposed to film.
Quantitation Using the PhosphorImager.
The intensities of radioactive bands in dried gels were quantitated by using a PhosphorImager (Molecular Dynamics). For 35S-labeling experiments, the band of interest in each lane was boxed and quantitated, and an identical area above each band of interest was boxed as background and subtracted. Data were expressed as a percent of the baseline (the value in the no treatment lane of the cytoplasmic extracts). For EMSAs, the value in the no treatment lane was subtracted from all of the other values and data were expressed as a percent of the value indicated.
RESULTS
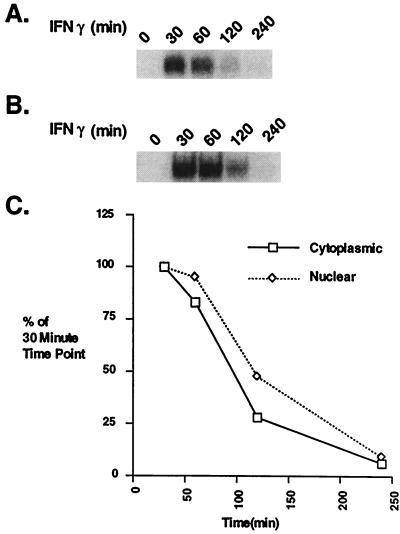
The Flow of Activated Stat1 Upon Receptor-JAK Inactivation Is From Cytoplasm to Nucleus. We first compared, by using a DNA binding assay, the time course of activation and inactivation of Stat1 separately in the cytoplasm and nucleus of IFN-γ-treated Bud-8 cells (Fig. 1). [We previously have shown that DNA binding correlates with tyrosine-phosphorylated Stat1 (18).] As receptor signaling ceases, the concentration of activated Stat1 molecules should be highest in the compartment where dephosphorylation occurs.
Figure 1.
The decay in Stat1 DNA binding in cytoplasmic and nuclear extracts during an IFN-γ time course. (A and B) EMSA analysis with an M67 probe. Cytoplasmic (A) and nuclear (B) extracts were prepared from Bud-8 normal human fibroblasts treated with IFN-γ for the indicated times. (C) Plot of the PhosphorImager analysis of Stat1 DNA binding complexes at various times after IFN-γ treatment.
The Stat1 DNA binding in the nucleus gradually decayed over the 4-hr time course. The binding activity in the cytoplasm was always lower than that in the nucleus (Fig. 1C), a result compatible with cytoplasmic activation, translocation to, and inactivation in the nucleus.
Flow of Activated Stat1 Upon Staurosporine Addition.
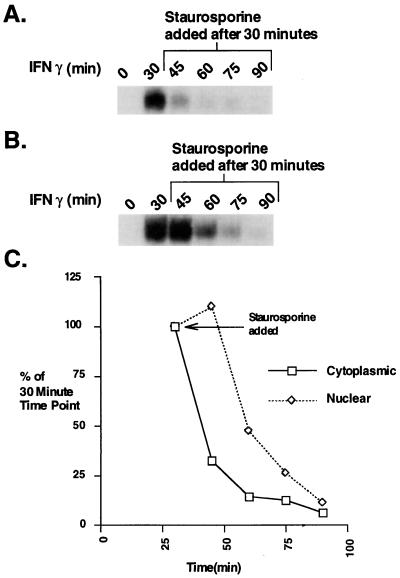
Because inactivation of the receptor-JAK complex is gradual (18), we examined nuclear and cytoplasmic Stat1 DNA binding activity when staurosporine was used to abruptly block further kinase activity after 30 min of IFN treatment (18, 27, 28) (Fig. 2). The pattern of decay of nuclear Stat1 DNA binding activity closely resembled that shown previously (18). After 15 min of staurosporine treatment, the amount of nuclear DNA binding was still maximal, and only after an additional 15 min was there a detectable drop. In contrast, the DNA binding activity in the cytoplasm declined more than 50% within the first 15 min of staurosporine treatment and was only 10% of maximum after 30 min (Fig. 2C). (This result has been obtained in several separate experiments.) Without replenishment from the receptor, continued nuclear import of activated Stat1 apparently caused a reduction in cytoplasmic phosphorylated Stat1, leading to a large decrease in cytoplasmic DNA binding in the first 15 min. The nuclear DNA binding activity at first was maintained because of the continued translocation of Stat1, and only after another 15 min was the loss of nuclear DNA binding activity through dephosphorylation detected. These experiments are most compatible with the nucleus as the site of Stat1 inactivation.
Figure 2.
The decay in Stat1 DNA binding in cytoplasmic and nuclear extracts upon staurosporine addition. (A and B) EMSA analysis with an M67 probe. Cytoplasmic (A) and nuclear (B) extracts were prepared from Bud-8 normal human fibroblasts treated with IFN-γ for 30 min followed by staurosporine (500 nM) for the indicated times. (C) Plot of the PhosphorImager analysis of Stat1 DNA binding complexes at various times after IFN-γ plus staurosporine treatment.
The Effect of Staurosporine Treatment on Inactivation-Defective Stat1 Mutants. Because staurosporine is a powerful kinase inhibitor with pleiotropic effects on cells (29, 30) we wanted to explore whether activation of a nonspecific phosphatase or protease might account for the rapid inactivation of Stat1. Cell lines in which N-terminal mutations in Stat1 lead to an IFN-γ-dependent, long-lasting, tyrosine-phosphorylated state (24) were used to test the possibility that staurosporine might lead to nonspecific removal of STAT proteins.
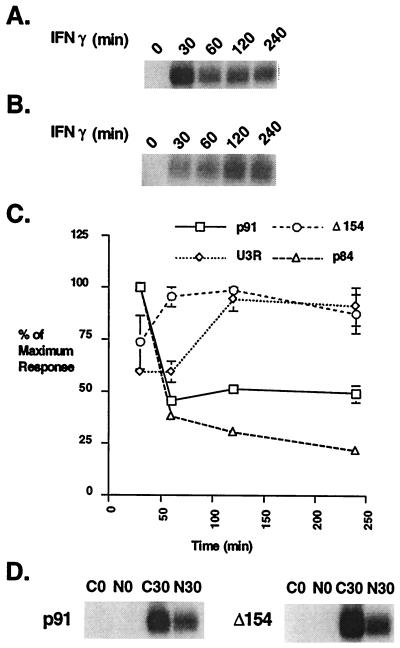
Various Stat1 expression constructs were introduced into U3A cells that contain no endogenous Stat1, and cell lines were selected that expressed the different Stat1 proteins. The constructs used in these experiments included both murine and human full-length Stat1 (p91), the naturally occurring splice variant, Stat1β, lacking the last 38 aa (p84), a deletion mutant lacking the first 154 aa (Δ154), and an arginine to alanine mutant at amino acid 31 (U3R) (22–24). Because several reports have questioned nuclear entry by N-terminal Stat mutant proteins, we tested the Δ154 deletion and showed by cell fractionation that it enters the nucleus approximately as well as wild-type protein (Fig. 3D). The activation-inactivation cycle of Stat1 in several of these cell lines then was tested (Fig. 3). The mouse wild-type protein behaved similarly to human wild-type Stat1 (p91), rising to a maximum at 30 min and declining by 4 hr (data not shown). Removal of or mutations within the N terminus of Stat1, however, led to a prolonged time course of STAT inactivation. Both the U3R mutant, which previously had been shown to exhibit prolonged activation (24), and the Δ154 mutant had DNA binding activity that peaked at approximately 120 min and remained high through 240 min.
Figure 3.
The IFN-γ time course in U3A cells complemented with wild-type and N-terminal mutants of Stat1. (A) EMSA analysis with an M67 probe. Whole-cell extracts were prepared from U3A cells complemented with wild-type human Stat1 (p91) treated with IFN-γ for the indicated times. (B) Same as A except U3A cells complemented with Stat1 containing a mutation in arginine 31 to alanine (U3R). (C) Plot of the PhosphorImager analysis of Stat1 DNA binding complexes in U3A cells complemented with different Stat1 constructs (p91, p84, U3R, and Δ154) at various times after IFN-γ treatment. The results shown are the average of two experiments with error bars representing the SEM. (D) EMSA analysis with an M67 probe. Cytoplasmic (C) and nuclear (N) extracts were prepared from U3A cells complemented with wild-type human Stat1 (p91) or with Stat1 lacking the first 154 aa (Δ154) and treated with IFN-γ for the indicated times.
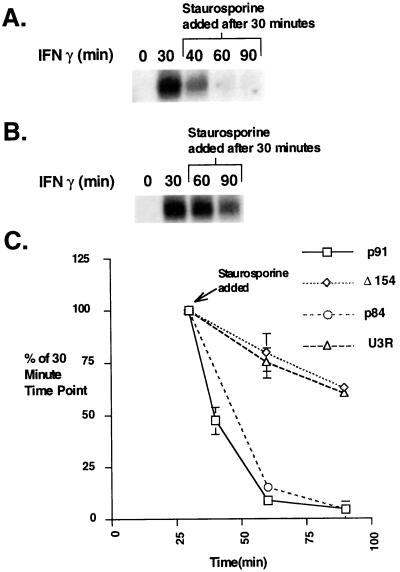
Wild-type Stat1 and the N-terminal mutant proteins also differed in their inactivation after staurosporine treatment (Fig. 4). The DNA binding activity of Stat1α and β (p91 and p84) in whole-cell extracts declined more than 50% in 10 min and to almost zero after only 30 min of treatment with staurosporine. The activity of the N-terminal mutants, however, remained at approximately 80% of the maximal level after 30 min of staurosporine treatment. These results indicate that the rapid decline in wild-type Stat1 DNA binding activity upon staurosporine treatment is not caused by nonspecific removal but most likely reveals the actual time course of inactivation of phosphorylated wild-type Stat1 molecules.
Figure 4.
Effect of staurosporine treatment on U3A cells complemented with wild-type and N-terminal mutants of Stat1. (A) EMSA analysis with an M67 probe. Whole-cell extracts were prepared from U3A cells complemented with wild-type human Stat1 (p91) treated with IFN-γ for 30 min followed by staurosporine (500 nM) for the indicated times. (B) Same as A except U3A cells complemented with Stat1 containing a mutation in arginine 31 to alanine (U3R). (C) Plot of the PhosphorImager analysis of Stat1 DNA binding complexes in U3A cells complemented with different Stat1 constructs (p91, p84, U3R, and Δ154) at various times after IFN-γ and staurosporine treatment. The results shown are the average of two experiments with error bars representing the SEM.
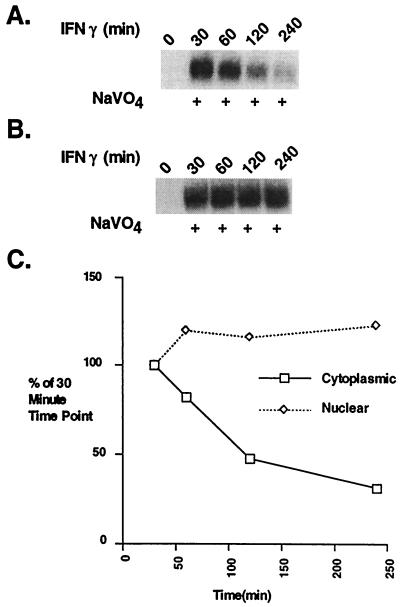
Vanadate Prolongs Stat1 DNA Binding Activity in the Nucleus As It Decreases in the Cytoplasm. We next tested whether phosphatase inhibition might lead to a decrease of cytoplasmic-activated Stat1 with accumulation in the nucleus, the putative compartment of inactivation. The first experiments used only EMSA determinations. In the presence of vanadate, Stat1 DNA binding activity decreased greatly in the cytoplasm whereas DNA binding activity in the nucleus remained high (Fig. 5). With cytoplasmic activity decreasing to such a low level, maintenance of this high level of nuclear DNA binding activity in the absence of further IFN-γ-stimulated phosphorylation strongly suggests that phosphorylated molecules are not able to exit the nucleus.
Figure 5.
The effect of vanadate on Stat1 DNA binding in cytoplasmic and nuclear extracts. (A and B) EMSA analysis with an M67 probe. Cytoplasmic (A) and nuclear (B) extracts were prepared from Bud-8 normal human fibroblasts treated with IFN-γ plus vanadate for the indicated times. (C) Plot of the PhosphorImager analysis of Stat1 DNA binding complexes at various times after IFN-γ plus vanadate treatment.
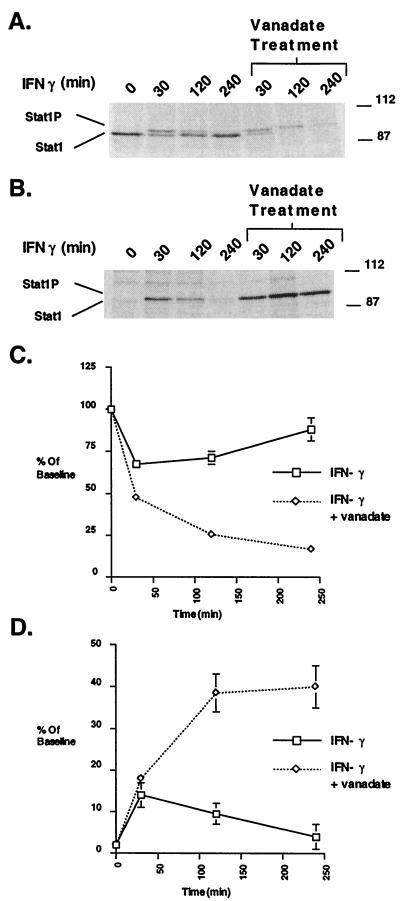
To better quantitate this effect during the activation-inactivation cycle, we used [35S]methionine labeling of Stat1. The results of one experiment are shown in Fig. 6 A (cytoplasmic) and B (nuclear). (Fig. 6 A and B are equal exposures but A represents only a quarter of the total cytoplasmic extract. Quantitation of two experiments is shown in C and D.) Before treatment, most of the Stat1 was in the cytoplasm. Upon IFN-γ addition, there was a decrease of total Stat1 in the cytoplasm as the Stat1 was tyrosine-phosphorylated (slower migration) and transported to the nucleus (left half of Fig. 6 A and B). At the end of the 4-hr cycle, the Stat1 had left the nucleus and the amount of Stat1 in the cytoplasm returned to close to initial levels (between 80% and 90%). The results were quite different when the cells also were treated with vanadate (right half of Fig. 6 A and B). The initial decrease of Stat1 in the cytoplasm still occurred at 30 min with a concomitant increase in the nucleus. At later time points, however, the amount of Stat1 in the nucleus rose to approximately 40% of the total labeled Stat1 in the cell whereas the amount of Stat1 in the cytoplasm decreased to about 15%.
Figure 6.
The effect of vanadate on the Stat1 activation-inactivation cycle analyzed by 35S labeling. (A) 35S labeling followed by immunoprecipitation with an anti-Stat1 mAb. Bud-8 fibroblasts were labeled with 35S for 2.5 hr as described in Materials and Methods. Label was removed, cells were washed in normal medium, and IFN-γ or IFN-γ plus vanadate was added. At the indicated time points, cytoplasmic and nuclear extracts were prepared. The cytoplasmic extracts then were subjected to SDS/PAGE and autoradiography. (B) Same as A except SDS/PAGE and autoradiography of nuclear extracts. (C) Plot of the PhosphorImager analysis of the Stat1 bands (both phosphorylated and unphosphorylated) in cytoplasmic extracts averaged from two separate experiments. Data are expressed as percent of baseline (the value in the no treatment lane of the cytoplasmic extracts). Error bars represent the SEM. (D) Plot of the PhosphorImager analysis of the Stat1 bands (both phosphorylated and unphosphorylated) in nuclear extracts averaged from two separate experiments. Data are expressed as percent of baseline (the value in the no treatment lane of the cytoplasmic extracts). Error bars represent the SEM.
As with our previous experiments, the total 35S recovery was lower when the maximal nuclear-phosphorylated Stat1 had been reached (18). It is possible therefore that the nuclear phosphoprotein may not be quantitatively extracted. If this were true then even more phosphorylated Stat1 molecules could be present in the nucleus upon vanadate treatment. The results of these experiments argue strongly that the nucleus is the normal site of Stat1 dephosphorylation, and in the absence of dephosphorylation the activated Stat1 molecules are trapped in the nucleus.
DISCUSSION
The major conclusion of the present work is that the STAT activation-inactivation cycle requires a nuclear dephosphorylation event. We showed earlier and repeated it here that in response to IFN-γ Stat1 becomes tyrosine-phosphorylated, enters the nucleus as a dimer, and after a brief period returns quantitatively (within the limits of measurement) to the cytoplasm as a nonphosphorylated molecule (Fig. 6 and ref. 18). The present experiments using staurosporine to stop further receptor-kinase signaling (Fig. 2) followed by assaying activated Stat1 in nuclear and cytoplasmic extracts add considerable weight to the earlier conclusions. Furthermore the conclusions about the time course of entry into the nucleus (complete in ≈15 min) and the short half-life of the nuclear signal (<20 min) were buttressed by the present time-course experiments (Figs. 1 and 2). Finally, the use of staurosporine was validated because N-terminal-truncated STATs, which are normally slowly dephosphorylated, are not artifactually dephosphorylated in staurosporine-treated cells.
Through the use of vanadate to inhibit phosphatase action and [35S]methionine labeling to quantitate Stat1, we found that a very large fraction (>40%) of the total labeled Stat1 remains trapped in the nucleus for hours when phosphatase action is blocked. As mentioned in the text, it appears that the recovery from the nucleus of activated Stat1 is incomplete. Thus probably well over half of the total Stat1 in the cell and all of the activated Stat1 is trapped in the nucleus in the vanadate-treated cells. The simplest explanation for these results is that normally the STAT dimer encounters a nuclear tyrosine phosphatase, becomes dephosphorylated, and is exported to efficiently continue the activation-inactivation cycle. We cannot, of course, rule out a coupled export-dephosphorylation event that could position the putative phosphatase outside the nucleus or that vanadate acts to block dephosphorylation and nuclear export through different processes.
These considerations generally highlight our ignorance about the nuclear-cytoplasmic transport systems and their interactions with the STAT molecules. Three facts seem established: (i) nuclear import of tyrosine-phosphorylated-STAT occurs, (ii) nuclear export of some form of STAT (likely dephosphorylated monomer) occurs to replenish the cytoplasm with nonphosphorylated Stat1 monomers, and (iii) interference with the amino terminus of Stat1 has an unexplained impact on dephosphorylation and possibly on the import-export balance of the STATs, if dephosphorylation is related to transport. The original experiments of Shuai and colleagues (24) leading to the third conclusion showed that an N-truncated Stat1 molecule (lacking 61 aa) and an N-terminal point mutation (R31A in U3R cells) resulted in long-lasting activation of Stat1 and long-lasting physiological effects (based presumably on transcriptional activity).
The mechanism for interaction of the STATs with the nuclear transport machinery has not yielded to straightforward attempts to locate STAT residues required for translocation. Several groups have described results that bear on import of STATs. In immunoprecipitation studies, tyrosine-phosphorylated Stat1 has been shown to interact with NPI-1, a component of the nuclear import machinery (31). Injection of anti-NPI-1 antibody into HeLa cells prevents Stat1 nuclear localization but the region of Stat1 required has not been located. Amino terminal swaps between STATs lowered the apparent entry in the nucleus, judged by immunofluorescence (32). The authors noted that by using traditional techniques of cell fractionation Stat1 mutants were still detectable in the nucleus, and it appears from the results reported here (Fig. 3) that import of Stat1 without its N terminus can occur in the absence of wild-type Stat1.
It seems possible that the regulated nuclear export of STATs control to some extent their cellular distribution. For example, a blockade of nuclear export is required for the accumulation of M phase promoting factor in the nucleus (33). Without this blockade, export is faster than import, and the majority of the molecules are detected in the cytoplasm. A similar phenomenon is observed with the proteins mitogen-activated protein kinase kinase and MAPKAP kinase 2 (34, 35). Our studies are compatible with rapid export of Stat1 monomers compared with dimers. This possibility, as well as a possible increase in nuclear import of Stat1 upon activation, could result in efficient nuclear accumulation of phosphorylated Stat1.
Tight coupling of export and dephosphorylation also may allow efficient inactivation of Stat1. As noted above, N-terminal mutants do not appear to accumulate in the nucleus as detected by immunofluorescence even though they are phosphorylated and appear to enter the nucleus by using other cell fractionation techniques (ref. 32 and Fig. 3). Recent work illustrates that a protein may be entering the nucleus but cannot be detected by immunofluorescence if export is more rapid than import (33–35). It is possible, therefore, that the N terminus plays a role in Stat1 nuclear export and perhaps mutations in the N terminus uncouple the normally tight association between Stat1 dephosphorylation and export; Stat1 N-terminal mutants may be able to be exported without first being dephosphorylated. Tight coupling between export and dephosphorylation may be required for efficient inactivation of Stat1.
Acknowledgments
We thank Dr. Robert D. Schreiber and Dr. Ke Shuai for providing cell lines. We also thank Dr. Curt Horvath for his helpful advice and Lois Cousseau for preparing the manuscript. This work was supported by National Institutes of Health Grants AI 32489 and AI 34420 (to J.E.D.). R.L.H. was supported by National Institutes of Health Training Grant CA 09673.
ABBREVIATIONS
JAK
Janus kinase
STATs
signal transducers and activators of transcription
EMSA
electrophoretic mobility shift assay
References
- 1.Darnell J E, Jr, Kerr I M, Stark G M. Science. 1994;264:1415–1421. doi: 10.1126/science.8197455. [DOI] [PubMed] [Google Scholar]
- 2.Darnell J E., Jr Science. 1997;277:1630–1635. doi: 10.1126/science.277.5332.1630. [DOI] [PubMed] [Google Scholar]
- 3.Leonard W J, O’Shea J J. Annu Rev Immunol. 1998;16:293–322. doi: 10.1146/annurev.immunol.16.1.293. [DOI] [PubMed] [Google Scholar]
- 4.Pellegrini S, Dusanter-Fourt I. Eur J Biochem. 1997;248:615–633. doi: 10.1111/j.1432-1033.1997.00615.x. [DOI] [PubMed] [Google Scholar]
- 5.Levy D, Darnell J E., Jr New Biol. 1990;2:923–928. [PubMed] [Google Scholar]
- 6.Schindler C, Darnell J E., Jr Annu Rev Biochem. 1995;64:621–651. doi: 10.1146/annurev.bi.64.070195.003201. [DOI] [PubMed] [Google Scholar]
- 7.Mukherjee S, Ghosh R N, Maxfield F R. Physiol Rev. 1997;77:759–803. doi: 10.1152/physrev.1997.77.3.759. [DOI] [PubMed] [Google Scholar]
- 8.Schmid S L. Annu Rev Biochem. 1997;66:511–548. doi: 10.1146/annurev.biochem.66.1.511. [DOI] [PubMed] [Google Scholar]
- 9.Starr R, Willson T A, Viney E M, Murray L J L, Rayner J R, Jenkins B J, Gonda T J, Alexander W S, Metcalf D, Nicola N A, Hilton D J. Nature (London) 1997;387:917–921. doi: 10.1038/43206. [DOI] [PubMed] [Google Scholar]
- 10.Yoshimura A, Ohkubo T, Kiguchi T, Jenkins N A, Gilbert D J, Copeland N G, Hara T, Miyajima A. EMBO J. 1995;14:2816–2826. doi: 10.1002/j.1460-2075.1995.tb07281.x. [DOI] [PMC free article] [PubMed] [Google Scholar]
- 11.Naka T, Narazaki M, Hirata M, Matsumoto T, Minamoto S, Aono A, Nishimoto N, Kajita T, Taga T, Yoshizaki K, et al. Nature (London) 1997;387:924–929. doi: 10.1038/43219. [DOI] [PubMed] [Google Scholar]
- 12.Endo T A, Masuhara M, Yokouchi M, Suzuki R, Sakamoto H, Mitsui K, Matsumoto A, Tanimura S, Ohtsubo M, Misawa H, et al. Nature (London) 1997;387:921–924. doi: 10.1038/43213. [DOI] [PubMed] [Google Scholar]
- 13.Shuai K, Schindler C, Prezioso V R, Darnell J E., Jr Science. 1992;259:1808–1812. doi: 10.1126/science.1281555. [DOI] [PubMed] [Google Scholar]
- 14.Silvennoinen O, Schindler C, Schlessinger J, Levy D E. Science. 1993;261:1736–1739. doi: 10.1126/science.8378775. [DOI] [PubMed] [Google Scholar]
- 15.Pallard C, Gouilleux F, Benit L, Cocault L, Souyri M, Levy D, Groner B, Gisselbrecht S, Dunsanter-Fourt I. EMBO J. 1995;14:2847–2856. doi: 10.1002/j.1460-2075.1995.tb07284.x. [DOI] [PMC free article] [PubMed] [Google Scholar]
- 16.Garcia R, Jove R. J Biomed Sci. 1998;5:79–85. doi: 10.1007/BF02258360. [DOI] [PubMed] [Google Scholar]
- 17.Su W C, Kitagawa M, Xue N, Xie B, Garofalo S, Cho J, Deng C, Horton W A, Fu X Y. Nature (London) 1997;386:288–292. doi: 10.1038/386288a0. [DOI] [PubMed] [Google Scholar]
- 18.Haspel R L, Salditt-Georgieff M, Darnell J E., Jr EMBO J. 1996;15:6262–6268. [PMC free article] [PubMed] [Google Scholar]
- 19.Yu C L, Burakoff S J. J Biol Chem. 1997;272:14017–14020. doi: 10.1074/jbc.272.22.14017. [DOI] [PubMed] [Google Scholar]
- 20.Callus B A, Mathey-Prevot B. Blood. 1998;91:3182–3192. [PubMed] [Google Scholar]
- 21.Lee C K, Bluyssen H A, Levy D E. J Biol Chem. 1997;272:21872–21877. doi: 10.1074/jbc.272.35.21872. [DOI] [PubMed] [Google Scholar]
- 22.Meraz M A, White J M, Sheehan K C F, Bach E A, Rodig S J, Dighe A S, Kaplan D H, Riley J K, Greenlund A C, Campbell D, et al. Cell. 1996;84:431–442. doi: 10.1016/s0092-8674(00)81288-x. [DOI] [PubMed] [Google Scholar]
- 23.Horvath C M, Wen Z, Darnell J E., Jr Genes Dev. 1995;9:984–994. doi: 10.1101/gad.9.8.984. [DOI] [PubMed] [Google Scholar]
- 24.Shuai K, Liao J Y, Song M M. Mol Cell Biol. 1996;16:4932–4941. doi: 10.1128/mcb.16.9.4932. [DOI] [PMC free article] [PubMed] [Google Scholar]
- 25.Fried M, Crothers D M. Nucleic Acids Res. 1981;9:6505–6525. doi: 10.1093/nar/9.23.6505. [DOI] [PMC free article] [PubMed] [Google Scholar]
- 26.Wagner B J, Hayes T E, Hoban C J, Cochran B H. EMBO J. 1990;9:4477–4484. doi: 10.1002/j.1460-2075.1990.tb07898.x. [DOI] [PMC free article] [PubMed] [Google Scholar]
- 27.Schindler C, Shuai K, Prezioso V R, Darnell J E., Jr Science. 1992;257:809–815. [PubMed] [Google Scholar]
- 28.Kessler D S, Levy D E. J Biol Chem. 1991;266:23471–23476. [PubMed] [Google Scholar]
- 29.Tamaoki T. Methods Enzymol. 1991;201:340–347. doi: 10.1016/0076-6879(91)01030-6. [DOI] [PubMed] [Google Scholar]
- 30.Ruegg U T, Burgess G M. Trends Pharmacol Sci. 1989;10:218–220. doi: 10.1016/0165-6147(89)90263-0. [DOI] [PubMed] [Google Scholar]
- 31.Sekimoto T, Imamoto N, Nakajima K, Hirano T, Yoneda Y. EMBO J. 1997;16:7067–7077. doi: 10.1093/emboj/16.23.7067. [DOI] [PMC free article] [PubMed] [Google Scholar]
- 32.Strehlow I, Schindler C. J Biol Chem. 1998;273:28049–28056. doi: 10.1074/jbc.273.43.28049. [DOI] [PubMed] [Google Scholar]
- 33.Hagting A, Karlsson C, Clute P, Jackman M, Pines J. EMBO J. 1998;17:4127–4138. doi: 10.1093/emboj/17.14.4127. [DOI] [PMC free article] [PubMed] [Google Scholar]
- 34.Fukuda M, Gotoh I, Gotoh Y, Nishida E. J Biol Chem. 1996;271:20024–20028. doi: 10.1074/jbc.271.33.20024. [DOI] [PubMed] [Google Scholar]
- 35.Engel K, Kotlyarov A, Gaestel M. EMBO J. 1998;17:3363–3371. doi: 10.1093/emboj/17.12.3363. [DOI] [PMC free article] [PubMed] [Google Scholar]
