Characterization of a population of small macrophages in induced sputum of patients with chronic obstructive pulmonary disease and healthy volunteers (original) (raw)
Abstract
The inflammatory process in chronic obstructive pulmonary disease (COPD) is active mainly in the airways, but little is known about the properties of the inflammatory cells in this compartment. We have studied leucocytes in induced sputum of COPD patients compared to controls in order to uncover what types of macrophages might be involved in the disease. Sputum induction was performed by inhalation of nebulized sodium chloride solution. Leucocytes were isolated and stained with specific monoclonal antibodies for analysis in flow cytometry. Flow cytometry analysis revealed that a major portion of CD14+ macrophages in COPD has lower forward scatter, i.e. they are small macrophages. While in control donors these small macrophages accounted for 6·9% of all macrophages, the percentage of these cells in COPD was 45·7%. CD14 and HLA-DR expression was high on these small sputum macrophages while the large sputum macrophages expressed only low levels of these surface molecules, both in control donors and COPD patients. Small sputum macrophages of both control donors and COPD patients showed higher levels of constitutive tumour necrosis factor (TNF) compared to the large macrophages. TNF was inducible by lipopolysaccharide (LPS) preferentially in the small sputum macrophages in the control donors but there was no further induction in COPD patients. These data show that the small sputum macrophages are a major macrophage population in COPD and that these cells exhibit features of highly active inflammatory cells and may therefore be instrumental in airway inflammation in COPD.
Keywords: COPD, induced sputum, macrophages
INTRODUCTION
COPD is an inflammatory disease of the airways that is induced by aerosols from cigarette smoke [1] and also by aerosol generated in insufficiently ventilated homes in underdeveloped areas of the world [2]. This inflammatory process leads to airway constriction and instability of the airways such that they can collapse during expiration [3].
The disease is characterized as a chronic inflammation of the airways that continues even when the primary stimulus is removed, i.e. when the patient discontinues smoking. Of the people exposed only 15% develop chronic obstructive pulmonary disease (COPD) and the reasons for this may lie in polymorphisms of genes involved in inflammation [4–6]. The chronic inflammation goes with obstruction of the airways, either by swelling and mucus production or by fibrotic changes of the airways that lead to instability of bronchi and bronchioli. As a result, forced expiration is severely decreased such that the fixed (i.e resistant to sympathicomimetics) reduction of forced expiratory volume in 1 second (FEV1) is a hallmark of the disease. Lung function is impaired further in many patients by the additional destruction of alveolar septae leading to emphysema [7].
In order to study the inflammatory response in COPD we have analysed induced sputum, which provides cells and mediators that are present in the large airways [8,9]. Several reports show an increase in the number of granulocytes in COPD [10–13], but macrophages are also considered important cells in COPD. These cells can be recovered from bronchoalveolar lavage and from induced sputum. Here, Alexis et al. have provided data to indicate that sputum and alveolar lavage are similar when looking at various cell surface markers [14]. In the present report we have analysed induced sputum in COPD patients compared to control donors and we have analysed the macrophages using monoclonal antibodies and flow cytometry. Using this approach we have discovered a strong increase in COPD of a population of small macrophages which appear to have a proinflammatory function based on their level of cell surface receptors and their capacity to produce the cytokine tumour necrosis factor (TNF). Therefore, these cells may be important for the pathophysiology of airway inflammation.
MATERIALS AND METHODS
Subjects
The study population consisted of 20 healthy control individuals, 17 COPD patients who were treated with both oral and inhaled glucocorticoids (COPD GC+), six COPD patients who were treated with inhaled glucocorticoids alone (COPD GCi) and five COPD patients with no glucocorticoids at all (COPD GC–). Table 1 shows biometric data of the four study groups. None of the COPD patients had a history of asthma or allergic rhinitis. All subjects with COPD had fixed airway obstruction which was defined as FEV1 < 80% predicted, with no reversibility (improvement of < 15% of baseline) after inhalation of 200 _µ_g salbutamol. All patients had normal serum levels of α1-antitrypsin and of IgG, IgA, except for two patients who had IgG levels of around 5 g/l. In addition we examined a small control group of three healthy asymptomatic smokers.
Table 1.
Study population
| GC | |||||||||
|---|---|---|---|---|---|---|---|---|---|
| Patient no. | Diagnosis | Sex | Age | FEV1 (%) | oral mg/day | inhal | Pack-years | Ex-S since years | % small M_Φ_ of total M_Φ_ |
| 1 | COPD GC+ | m | 77 | 49 | 10 | + | n.s. | 50·6 | |
| 2 | COPD GC+ | m | 79 | 40 | 15 | + | 90 | 14 | 14·4 |
| 3 | COPD GC+ | m | 75 | 57 | 20 | + | 40 | 37 | 21·4 |
| 4 | COPD GC+ | f | 77 | 62 | 10 | + | 50 | 3 | 12 |
| 5 | COPD GC+ | m | 67 | 44 | 28 | + | 25 | – | 29·7 |
| 6 | COPD GC+ | f | 58 | 64 | 17 | + | 20 | – | 22·2 |
| 7 | COPD GC+ | m | 65 | 34 | 15 | + | 50 | – | 47·4 |
| 8 | COPD GC+ | m | 66 | 28 | 12·5 | + | 50 | 3 | 42·3 |
| 9 | COPD GC+ | m | 70 | 42 | 15 | + | 25 | 0·5 | 32 |
| 10 | COPD GC+ | m | 71 | 56 | 10 | + | 25 | 31 | 48 |
| 11 | COPD GC+ | m | 72 | 73 | 25 | + | 20 | 26 | 61·2 |
| 12 | COPD GC+ | f | 56 | 50 | 10 | + | n.s. | 28·1 | |
| 13 | COPD GC+ | f | 57 | 62 | 10 | + | 125 | – | 52·7 |
| 14 | COPD GC+ | m | 77 | 60 | 12·5 | + | 45 | 2 | 88·5 |
| 15 | COPD GC+ | m | 68 | 36 | 15 | – | 110 | – | 34·2 |
| 16 | COPD GC+ | f | 52 | 53 | 12 | + | 50 | – | 83·4 |
| 17 | COPD GC+ | m | 58 | 12 | 10 | + | 70 | 0·1 | 84·6 |
| m12/f5 | 67·3 ± 8·6 | 48·3 ± 15·3 | 44·3 ± 24·0 | ||||||
| 18 | COPD GCi | f | 61 | 61 | – | + | 30 | – | 33·2 |
| 19 | COPD GCi | m | 76 | 77 | – | + | 60 | 30 | 44·7 |
| 20 | COPD GCi | m | 58 | 35 | – | + | 80 | 1 | 32 |
| 21 | COPD GCi | m | 72 | 68 | – | + | 70 | 0·5 | 6 |
| 22 | COPD GCi | m | 73 | 62 | – | + | 45 | 3 | 43·2 |
| 23 | COPD GCi | m | 67 | 26 | – | + | 80 | 3 | 60 |
| m5/f1 | 67·8 ± 7·1 | 54·8 ± 19·9 | 36·5 ± 18·0 | ||||||
| 24 | COPD GC– | m | 58 | 76 | – | – | 11 | – | 64·9 |
| 25 | COPD GC– | m | 58 | 41 | – | – | 40 | – | 41·3 |
| 26 | COPD GC– | m | 63 | 54 | – | – | 25 | – | 54·9 |
| 27 | COPD GC– | m | 74 | 45 | – | – | 100 | – | 86 |
| 28 | COPD GC– | f | 74 | 72 | – | – | 40 | 11 | 100 |
| m4/f1 | 65·4 ± 8·1 | 57·6 ± 15·8 | 69·4 ± 23·6 | ||||||
| Controls | m15/f5 | 37·8 ± 12·9 | 6·9 ± 6·7 |
COPD patients were receiving regular therapy with inhaled β-adrenergics and all of them were receiving either parenteral or twice-daily oral doses of theophylline. Furthermore, the COPD GC+ group received daily oral glucocorticoids, some of them in addition by inhalation. Patients who received inhalative glucocorticoids (GC) had either Budesonid (range 600–1600 _µ_g/day), Fluticason (range 500–600 _µ_g/day) or Beclometason (400 _µ_g/day). All the COPD patients were recruited for production of induced sputum during a stable state of disease at least 10 days after treatment of exacerbation.
Healthy volunteer donors were recruited from hospital personnel. All individuals in the healthy control group were non-smokers and had no history of lung diseases. None of them had an airway infection in the 4-week period of sputum induction.
Written informed consent was obtained from each individual. The protocol was approved by the Ethics Committee of the Medical School of the Ludwig-Maximilians-University (Munich, Germany).
Sputum induction and processing
Sputum induction.
Sputum induction was performed as described previously [15,16]. In brief, the subjects were instructed to mouthwash with water. Sputum induction was performed by stepwise inhalations of 10 min each with increasing concentrations of sodium chloride (0·9%, 3%, 4% and 5% in healthy individuals and 0·9% and 3·0% in COPD patients) nebulized by an ultrasonic nebulizer (Multisonic LS 290, Schill, Probstzella, Germany). This device generates 3–4 _µ_m aerosols at a maximum saline output of 0·75 ml/min. After mouthwashing and blowing the nose again, individuals were encouraged to cough deeply. Sputum was coughed into Petri dishes (d = 13·5 cm) and processed immediately. The total nebulization time in the COPD patient groups did not exceed 10 min, whereas it was up to 40 min in the healthy control donors, dependent on the time-point when sputum was produced.
Sputum processing.
After careful isolation of sputum solid phase, as described in Spanevello et al. [17], total weight was determined and recorded. To homogenize the solid phase of the sputum samples by cleavage of disulphide bonds of mucin glycoproteins, two volume parts of sputolysin reagent (Calbiochem-Novabiochem, La Jolla, CA, USA) containing 6·5 m m dithiothreitol and 100 m m phosphate buffer (pH 7·0) were added. After vortexing briefly, the mixture was incubated at 37°C and vortexed every 10 min until the sputum was homogenized, in total no longer than 60 min. The sputum samples were diluted with 1 volume phosphate buffered saline (Gibco, Karlsruhe, Germany) and cells were then pelleted by centrifugation for 10 min at 400 g and 4°C. The resulting sputum cells of the different inhalation steps (0·9%, 3%, 4% and 5% saline) were pooled.
Analysis of sputum cells by microscopy
The resulting cell pellet (see above) was dissolved in lipopolysaccharide (LPS)-free RPMI-1640 cell culture medium modified with 1% l-glutamine, 2000 U/ml penicillin, 2 mg/ml streptomycin, 1% non-essential amino acids, 10% low LPS fetal calf serum (all purchased from Gibco, Karlsruhe, Germany) and 1% of _o_xalacetate, _p_yruvate and _i_nsulin supplement (OPI) (Sigma, Taufkirchen, Germany). Total cell number was determined using a Neubauer haemocytometer (Table 2). For differential cell counts, which were performed by an observer blind to the clinical characteristics of the subjects, slides were prepared using cytospins and stained with DiffQuick (Dade Behring, Marburg, Germany). At least 300 leucocytes per slide were analysed. Contamination of squamous cells was less than 10% in all samples.
Table 2.
Cellular composition of sputum samples
| Control donors n = 20 | COPD GC− n = 5 | COPD GCi n = 6 | COPD GC+ n = 17 | |
|---|---|---|---|---|
| Total cell count (count × 106) | 0·8 ± 1·0 | 29·8 ± 59·4 | 3·9 ± 5·7 | 11·4 ± 16·8 |
| Granulocytes (%) | 35·8 ± 21·6 | 79·0 ± 15·4 | 79·3 ± 9·5 | 86·9 ± 4·9 |
| Macrophages (%) (microscopy) | 56·6 ± 21·9 | 20·3 ± 14·3 | 20·3 ± 9·6 | 11·3 ± 4·7 |
| Macrophages (%) (FACS analysis) | 52·8 ± 13·9 | 24·9 ± 14·0 | 20·6 ± 8·8 | 18·9 ± 10·4 |
Characterization of sputum cells by flow cytometry
Surface markers.
Isolated and washed sputum cells were stained with specific monoclonal antibodies or the corresponding isotype control from the same manufacturer. The following antibodies were used: CD14, RMO52-PC5 (isotype: mouse IgG2a-PC5); and HLA-DR, Immu357-PC5 (isotype: mouse IgG1-PC5; all Beckman Coulter, Krefeld, Germany). At least 5000 macrophages were analysed and fluorescence intensity was expressed as specific mean channels (delta MnIX). Previous studies have found no substantial change of either CD14 or HLA-DR after incubation of leucocytes with DTT [18]. In order to reduce problems with autofluorescence we employed phycoerythrin-cyan 5 antibody conjugates which emit at a wavelength of >600 nm (red).
Intracellular proteins.
Intracellular staining for TNF was performed using the Cytofix/Cytoperm kit (no. 2075KK, Pharmingen, Heidelberg, Germany) according to the manufacturer's instructions. In brief, up to 1 × 10⁶ sputum cells in 1 ml culture medium + 10% fetal calf serum (FCS) or 600 µl of heparinized blood from the same donor as control were incubated in the presence of 10 _µ_g Brefeldin A/ml (Sigma B-7651; Taufkirchen, Germany) and either left untreated or stimulated with 1 _µ_g LPS/ml (from Salmonella minnesota; Sigma L-6261; Taufkirchen, Germany) for 4 h at 37°C. Erythrocytes in whole blood samples were then first lysed with CoulterQ-Prep reagents (Beckman Coulter, Krefeld, Germany) and both samples stained with CD14-PC5. Sputum cells and blood samples were then processed equally while using anti-TNF-phycoerythrin (PE) (Becton Dickinson, Heidelberg, Germany) for intracellular staining. As a control for the specificity of the anti-TNF antibody we used a 10-fold molar excess (0·8 _µ_g) of human rTNF (kindly provided by Dr D. Männel, Regensburg, Germany). After staining with CD14-PC5 cells were washed twice in phosphate-buffered saline (PBS)/2% FCS and then incubated 20 min with Cytofix/Cytoperm at 4°C for permeabilization. After two washing steps with PBS/2% FCS, cells were incubated with anti-TNF-PE or with anti-TNF-PE plus recombinant TNF (rTNF) as control together with Perm/Wash and PBS/2% FCS. After a final wash cells were analysed in an EPICS XL (Beckman Coulter, Krefeld, Germany) flow cytometer while gating on CD14 positive cells for small macrophages and on forward versus side scatter for large macrophages.
Statistics
Statistical analysis was performed using Student's _T_-test. We compared each of the COPD patients group with the control group and the three different COPD groups against each other. A value P < 0·05 was considered significant. In addition we performed an analysis of variance (anova) test for the figures that compared more than two groups (Figs 1 and 2). Significance to the level P < 0·05 was expressed as ‘yes’ or ‘no’.
Fig. 1.
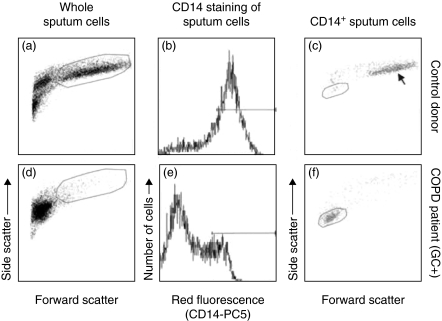
Scatter analysis of induced sputum samples. Whole sputum samples of a control donor (a) and a COPD GC+ patient (d) in forward versus side scatter analysis. The cells within the large frame represent the large macrophages: 66% of total cells in the control donor and 1·2% for the COPD GC+ patient in the given example. (b,e) The fluorescence histogram for CD14-PC5 gated on all leucocytes. The horizontal bar marks the CD14 positive proportion of cells. Forward versus side scatter of these cells is shown in (c) and (f) for all CD14 positive cells. The arrow in (c) shows the scatter position of the large sputum macrophages. The small sputum macrophages are shown in the small frames in (c) (control donor, 4% of all cells, 6·7% of all macrophages) and (f) (COPD GC+, 8·3% of all cells, 29·7% of all macrophages).
Fig. 2.
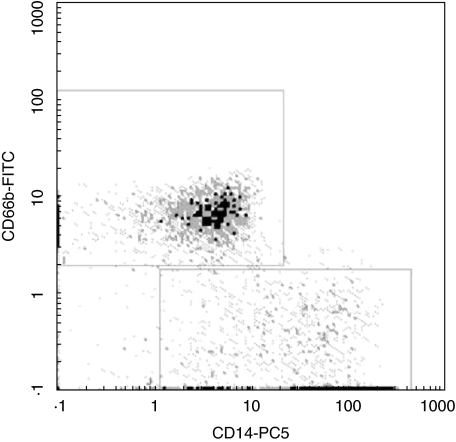
Discrimination between granulocytes and macrophages. Whole sputum cells of a COPD patient were costained with CD14-PC5 and CD66b-FITC. The upper gate (a) shows the population of CD14-negative but CD66b-positive granulocytes whereas the lower gate (b) represents the CD14-positive, but CD66b-negative sputum macrophages (one representative out of five experiments).
RESULTS
Cellular composition of induced sputum samples by microscopy
We compared the cellular composition in induced sputum samples from 20 healthy volunteers with five COPD patients without steroid therapy (COPD GC–), six with inhalative glucocorticoids only (COPD GCi) and 17 COPD patients treated with both oral and inhalative glucocorticoids (COPD GC+). Table 2 shows the results from cell differentiation obtained from microscopic analysis of cytospin samples stained with DiffQuick dye. The total leucocyte counts obtained were 0·8 × 106 in controls, while in COPD numbers were increased to an average of 13·5 × 106 with a wide range in recovery. Lowest values were found in GCi patients (Table 2). The percentage of macrophages as assessed by light microscopy was 56·7 ± 21·9% in healthy volunteers compared to 14·9 ± 9·0% in COPD. The percentage of macrophages in COPD was decreased due to a relative increase of the granulocytes. However, in absolute numbers there was an average increase of macrophages by factor 2·5 when looking at all COPD patients studied. Among these the GCi patients showed macrophage numbers similar to controls (Table 2).
Characterization of sputum macrophages by flow cytometry
We next turned to flow cytometry, because in light microscopy it is often difficult to identify macrophages clearly. Initially we compared the differences in scatter profile of normal control sputum samples and COPD patients. As shown in Fig. 1, a major part of the cells in the control sample (Fig. 1a) represent large macrophages (marked with large frame), whereas almost no large macrophages can be detected in COPD patients (Fig. 1d, large frame). In order to focus on macrophages we then used staining with a PC5 conjugated mouse monoclonal antibody to CD14 (Fig. 1b,e). When we gated on the CD14 positive cells (marked with the bar in Fig. 1b and 1e) and analysed their light scatter properties we detected the population of large sputum macrophages in control donors (Fig. 1c, arrow). By contrast, in COPD (Fig. 1f) a major population of CD14 positive macrophages show low forward–side scatter, indicating lower cell size. We therefore termed these cells ‘small sputum macrophages’. These small macrophages, as gated in Fig. 1f, account for 30% of all macrophages in this example. By comparison, in the control donor these macrophages, as gated in Fig. 1c, comprise 6·7% of all macrophages. The light scatter properties of the small sputum macrophages suggest that they are low in size. In order to confirm this we determined the size of macrophages in cytospin preparations by microscopy. The average size of small macrophages in control donors is 23·6 ± 4·4 (n = 5) and in COPD patients it is 10·1 ± 4·3 _µ_m (n = 5). This confirms that the majority of macrophages in COPD sputum is smaller compared to the respective cells from healthy donors. In order to demonstrate that the small sputum macrophages are clearly distinct from granulocytes, we performed co-staining with CD14 and the granulocyte marker CD66b. As shown in Fig. 2, the CD14+ cells are clearly negative for CD66b. To further confirm that the CD14+ and HLA-DR+ cells are the same population, we demonstrated in a two-colour fluorescence analysis with CD14-PC5 and HLA-DR-FITC that the CD14+ small macrophages are also positive for HLA-DR (data not shown). This double-positive population is not contaminated with HLA-DR positive lymphocytes, because the whole sputum sample contains less then 0·005% CD3-positive cells.
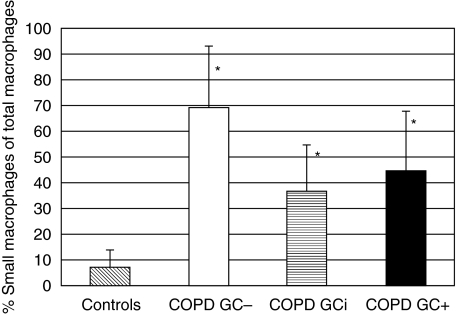
The average percentage of small sputum macrophages among all macrophages based on scatter and CD14 expression is summarized in Fig. 3. For control individuals the small sputum macrophages account for 6·9 ± 6·7% of all macrophages, while the percentage of the cells in average of all COPD patients is 47·1 ± 24·6%. For comparison, we examined three asymptomatic smokers (average of 6 pack years) and also detected elevated levels of small macrophages with a percentage of 35 ± 19% among all macrophages, while the total leucocyte counts were equal as in the non-smoking controls (0·47 ± 0·3 × 106). In some patients (nos 14, 16, 17 and 28 in Table 1) the small macrophages accounted for more than 80% of all macrophages. GC– patients had somewhat higher values compared to the GC-treated patients, but the differences were not significant (Fig. 3). On average the percentage of small sputum macrophages in all COPD patients was increased by a factor of 6·8 when compared to control donors. This demonstrates that the small sputum macrophages are a major macrophage population in COPD. Our cohort included out-patients in remission and these also showed high percentages of small sputum macrophages (77·6 ± 15·7% of all macrophages; n = 3, patients 3, 22 and 27). We have also analysed a group of five healthy smokers. The mean percentage of small sputum macrophages of all macrophages accounted for 56·3 ± 31·7% in this group and was thus increased compared to the controls.
Fig. 3.
Percentage of small sputum macrophages of total macrophages. Given is the average percentage of small sputum macrophages among the total number of macrophages: 6·9 ± 6·7% in control donors, 69·4 ± 23·6% in COPD GC–, 36·5 ± 18·0 in COPD GCi and 44·2 ± 23·9% in COPD GC+ patients. P < 0·05 in controls compared to all COPD groups (asterisks). Using the anova test with a _P_-level < 0·05, all COPD groups are significantly different from controls; COPD GCi and COPD GC+ are both different from COPD GC–, but no significant difference could be detected in the COPD GCi from the COPD GC+ group.
Having shown that there is an additional population of small macrophages we then determined the total number and percentage of all sputum macrophages by flow cytometry. These data show that in healthy control donors the percentage of macrophages accounted for 52·8 ± 13·9% of all sputum leucocytes compared to 20·4 ± 10·6% in all three COPD patient groups, which is comparable to the microscopy determination (Table 2).
CD14 and HLA-DR expression
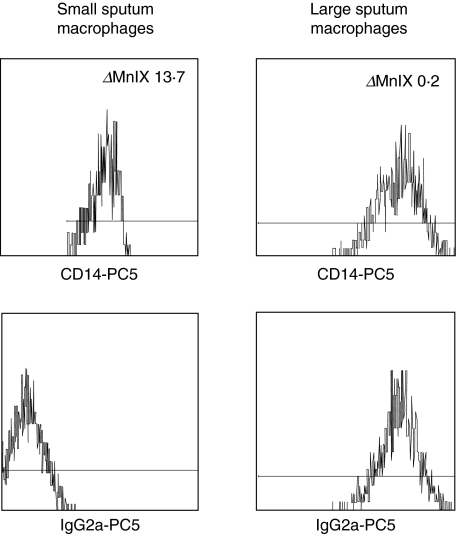
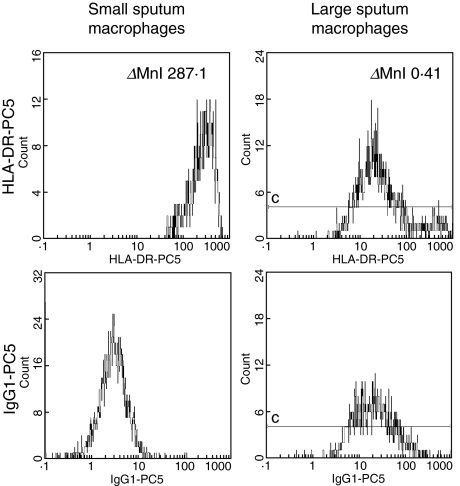
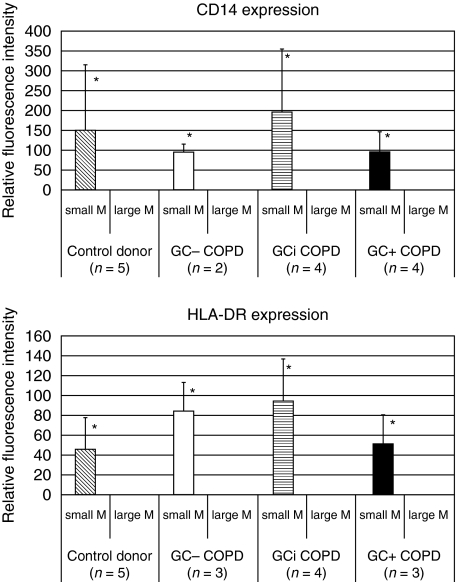
Next we compared the level of expression of CD14, the LPS-receptor, and the expression of class II antigen HLA-DR on the two macrophage subsets by determining specific fluorescence intensity, i.e. by subtracting channels for isotype control from channels for CD14 and HLA-DR antibodies. Figure 4 reveals the CD14 expression on both macrophage subsets in a representative COPD GC+ patient. The upper panel shows the fluorescence intensity for CD14–PC5 on small (left histogram) and large (right histogram) sputum macrophages, whereas the fluorescence intensity of the specific isotype control is shown in the lower panel. In this example the resultant delta mean channel for CD14 is 13·7 for the small and 0·2 for the large macrophages, revealing a 68-fold stronger expression on the small macrophages. The expression of HLA-DR in Fig. 5 is generated from the same COPD GC+ patient as the data in Fig. 4. The fluorescence intensity calculated in delta mean channels for the small sputum macrophages (left panel) accounts for 287·1, whereas it is 0·41 for the large macrophages (right panel). Figure 6 summarizes the results of the four study groups. The expression for the large sputum macrophages was set to 1 for better comparison. Expression of CD14 (Fig. 6, upper panel) on small macrophages is significantly higher compared to the large macrophages, and this was found for controls (152-fold higher) and in all three COPD groups (in average 136-fold higher). Similar results were obtained for the HLA-DR antigen (Fig. 6, lower panel). It was 47-fold increased in healthy controls and 79-fold in COPD.
Fig. 4.
CD14 expression on sputum macrophages. Whole sputum cells of a COPD GC+ patient were stained with either CD14-PC5 (upper panel) or the corresponding isotype control mouse IgG2a-PC5 (lower panel). Shown is the specific cell surface expression of CD14 in the small (left panel) and the large (right panel) sputum macrophages. The _Δ_MnIX value for the small sputum macrophages is 13·7, whereas it is 0·2 for the large sputum macrophages.
Fig. 5.
HLA-DR expression on sputum macrophages. Whole sputum cells of a COPD GC+ patient were stained with either HLA-DR-PC5 (upper panel) or the corresponding isotype control mouse IgG1-PC5 (lower panel). Shown is the specific cell surface expression of HLA-DR in the small (left panel) and the large (right panel) sputum macrophages. The _Δ_MnIX value for the small sputum macrophages is 287·1, whereas it is 0·4 for the large sputum macrophages.
Fig. 6.
CD14 and HLA-DR expression. Shown is the relative fluorescence intensity of the small sputum macrophages of the different study groups in relation to the large macrophages that was set at 1 for comparison. For CD14 (upper panel) the small macrophages in controls reveal a 152·1 ± 161·6-fold stronger expression compared to large macrophages. The values were 95·2 ± 19·7-fold higher in COPD GC–, 195·4 ± 154·6-fold in COPD GCi and 96·4 ± 50·1-fold higher in COPD GC+ patients. Results for HLA-DR expression (lower panel) on small macrophages: 47·2 ± 31·4-fold stronger in controls, 85·5 ± 27·5-fold in COPD GC–, 95·0 ± 42·5 in COPD GCi and 52·1 ± 29·6 in COPD GC+ 0. P < 0·05 for small macrophages compared to large macrophages for CD14 and HLA-DR in all groups studied (asterisks). Using the anova test with a _P_-level < 0·05 there are no significant differences neither between small macrophages of the control group and the three COPD groups nor between the three COPD groups, concerning CD14 and HLA-DR expression.
The increase in small sputum macrophages compared to the large macrophages in both CD14 and HLA-DR was statistically significant in all three groups. Antigen expression on the small macrophages in control and COPD groups were comparable (differences not significant). The data indicate that the small sputum macrophages may be functionally more competent cells.
Production of TNF
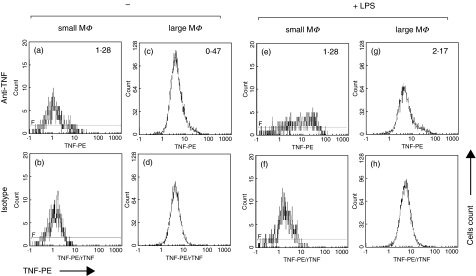
In order to examine the inflammatory potential of the small and large sputum macrophages we analysed TNF production after 4 h of culture without or with LPS. Figure 7 gives the data on intracellular TNF obtained in a healthy volunteer. The upper panel (Figs 7a,c,e,g) gives the fluorescence intensity for intracellular TNF, the lower panel (Figs 7b,d,f,h) shows the corresponding controls with addition of a 10-fold molar excess of rTNF. In the example given there is some constitutive TNF production in small sputum macrophages that were left untreated for 4 h (Fig. 7a,b, delta MnI (_Δ_MnI) 1·28), whereas these cells show a strong increase in LPS-induced TNF production after 4 h stimulation (Fig. 7e,f, _Δ_MnI 12·8). The large sputum macrophages exhibit almost no constitutive TNF production (Fig. 7c,d, _Δ_MnI 0·47) and they produce only small amounts of TNF after LPS stimulation (Fig. 7g,h, _Δ_MnI 2·17).
Fig. 7.
TNF production in a control donor. Whole sputum cells were incubated for 4 h ± 1 _µ_g LPS/ml and counterstained with CD14-PC5. The upper panel (a, c, e, and g) shows the fluorescence intensity for TNF gated on small or large macrophages, the lower panel (b, d, f and h) the corresponding controls with 10-fold molar excess of rTNF.
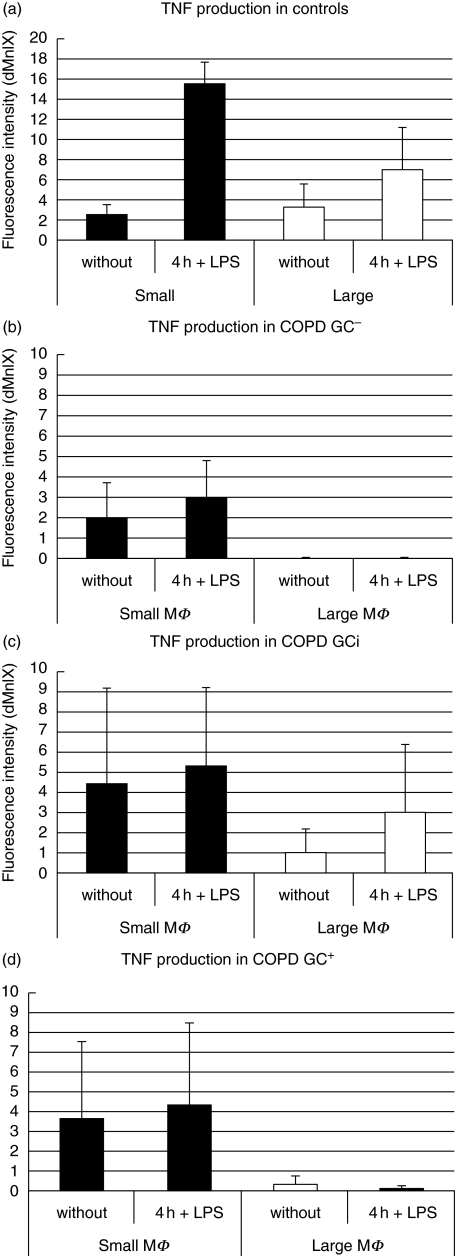
TNF data from control donors and COPD patients are summarized in Fig. 8. Panel (a) demonstrates constitutive TNF in small and large macrophages in control donors. LPS stimulation increased TNF by factor 6 in small macrophages but only by factor 2 in large macrophages. In COPD patients (panels b, c and d) the small macrophages produce constitutive TNF but there is no increase after LPS stimulation. The large macrophages of the COPD patients are incompetent for both constitutive and LPS-induced TNF production, except for the GCi- patients, where these cells show some activity (Fig. 8c). Taken together, these data show that the small sputum macrophages are functionally more competent and that in many COPD patients they are the exclusive TNF producers.
Fig. 8.
TNF production of the study groups in comparison. Results are shown in _Δ_MnI for the two macrophage populations (P < 0·05 for small macrophages compared to large macrophages).
DISCUSSION
In the present study we describe a strong increase of a population of small macrophages in sputum of patients with COPD. Most of our COPD patients were admitted to the hospital for exacerbation and they were studied after the disease had been stabilized by therapy. The more advanced stage of disease in our cohort is reflected in the low mean of FEV1 that was 51·4 ± 16·2% in average of all patients. The majority of patients was studied post-treatment of exacerbation shortly before discharge, but small sputum macrophages were also increased in out-patients with stable COPD. Nevertheless, exacerbation may contribute to enhance small sputum macrophages. The numbers and properties of small sputum macrophages still need to be studied in a larger group of patients with stable COPD. Longitudinal studies of COPD patients over the course of their disease may also help to define a possible influence of exacerbation on this parameter.
Consistent with earlier reports, we found in induced sputum that in apparently healthy control donors the majority of the cells were macrophages [19,20], and this was seen both by morphology and flow cytometry. Also, we can confirm that in COPD the majority of cells are neutrophilic granulocytes as reported previously [10–13].
What was not noted previously is that in COPD there is a large proportion of small macrophages which in light scatter histograms overlap with the granulocytes (Fig. 1). These cells can be identified readily when monoclonal antibodies against antigens such as CD14 are used for identification of macrophages. Although overlapping in light scatter histograms with the granulocytes these cells were clearly of macrophage nature, based on the absence of CD66b (Fig. 2) and on the expression of CD14 and HLA-DR antigens. Also these CD14 positive cells were found to be positive for CD68 by intracellular immunofluorescence (data not shown) and they were negative for CD3. Hence, based on this pattern of markers (CD14+, CD68+, HLA-DR+, CD66b–, CD3–) these cells can be assigned to the monocyte/macrophage lineage.
We found small macrophages in sputum of healthy donors to account for 6·9% of all macrophages consistent with Alexis and Becker [14]. As shown herein these small sputum macrophages are dramatically expanded in COPD. One might speculate that the increase of small sputum macrophages could impact directly on airway obstruction. Statistical comparison of FEV1 and percentage small sputum macrophages, however, showed no correlation (P > 0·05). We assume that these cells contribute to pathophysiology of the disease. Here, analysis of additional parameters of lung destruction is required. Preliminary data from asympthomatic smokers showed that the small macrophages are also elevated in the induced sputum samples, indicating that these cells may be involved in inflammatory processes caused by cigarette smoke.
Because COPD patients in our cohort have an average age of 67·1 ± 7·9 years, it is difficult to generate a sputum control donor group of a similar age. One might argue that the higher average value of small sputum macrophages in COPD is an effect of age and not of disease. In our control group the four donors with an age of >50 years had small macrophages at 6·9% ± 3·4%, indicating that age as such does not lead to an increase of small sputum macrophages.
In both patients and controls we found that the large macrophages exhibit only minimal expression of HLA-DR and CD14, while the small macrophages showed very pronounced levels of these cell surface molecules (Figs 4, 5, 6). This suggests that the small macrophages may be the immunologically active cells and therefore they may be important for airway inflammation.
When looking at TNF production we noted a constitutive expression in both types of macrophages in the control donors and LPS stimulation led to a fivefold increase in the small macrophages. In COPD patients (with exception of the GCi patients) constitutive TNF was found only in the small but not in the large macrophages and there was no apparent increase by additional stimulation. The high amounts of TNF in unstimulated macrophages of the COPD patients may be due to an in vivo activation of the cells as part of the chronic inflammatory process. The lack of increase of TNF production after i_n-vitro_ stimulation of COPD sputum macrophages may be due to this preceding i_n-vivo_ stimulation that leads to tolerance. This tolerance has been observed in patients with various infectious diseases [21–24]. While the constitutive TNF produced by small macrophages is at a similar level in patients and controls the number of small sputum macrophages in COPD can, however, be increased dramatically, i.e. 10-fold for COPD GC–, fivefold for COPD GCi and about sixfold for COPD GC+ 0. The total TNF produced by these cells in COPD is therefore substantially higher and this may drive inflammation in the airways.
The majority of patients in our cohort received glucocorticoid therapy for acute exacerbation. Earlier studies [25,26] indicated that inhaled GC had no effect on numbers of granulocytes and macrophages in patients with inflammatory airway disease. Based on the design of our study it is difficult to draw any conclusions about GC effects, because we have studied patients only at one point in time. Patients treated with inhalative GC had lower total leucocyte counts in sputum and the percentage of small sputum macrophages was also lower, suggesting a suppressive effect of the steroid treatment. Also, patients with oral GC therapy (COPD GC+) had lower total leucocyte counts compared to untreated patients, while the percentage of granulocytes was increased. Finally, HLA-DR expression on small macrophages was somewhat lower in the GC+ patients compared to GC– and GCi. While this is consistent with reports that show lower DR expression after GC therapy in other types of patients [27], the number of patients in our study is low and differences are not significant.
With regard to TNF production, large macrophages showed some TNF production in GCi-treated patients while untreated and GC+ COPD patients showed no or only minimal TNF expression. We do not think that this indicates a GC-induced rebound of TNF production [28], but assume rather that these patients had high production of TNF to begin with and that this was not sufficiently suppressed by the inhalative GC therapy. In order to resolve the issue of GC effects on macrophages in induced sputum of COPD patients sequential measurements before and after GC therapy are required.
In our studies we have focused on the major proinflammatory cytokine TNF. Future studies will need to analyse other pro- and anti-inflammatory cytokines, chemokines, matrix metalloproteinases and reactive oxygen production in order to understand better the role of these cells in airway inflammation. The question is how these small macrophages get into the large airways. Given that the bronchial wall is heavily inflamed in the disease [29], we assume that these cells emigrate from the local tissue to the mucosal surface. Small macrophages have also been identified in bronchoalveolar lavage [30]. Rousseau et al. noted in a study on acute respiratory distress syndrome (ARDS) that the alveolar cells in these patients had a phenotype similar to blood monocytes [31]. Based on studies in the mouse, the same group demonstrated that these cells are newly emigrated blood monocytes [32]. Along these lines we suggest that the small sputum macrophages are newly emigrated cells coming from peripheral blood. In the mouse blockade of monocyte immigration also blocked influx of neutrophils [33], indicating that the newly recruited monocytes are central to the inflammatory process. Also, studies in the rat have demonstrated that depletion of monocytes but not of neutrophils prevent smoke-induced destruction of the lung [34]. While such studies, which selectively deplete monocytes/macrophages, have not been conducted in humans, we assume that these cells are also central players in patients with inflammatory lung disease.
Taken together, we have shown herein that a population of small macrophages with high CD14 and DR expression and with constitutive TNF production is increased dramatically in patients with COPD.
Acknowledgments
We acknowledge the support in patient recruitment by Dr F. Bullemer, Munich and the expert technical assistance of Nathalie Banchereau. Part of this work was supported by grant Zi 288/2 from Deutsche Forschungsgemeinschaft and by a grant from the Children's Research Fund, Liverpool, UK.
REFERENCES
- 1.Mannino DM. COPD: epidemiology, prevalence, morbidity and mortality, and disease heterogeneity. Chest. 2002;121:S121–6. doi: 10.1378/chest.121.5_suppl.121s. [DOI] [PubMed] [Google Scholar]
- 2.Smith KR. Inaugural article: national burden of disease in India from indoor air pollution. Proc Natl Acad Sci USA. 2000;97:13286–93. doi: 10.1073/pnas.97.24.13286. [DOI] [PMC free article] [PubMed] [Google Scholar]
- 3.Barnes PJ. Chronic obstructive pulmonary disease. N Engl J Med. 2000;343:269–80. doi: 10.1056/NEJM200007273430407. [DOI] [PubMed] [Google Scholar]
- 4.Hirano K, Sakamoto T, Uchida Y, et al. Tissue inhibitor of metalloproteinases-2 gene polymorphisms in chronic obstructive pulmonary disease. Eur Respir J. 2001;18:748–52. doi: 10.1183/09031936.01.00102101. [DOI] [PubMed] [Google Scholar]
- 5.Ishii T, Keicho N, Teramoto S, et al. Association of GC-globulin variation with susceptibility to COPD and diffuse panbronchiolitis. Eur Respir J. 2001;18:753–7. doi: 10.1183/09031936.01.00094401. [DOI] [PubMed] [Google Scholar]
- 6.Teramoto S, Ishii T. No association of tumor necrosis factor-alpha gene polymorphism and COPD in Caucasian smokers and Japanese smokers. Chest. 2001;119:315–6. doi: 10.1378/chest.119.1.315. [DOI] [PubMed] [Google Scholar]
- 7.Rennard SI. Inflammation and repair processes in chronic obstructive pulmonary disease. Am J Respir Crit Care Med. 1999;160:S12–6. doi: 10.1164/ajrccm.160.supplement_1.5. [DOI] [PubMed] [Google Scholar]
- 8.Alexis NE, Hu SC, Zeman K, Alter T, Bennett WD. Induced sputum derives from the central airways: confirmation using a radiolabeled aerosol bolus delivery technique. Am J Respir Crit Care Med. 2001;164:1964–70. doi: 10.1164/ajrccm.164.10.2104051. [DOI] [PubMed] [Google Scholar]
- 9.Moodley YP, Dorasamy T, Venketasamy S, Naicker V, Lalloo UG. Correlation of CD4 : CD8 ratio and tumour necrosis factor (TNF) alpha levels in induced sputum with bronchoalveolar lavage fluid in pulmonary sarcoidosis. Thorax. 2000;55:696–9. doi: 10.1136/thorax.55.8.696. [DOI] [PMC free article] [PubMed] [Google Scholar]
- 10.Confalonieri M, Mainardi E, Della Porta R, et al. Inhaled corticosteroids reduce neutrophilic bronchial inflammation in patients with chronic obstructive pulmonary disease. Thorax. 1998;53:583–5. doi: 10.1136/thx.53.7.583. [DOI] [PMC free article] [PubMed] [Google Scholar]
- 11.Rutgers SR, Timens W, Kaufmann HF, van der Mark TW, Koeter GH, Postma DS. Comparison of induced sputum with bronchial wash, bronchoalveolar lavage and bronchial biopsies in COPD. Eur Respir J. 2000;15:109–15. doi: 10.1183/09031936.00.15110900. [DOI] [PubMed] [Google Scholar]
- 12.Peleman RA, Rytila PH, Kips JC, Joos GF, Pauwels RA. The cellular composition of induced sputum in chronic obstructive pulmonary disease. Eur Respir J. 1999;13:839–43. doi: 10.1034/j.1399-3003.1999.13d24.x. [DOI] [PubMed] [Google Scholar]
- 13.Fahy JV, Kim KW, Liu J, Boushey HA. Prominent neutrophilic inflammation in sputum from subjects with asthma exacerbation. J Allergy Clin Immunol. 1995;95:843–52. doi: 10.1016/s0091-6749(95)70128-1. [DOI] [PubMed] [Google Scholar]
- 14.Alexis N, Soukup J, Ghio A, Becker S. Sputum phagocytes from healthy individuals are functional and activated: a flow cytometric comparison with cells in bronchoalveolar lavage and peripheral blood. Clin Immunol. 2000;97:21–32. doi: 10.1006/clim.2000.4911. [DOI] [PubMed] [Google Scholar]
- 15.Pizzichini E, Pizzichini MM, Efthimiadis A, et al. Indices of airway inflammation in induced sputum: reproducibility and validity of cell and fluid-phase measurements. Am J Respir Crit Care Med. 1996;154:308–17. doi: 10.1164/ajrccm.154.2.8756799. [DOI] [PubMed] [Google Scholar]
- 16.Betz R, Kohlhaufl M, Kassner G, et al. Increased sputum IL-8 and IL-5 in asymptomatic nonspecific airway hyperresponsiveness. Lung. 2001;179:119–33. doi: 10.1007/s004080000055. [DOI] [PubMed] [Google Scholar]
- 17.Spanevello A, Beghe B, Bianchi A, et al. Comparison of two methods of processing induced sputum: selected versus entire sputum. Am J Respir Crit Care Med. 1998;157:665–8. doi: 10.1164/ajrccm.157.2.9705095. [DOI] [PubMed] [Google Scholar]
- 18.Loppow D, Bottcher M, Gercken G, Magnussen H, Jorres RA. Flow cytometric analysis of the effect of dithiothreitol on leukocyte surface markers. Eur Respir J. 2000;16:324–9. doi: 10.1034/j.1399-3003.2000.16b22.x. [DOI] [PubMed] [Google Scholar]
- 19.Pavord ID, Pizzichini MM, Pizzichini E, Hargreave FE. The use of induced sputum to investigate airway inflammation. Thorax. 1997;52:498–501. doi: 10.1136/thx.52.6.498. [DOI] [PMC free article] [PubMed] [Google Scholar]
- 20.Spanevello A, Confalonieri M, Sulotto F, et al. Induced sputum cellularity. Reference values and distribution in normal volunteers. Am J Respir Crit Care Med. 2000;162:1172–4. doi: 10.1164/ajrccm.162.3.9908057. [DOI] [PubMed] [Google Scholar]
- 21.Ziegler-Heitbrock L. The p50-homodimer mechanism in tolerance to LPS. J Endotoxin Res. 2001;7:219–22. [PubMed] [Google Scholar]
- 22.Ertel W, Kremer JP, Kenney J, et al. Downregulation of proinflammatory cytokine release in whole blood from septic patients. Blood. 1995;85:1341–7. [PubMed] [Google Scholar]
- 23.McCall CE, Grosso-Wilmoth LM, LaRue K, Guzman RN, Cousart SL. Tolerance to endotoxin-induced expression of the interleukin-1 beta gene in blood neutrophils of humans with the sepsis syndrome. J Clin Invest. 1993;91:853–61. doi: 10.1172/JCI116306. [DOI] [PMC free article] [PubMed] [Google Scholar]
- 24.Horelt A, Belge KU, Steppich B, Prinz J, Ziegler-Heitbrock L. The CD14+CD16+ monocytes in erysipelas are expanded and show reduced cytokine production. Eur J Immunol. 2002;32:1319–27. doi: 10.1002/1521-4141(200205)32:5<1319::AID-IMMU1319>3.0.CO;2-2. [DOI] [PubMed] [Google Scholar]
- 25.Culpitt SV, Maziak W, Loukidis S, Nightingale JA, Matthews JL, Barnes PJ. Effect of high dose inhaled steroid on cells, cytokines, and proteases in induced sputum in chronic obstructive pulmonary disease. Am J Respir Crit Care Med. 1999;160:1635–9. doi: 10.1164/ajrccm.160.5.9811058. [DOI] [PubMed] [Google Scholar]
- 26.Inoue H, Aizawa H, Fukuyama S, et al. Effect of inhaled glucocorticoid on the cellular profile and cytokine levels in induced sputum from asthmatic patients. Lung. 1999;177:53–62. doi: 10.1007/pl00007627. [DOI] [PubMed] [Google Scholar]
- 27.Oehling AG, Akdis CA, Schapowal A, Blaser K, Schmitz M, Simon HU. Suppression of the immune system by oral glucocorticoid therapy in bronchial asthma. Allergy. 1997;52:144–54. doi: 10.1111/j.1398-9995.1997.tb00968.x. [DOI] [PubMed] [Google Scholar]
- 28.Barber AE, Coyle SM, Marano MA, et al. Glucocorticoid therapy alters hormonal and cytokine responses to endotoxin in man. J Immunol. 1993;150:1999–2006. [PubMed] [Google Scholar]
- 29.Turato G, Zuin R, Miniati M, et al. Airway inflammation in severe chronic obstructive pulmonary disease: relationship with lung function and radiologic emphysema. Am J Respir Crit Care Med. 2002;166:105–10. doi: 10.1164/rccm.2111084. [DOI] [PubMed] [Google Scholar]
- 30.Krombach F, Gerlach JT, Padovan C, et al. Characterization and quantification of alveolar monocyte-like cells in human chronic inflammatory lung disease. Eur Respir J. 1996;9:984–91. doi: 10.1183/09031936.96.09050984. [DOI] [PubMed] [Google Scholar]
- 31.Rosseau S, Hammerl P, Maus U, et al. Phenotypic characterization of alveolar monocyte recruitment in acute respiratory distress syndrome. Am J Physiol Lung Cell Mol Physiol. 2000;279:L25–35. doi: 10.1152/ajplung.2000.279.1.L25. [DOI] [PubMed] [Google Scholar]
- 32.Maus U, Herold S, Muth H, et al. Monocytes recruited into the alveolar air space of mice show a monocytic phenotype but upregulate CD14. Am J Physiol Lung Cell Mol Physiol. 2001;280:L58–68. doi: 10.1152/ajplung.2001.280.1.L58. [DOI] [PubMed] [Google Scholar]
- 33.Maus U, von Grote K, Kuziel WA, et al. The role of CC chemokine receptor 2 in alveolar monocyte and neutrophil immigration in intact mice. Am J Respir Crit Care Med. 2002;166:268–73. doi: 10.1164/rccm.2112012. [DOI] [PubMed] [Google Scholar]
- 34.Ofulue AF, Ko M. Effects of depletion of neutrophils or macrophages on development of cigarette smoke-induced emphysema. Am J Physiol. 1999;277:L97–105. doi: 10.1152/ajplung.1999.277.1.L97. [DOI] [PubMed] [Google Scholar]
