Astroglial heterogeneity closely reflects the neuronal-defined anatomy of the adult murine CNS (original) (raw)
. Author manuscript; available in PMC: 2007 Mar 13.
Published in final edited form as: Neuron Glia Biol. 2006 Aug;2(3):175–186. doi: 10.1017/S1740925X06000202
Abstract
Astroglia comprise an extremely morphologically diverse cell type that have crucial roles in neural development and function. Nonetheless, distinct regions of the CNS have traditionally been defined by the phenotypic characteristics and connectivity of neuros. In a complementary fashion, we present evidence that discrete regions of the adult CNS can be delineated based solely on the morphology, density and proliferation rates of astroglia. We used transgenic hGFAP-GFP mice in which robust expression of GFP in adult astroglia enables detailed morphological characterization of this diversely heterogeneous cell population with 3D confocal microscopy. By using three complementary methods for labeling adult astroglia (hGFAP-GFP expression, and GFAP and S100β immunostaining), we find that there is a remarkably diverse, regionally stereotypical array of astroglial morphology throughout the CNS, and that discrete anatomical regions can be defined solely on the morphology of astroglia within that region. Second, we find that the density of astroglia varies dramatically across the CNS, and that astroglial density effectively delineates even the sub-regions of complex structures, such as the thalamus. We also find that regional astroglial density varies depending on how astroglia are labeled. To quantify and illustrate these broad differences in astroglial density, we generated an anatomical density atlas of the CNS. Third, the proliferation rate, or mitotic index, of astroglia in the adult CNS also effectively defines anatomical regions. These differences are present regardless of the astroglial-labeling method used. To supplement our atlas of astroglial density we generated an atlas of proliferation density for the adult CNS. Together, these studies demonstrate that the morphology, density and proliferation rate of astroglia can independently define the discrete cytoarchitecture of the adult mammalian CNS, and support the concept that regional astroglial heterogeneity reflects important molecular and functional differences between distinct classes of astroglia, much like the long-accepted heterogeneity of neuronal populations.
Keywords: Astroglia, CNS atlas, density, GFAP, GFP, morphology, proliferation, S100β
INTRODUCTION
The adult mammalian CNS has been characterized traditionally on the basis of its neuronal architecture. Although neurons are centrally important for information transmission in the CNS, astroglia and oligodendroglia, the two other major CNS lineages, have been found to have major developmental and functional roles in the CNS. Astroglia are an extremely diverse cell type in the adult CNS that were described first in the mid-19th century by Virchow, Golgi, Müller, Deiter and others (summarized in Kettenmann and Ransom, 2005). Not only are astroglia phenotypically diverse, they have crucial roles in the maintenance and function of the adult CNS (Emsley et al., 2004).
Many astroglial morphologies have been described (summarized in Reichenbach and Wolburg, 2005). Astroglial types include: ‘protoplasmic’ astrocytes (Eng, 1985; Bushong et al., 2004); ‘velate’ astrocytes (Valverde and Lopez-Mascaraque, 1991); ‘fibrous’ astrocytes (Butt et al., 1994; Waxman, 1986); perivascular astrocytes (Schnitzer, 1987; Schnitzer, 1988); Bergmann glia (Das, 1976; Yuasa, 1996); ‘radial’ astrocytes (Kosaka and Hama, 1986; Miller and Liuzzi, 1986; Reichenbach and Wolburg, 2005); Müller glia (Reichenbach, 1989); marginal glia (Braak, 1975; Reichenbach and Wolburg, 2005); tanycytes (Bruni et al., 1983; Reichenbach and Wolburg, 2005); and various forms of ependymal glia such as ependymocytes, choroid plexus cells, retinal pigment epithelial cells, and pecten glial cells (Reichenbach and Wolburg, 2005).
Characterizing the extremely diverse cells that collectively are referred to as astroglia continues to be a challenge in neurobiology (Kimelberg, 2004). For example, astroglial heterogeneity has been examined on the basis of development (Valentino et al., 1983; Beyer et al., 1990; Gadisseux et al., 1992; Gressens and Evrard, 1993; Zhang, 2001; Amateau and McCarthy, 2002; Zerlin et al., 2004), proliferation (Gensert and Goldman, 1996; Gensert and Goldman, 2001; Colodner et al., 2005), and factors controlling proliferation (Prochiantz and Mallat, 1988; Koguchi et al., 2002; Fraser et al., 2004) (summarized in Wilkin et al., 1990). Others have described sub-regional differences in astroglial morphology (Braak, 1975; Connor and Berkowitz, 1985; Kosaka and Hama, 1986; Kalman and Hajos, 1989; Yong et al., 1990; Bailey and Shipley, 1993; Hafidi et al., 1994; Miller et al., 1994; Ye and Hernandez, 1995; Bushong et al., 2002; Ogata and Kosaka, 2002; Kimelberg, 2004), GFAP immunoreactivity (Jessen et al., 1984; McDermott and Lantos, 1989; Rasia-Filho et al., 2002; Zhang, 2001; Kimelberg, 2004), ion channels (Sontheimer, 1992; Bordey and Sontheimer, 2000), electrophysiology (D’Ambrosio et al., 1998; Davies et al., 2000; Walz, 2000), receptor expression (Ernsberger et al., 1990; Shao et al., 1994; Ruzicka et al., 1995; Matthias et al., 2003; Wallraff et al., 2004; Jabs et al., 2005), gap junctions (Batter et al., 1992; Venance et al., 1998), and surface and intracellular proteins and RNA (Barbin et al., 1988; Klein and Fricker, 1992; Schwartz and Taniwaki, 1994; Staugaitis et al., 2001; Takemura et al., 2002; Sharif et al., 2004). Astroglia also exhibit significant heterogeneity in their response to either activation or injury in vivo (Topp et al., 1989; Hoke and Silver, 1994; Kondo et al., 1995; Hill et al., 1996; Jeglinski et al., 1997; Morga et al., 1999; Burbach et al., 2004) and in vitro (Levi and Patrizio, 1992; Morga et al., 1998; Won and Oh, 2000).
Building on previous results, our analyses formalize the regional heterogeneity of astroglia as a highly diverse cell class, whose heterogeneity defines neuroanatomy in a level of complexity complementary to the classically, neuronally defined, adult CNS. To describe this heterogeneity, and to compare established methods for labeling astroglia, we used a transgenic mouse line in which enhanced green fluorescent protein (eGFP) expression is driven by the human GFAP (hGFAP) promoter (Nolte et al., 2001), as well as immunochemical localization of GFAP- and S100β-expressing astroglia (Bignami et al., 1972; Uyeda et al., 1972; Ludwin et al., 1976, Matus and Mughal, 1975). Our detailed characterization of astroglial morphology, density and proliferation rates demonstrates that astroglial characteristics and expression independently define the discrete cytoarchitecture of the adult mammalian CNS. Taken together, our results support the interpretation that regional astroglial heterogeneity indicates important molecular and functional differences between distinct classes of astroglia, much like the long-accepted heterogeneity of neuronal populations.
OBJECTIVE
The objective of these studies is to investigate whether regional heterogeneity of astroglia parallels that of neurons, and defines accepted neuroanatomical boundaries in the adult mammalian CNS. We characterize differences in astroglial morphology throughout the adult CNS, and find that these morphological differences vary with neuronally-defined regions. Furthermore, we quantify astroglial density across the adult CNS based on the expression of astroglial-specific markers, showing that cellular density differs dramatically and delineates CNS sub-regions. Similarly, we investigate regional and marker-specific astroglial proliferation rates in the adult CNS, and find that distinct proliferation rates alone also delineate anatomical regions of the CNS.
METHODS
Mouse genotyping and anesthesia
Wild-type female FVB/n mice were acquired from Charles River Laboratories. Transgenic female FVB/n mice with a 2.2 kB hGFAP promoter driving expression of eGFP, bred from homozygous founders, were kindly provided by Dr Helmut Kettenmann (MDC, Berlin) (Nolte et al., 2001). Heterozygous mice were used for all experiments involving transgenic animals; heterozygosity was confirmed by either PCR for the GFP gene (Nolte et al., 2001) or fluorescence illumination of neonatal animals under a fluorescence dissecting microscope (Nikon SMZ1500). Mouse housing and all procedures adhered to institutional and NIH guidelines.
BrdU administration and histology
Cell-proliferation studies were performed with the thymidine analog 5-bromo-2′-deoxyuridine (BrdU; Sigma), administered for 7 days at low concentration in the drinking water (1.5 mg ml−1). Animals were deeply anaesthetized with Avertin, and were transcardially perfused with cold 0.1 M PBS/heparin (10 U ml−1) followed by cold 4% paraformaldheyde (PFA) in 0.1 M PBS. Brains were carefully dissected from the skull and postfixed in 4% PFA for 12 hours at 4°C. Sections (30 μm thick) were cut on a Leica VT 1000S vibrating microtome and stored in 0.1 M PBS/0.025% sodium azide.
All immunocytochemical procedures were performed on at minimum every 12th tissue section. Sections were rinsed in 0.1 M PBS, blocked in 0.3% bovine serum albumin (BSA)/8% goat serum in 0.3% PBS-Triton X-100 (PBS-T). For BrdU staining, tissue sections were treated for 2 hours at room temperature in 2 M HCl before application of the primary antibodies. Native GFP signal was enhanced with either rabbit (1:500, Molecular Probes) or chick (1:500; Chemicon) polyclonal antibodies against GFP. Mouse monoclonal antibodies were used to label GFAP (1:400, Sigma) and S100β (1:100, Sigma). Monoclonal rat anti-BrdU (1:400, Harlan) and the appropriate other primary antibody (against GFP, GFAP and S100β) were applied overnight at 4°C in blocking solution, followed by PBS rinses and incubation with the appropriate secondary fluorescent antibodies (1:500, Molecular Probes, either Alexa 488 or 546) in blocking solution at room temperature for 2–4 hours. In most cases, DAPI was used as a nuclear counterstain.
Data and image analysis
Tissue sections and cells were viewed on a Nikon E1000 microscope equipped with an X-Cite 120 illuminator (EXFO), and either montages (from 10× images) or single images were collected and analyzed with OpenLab image analysis software (Version 3.5). Confocal images were acquired with a BioRad Radiance Rainbow laser scanning confocal microscope equipped for spectral imaging and mounted on a Nikon E800 microscope. Three-dimensional image reconstructions were analyzed using BioRad LaserSharp 2000 software (Version 5.1) and Imaris 4.1.3 (Bitplane) rendering software.
Cells were counted only if a complete nucleus was present within that 30 μm section. For montaged images, digital images were converted to *.tiff files and processed using Graphic Converter 4.7.1 (Lemke Software). From these *.tiff files, we used ImageJ 1.31 software to calculate the crosssectional area (in mm2) of each selected brain tract and region in each 30 μm section. Cell densities for each region were computed by dividing the number of cells counted for a specific region by the cross-sectional area calculated. When cell counts were derived from three or more sections, the mean and s.e. for those counts was computed. Cell density and proliferation data were mapped onto brain-atlas images corresponding to those in Franklin and Paxinos (Franklin and Paxinos, 1997).
RESULTS
Different labeling methods highlight the variability in astroglial morphology
Astroglial markers label both discrete and overlapping populations of astroglia (Kimelberg, 2004). Furthermore, even when there is co-labeling of astroglia by a combination of markers, there are clear differences in the extent to which that cell’s morphology is revealed. We compared three means of visualizing astroglial morphology in the adult murine CNS: immunolabeling against GFAP; immunolabeling against S100β; and enhanced GFP expression driven by the hGFAP promoter in a transgenic mouse line (Nolte et al., 2001). We find that, in a single, high-magnification field of view, astroglia express one, occasionally two, of these three astroglial markers (Fig. 1A). Because it has been shown that GFAP, S100β and transgenic-labeling approaches highlight different cellular morphology, we compared the extent to which each label shows the complete morphology of each astroglial subtype (Fig. 1B–D). Compared with GFAP and hGFAP-GFP, we find that S100β often only labels smaller, less arborized cells. In contrast, GFAP staining does not label the cell body, but effectively labels the complex arborizations of some astroglial subtypes. However, hGFAP-GFP labeling is effective for labeling both the cell body and the many complex arborizations of astroglia. Thus, different labels reveal different subpopulations of cells. However, a broad variety of astroglial types produce GFP, so it is apparent that hGFAP-GFP is the most effective way to delineate cellular morphology.
Fig. 1. Different labeling methods highlight the considerable variability in astroglial morphology.
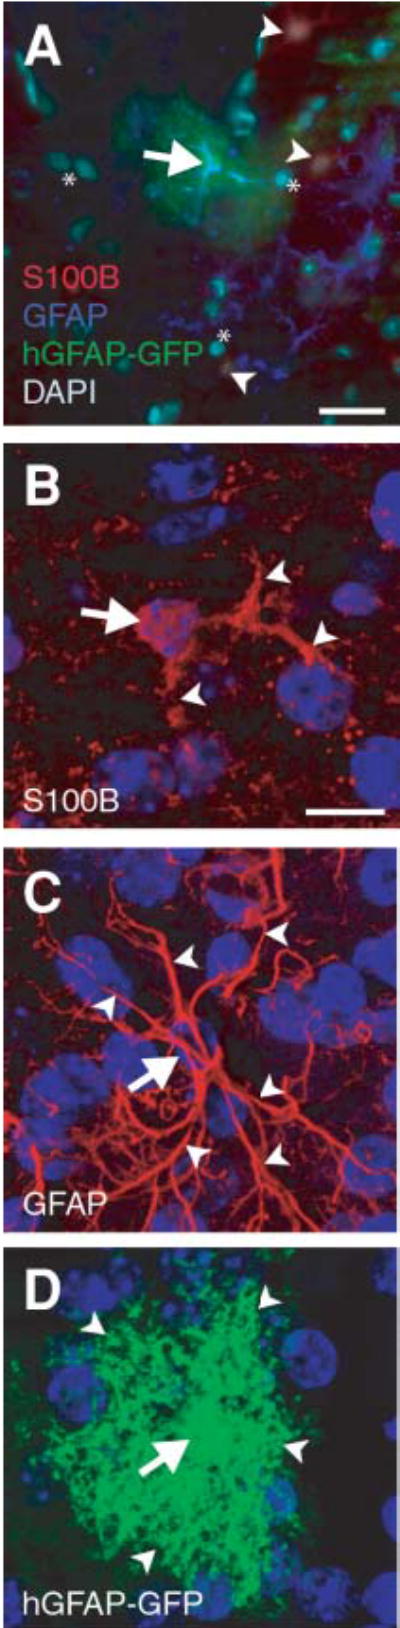
(A) Composite image of astroglia stained with S100β (red), GFAP (blue), and hGFAP-GFP (green). DAPI nuclear counterstain is light teal. A protoplasmic astrocyte (arrow) is co-labeled with hGFAP-GFP and GFAP. S100β-positive astroglia (arrowheads), surrounding the hGFAP-GFP- and the GFAP-positive astroglia, have shorter, less arborized processes than their hGFAP-GFP- and GFAP-positive counterparts. *, cells not stained for any of the three labels. (B–D) Rendered micrographs produced from confocal image stacks of the adult forebrain that show somata (arrows) and arborizations (arrowheads) as detected by the presence of S100β, GFAP and hGFAP-GFP. Note the increased number of fibrous processes that are visible using GFAP immunostaining, and the intense arborization and the full, round soma in transgenically-labeled glia. Blue, DAPI nuclear counterstain. Scale bars: A, 25 μm; B (for B–D), 10 μm.
Distinct, region-specific differences in astroglial morphology
Astroglial morphology varies throughout the adult mammalian CNS. We went on to use hGFAP-GFP tissue to analyze the location of all the astroglial sub-types described (Reichenbach and Wolburg, 2005). When astroglia are labelled by both GFAP and hGFAP-GFP, and, occasionally, S100β and hGFAP-GFP it is always clear that GFP labeling itself allows for a more effective delineation of the morphology of the cell. We have taken advantage of the ability to see morphological details of cell processes and somata to describe the various anatomical types of cells based on their location.
We find that there is distinct regional heterogeneity with respect to the type of astroglial cell that resides in each neuronally defined region of the adult CNS (Fig. 2). We find that distinct regions of the adult CNS, as defined ‘classically’ by neurons, can be characterized and defined by the presence of a few (in many cases as few as one) astroglial sub-types (Table 1 and Fig. 2). The distinct, region-specific heterogeneity of astroglia is, thus, comparable to the regionalization and heterogeneity of defined neuronal subtypes.
Fig. 2. Astroglial morphology varies considerably between defined CNS regions.


Representative astroglia from selected regions of the adult mouse CNS. Each image was serially reconstructed from confocal image stacks at either 20× or 60× magnification with or without optical zoom. Schematic images at defined antero-posterior (AP) axis locations (Franklin and Paxinos, 1997) provide orientation to the confocal micrographs.
Table 1.
Astroglial subtypes present in selected regions of the adult mammalian CNS
| Region ( Figure ) | tanycytes | ‘radial’ | Bergmann glia | ‘protoplasmic’ | ‘fibrous’ | ‘velate’ | marginal glia | perivascular | ependymal glia |
|---|---|---|---|---|---|---|---|---|---|
| Olfactory bulb (2A,B) | ✓ | ✓ | ✓ | ✓ | |||||
| RMS (2C) (not incl. immatureneurons retaining GFP) | ✓ | ✓ | |||||||
| Cortex (2D,E,H) | ✓ | ✓ | ✓ | ||||||
| Pial surface (2F) | ✓ | ✓ | |||||||
| Corpus callosum (2G) | ✓ | ✓ | ✓ | ||||||
| Lateral ventricle/SVZ (2I) | ✓ | ||||||||
| Third ventricle (2J,O) | ✓ | ✓ | ✓ | ||||||
| Fornix (2K) | ✓ | ✓ | ✓ | ||||||
| Cingulum (2L) | ✓ | ✓ | |||||||
| Fimbria (2M) | ✓ | ||||||||
| Amygdala (2N) | ✓ | ✓ | |||||||
| CA region hippocampus (2P) | ✓ | ✓ | |||||||
| Dentate gyrus (2Q) | ✓ | ✓ | |||||||
| Pyramidal hippocampus (2R) | ✓ | ✓ | ✓ | ||||||
| Internal capsule (2S) | ✓ | ||||||||
| Hypothalamus (2T) | ✓ | ||||||||
| Thalamus (2U) | ✓ | ✓ | |||||||
| Cerebellum (2V) | ✓ | ||||||||
| Brainstem (2W) | ✓ | ||||||||
| Dorsal horn, spinal cord (2X) | ✓ |
Assessing 20 CNS sub-regions, we find, for example, predominantly fibrous and perivascular astrocytes in the amygdala (Fig. 2N), protoplasmic astroglia in the hypothalamus (Fig. 2T), and protoplasmic, radial and velate astrocytes in the hippocampus (Fig. 2P–R). From the protoplasmic astrocytes in the condensed gray matter of the olfactory bulb (Fig. 2A) to the cerebellar Bergmann glia (Fig. 2V) and fibrous astrocytes of the dorsal horn of the spinal cord (Fig. 2X), these analyses capture the considerable heterogeneity of astroglial morphologies.
Neuronally-defined anatomical regions are defined distinctly and independently by astroglial density
Just as astroglial morphology varies across neuronally defined CNS regions, so too does astroglial density (Fig. 3A,B). The density of astroglia (defined as the number of cells per mm2 in a 30 μm section) ranges from 2–3 cells mm−2 in the core of the nucleus accumbens to ~2500 cells mm−2 in the subventricular zone (Table 2). This broad range in density is evident regardless of whether astroglia are labeled for S100β, GFAP or GFP driven by the hGFAP promoter. However, the average density of astroglia in the 60 CNS regions assessed depends on how astroglia populations are labeled: hGFAP-GFP transgenic labeling indicates an astroglial density of ~30–35 cells mm−2, compared with 80–90 S100β-positive cells mm−2 and ~100 GFAP-positive cells mm−2 (Table 2). We transposed astroglial density calculations for the three labeling methods (Table 2) onto a series of images derived from a neuronally defined atlas (Franklin and Paxinos, 1997) (Fig. 4A,B). This astroglial density atlas provides a graphical representation of the region-specific, extremely variable density of astroglia across the entire adult CNS.
Fig. 3. Astroglial cell density varies substantially between CNS regions.

Sample montages of sections from the striatal level (A) and hippocampal/thalamic level (B) from which astroglial density data were derived. Fluorescence is native GFP driven by the hGFAP promoter. Scale bar, 1 mm.
Table 2.
The density of astroglia varies substantially across CNS regions
| Approximate density (cells mm−2 in 30 μm sections) | Approximate density (cells mm−2 in 30 μm sections) | ||||||
|---|---|---|---|---|---|---|---|
| Region | hGFAP- GFP | GFAP Protein | S100 β | Region | hGFAP-GFP | GFAP protein | S100 β |
| Glomerular layer | 80–90 | 150–175 | ~100 | Fimbria/fornix | 25–30 | 150–250 | 50–60 |
| End of rms | 500–1000 | 500–1000 | 500–1000 | Fimbria proper | 15–20 | 150–250 | 25–30 |
| External plexiform layer | ~0 | ~0 | ~0 | Internal capsule | 90–100 | 50–60 | 15–25 |
| Mitral/granule cell layers | ~0 | 250–500 | 250–500 | Amygdala | 50–60 | 20–40 | 15–25 |
| N. accumbens (pre core/shell) | 10–20 | 5–10 | 20–30 | Hippocampus | 25±10 | ~500 | 75–100 |
| N. accumbens (core) | 2–3 | 2–5 | 10–15 | Medial habenular nucleus | 100–125 | 300–400 | 50–60 |
| N. accumbens (shell) | 10–20 | 5–10 | 5–10 | Lateral habenular nucleus | 300–350 | 300–400 | 150–200 |
| Claustrum | 10–20 | 10–20 | 15–20 | Paraventricular thalamic nucleus | 100–125 | 100–125 | 50–100 |
| Forceps minor, corpus callosum | 5–10 | 40–50 | 30–40 | Central lateral thalamic nucleus | 100–125 | ~500 | 50–100 |
| Lateral olfactory tract | 50–60 | 20–30 | 5–15 | Lateral postthalamic tract | 60–70 | ~500 | 50–100 |
| Cortex | 10±2 | 10±1 | 80±4 | Lateral geniculate nucleus | 300–350 | ~500 | 50–100 |
| Caudate/putamen | 20–30 | 10–50 | 25–75 | Posterior thalamic nuclear group | 150–200 | ~500 | 50–100 |
| Lateral septal nucleus (pre division) | 15–20 | 1–5 | 5–10 | Ventral posteromedial thalamic nucleus/ventral posterior nuc. | 50–60 | ~500 | 50–100 |
| Lateral septal nuc. (dorsal) | 15–20 | 200–250 | 75–125 | Ventral posterolateral thalamic nuc. | 200–250 | ~500 | 50–100 |
| Lateral septal nuc. (ventral) | 300–350 | 400–500 | 400–500 | Zona incerta | ~0 | ~0 | ~0 |
| Corpus callosum | 40±10 | 79±4 | 27±8 | Subthalamic nuc. | 125–175 | 200–300 | 150–250 |
| Cingulum | 50–60 | 75–250 | ~75 | Cerebral peduncle | 125–150 | 125–150 | 25–75 |
| Ventral pallidum | 10–20 | 10–20 | 75–85 | Fimbria/stria terminalis | ~0 | ~0 | ~0 |
| Fornix | 40–50 | 300–400 | 250–350 | Caudate/putamen/amygdaloid transition area | 30–40 | 5–10 | 5–10 |
| Septofimbrial nucleus | 50–60 | 75–125 | 125–150 | Superior colliculus | 20–30 | 35–45 | 40–50 |
| Anterior commissure | 50–60 | 40–50 | 10–15 | Anterior pretectal nucleus | 15–20 | 10–15 0 | 20–30 |
| Preoptic nucleus (lateral, medial, magnocellular) | 3–5 | 3–5 | 15–20 | Lateral hypothalamic nucleus | 50–60 | 20–30 | 30–40 |
| Subventricular zone | ~2500 | ~2500 | ~2500 | Periaqueductal grey matter | 15–20 | 175–225 | 100–150 |
| Hypothalamus | 80–90 | 80–90 | 50–150 | Medial geniculate nucleus | 80–90 | 55–65 | 125–175 |
| Suprachiasmatic nucleus | 30–40 | ~1000 | 200 | Optic tract | 100–125 | 80–90 | 50–100 |
| Amygdala | 50–60 | 20–40 | 15–25 | Supramammilary nuc. | 40–50 | 600–700 | 30–40 |
| N. basalis of Meynert | 100–125 | 2–10 | 15–20 | Substantia nigra (pars reticulata and pars lateralis) | 125–175 | 70–80 | 75–100 |
| Globus pallidus | 150–200 | 75–100 | 100–125 | Substantia nigra pars compacta | 90–100 | 60–70 | 70–80 |
| Habenula | 100–125 | 300–400 | 100–125 | Deep mesencephalic nucleus | ~0 | ~0 | ~0 |
| Dorsomedial hypothalamic nucleus | 40–50 | 100–125 | 40–50 | Cerebellar folia | 600–650 | ~600 | ~600 |
Fig. 4. An atlas of cell density using the three labeling methods.


Schematic, rostral-to-caudal, density-atlas sections demonstrate that astroglial density varies considerably in the adult CNS. Antero-posterior (AP) coordinates, in mm from Bregma, are indicated above the schematics. The colorimetric density gradient (top) represents increasing density (defined as the number of astroglia per mm2 in 30 μm sections). Schematic representations of neuronally defined regions are based on Franklin and Paxinos (1997). Abbreviations: am, amygdala; cc, corpus callosum; cl, claustrum; ctx, cortex; dr; dorsal root, spinal cord; fi, fimbria; fmi, forceps minor, corpus callosum; fo, fornix; gc, granule cell layer, cerebellum; gl, glomerular cell layer, olfactory bulb; gm; grey matter, spinal cord; gp, globus pallidus; gr, granule cell layer, olfactory bulb; hpc, hippocampus; hyp, hypothalamus; ic, internal capsule; ls, lateral septal nucleus; mg, medial geniculate nucleus, thalamus; ml, molecular layer, cerebellum; mm, mammilary nucleus; na, nucleus accumbens; po, preoptic nucleus, hypothalamus; sc, superior colliculus; sn, substantia nigra; str, striatum; vp, ventral pallidum; wm, white matter, spinal cord; zi, zona incerta.
Astroglial density can vary substantially even within sub-regions of individual, neuronally-defined areas. For example, the astroglial density of the ‘shell’ region of the nucleus accumbens (highlighted by hGFAP-GFP labeling) is ~10– 20 cells mm−2, whereas that of the ‘core’ of the nucleus accumbens is ~2–3 cells mm−2. Astroglial density also varies considerably in sub-regions of the thalamus, which is composed of many neuroanatomically and functionally distinct sub-nuclei. For example, based on hGFAP-GFP labeling, astroglial density is ~100–125 cells mm−2 in the paraventricular thalamic nucleus, 200–250 cells mm−2 in the ventral posterolateral thalamic nucleus, and 300–350 cells mm−2 in the lateral geniculate nucleus (Table 2 and Fig. 4B).
Both GFAP and S100β immunostaining also reveals region-and sub-region-specific differences in astroglial density. However, in some CNS regions, the density of astroglia varies considerably, depending on the labeling method (Table 2 and Fig. 4A,B). For example, hGFAP-GFP- and GFAP-labeling identifies ~3–5 cells mm−2 in the preoptic nucleus of the hypothalamus, whereas there are 15–20 S100β-positive cells mm−2. Similarly, in the nucleus basalis of Meynert, we find 2–10 GFAP-positive cells mm−2 versus 15–20 S100β- and 100–125 hGFAP-GFP-positive cells mm−2. However, there are regions in which the astroglial density is relatively similar, regardless of the labeling method used. These regions include the claustrum (~15 cells mm−2), the ventral portion of the lateral septal nucleus (~400 cells mm−2), and the substantia nigra pars compacta (~80 cells mm−2). Strikingly, hGFAP-GFP labeling effectively highlights Bergmann glia in the cerebellum but does not show cells within the granule cell layer (Fig. 4B); this pattern is similar to that of native expression of S100β, but differs considerably from GFAP staining, which highlights cerebellar granule cells (Fig. 4B).
Astroglial densities also vary broadly in different white matter tracts. For example, the density of (primarily fibrous) astroglia ranges from virtually zero in the stria terminalis to 100–125 cells mm−2 in the optic tract. In contrast, the corpus callosum, the largest fiber tract of the CNS, contains 27±8 S100β-positive cells mm−2, 40±10 hGFAP-GFP-positive cells mm−2 and 79±4 GFAP-positive cells mm−2.
There are substantial regional differences in astroglial proliferation rates
The proliferation rates of astroglia vary widely across the adult mammalian CNS. Most strikingly, discrete differences in proliferation reflect the neuronally defined anatomy of the adult CNS. We used the cell cycle marker BrdU (a thymidine analog) to determine the number of newly generated astroglia in neuronally-defined CNS regions over a 7-day period (Table 3 and Fig. 5) (Franklin and Paxinos, 1997). Regardless of the labeling method used, the average ‘mitotic index’ (defined as the number of BrdU-positive astroglia expressed as a percentage of all astroglia labeled by each particular method) is ~10% for the entire CNS.
Table 3.
The proliferation rate of astroglia varies substantially across CNS regions
| Approximate ‘mitotic index’ (BrdU-positive astroglia as a percentage of astroglia labeled by the indicated method) | |||
|---|---|---|---|
| Region | hGFAP-GFP | GFAP protein | S100β |
| Cortex | 12±2% | 9±1% | 17±2% |
| Striatum | 14±4% | 7±1% | 7±1% |
| Rostral migratory stream | 25±5% | 36±10% | ~0% |
| Subventricular zone | 13±4% | 41±9% | ~0% |
| Corpus callosum | 17±3% | 9±1% | 15±5% |
| Dentate gyrus | 10±2% | 44±4% | 10±2% |
| Hippocampus (non-DG) | 16±2% | ~0% | 11±2% |
| Fimbria/fornix | 5±2% | ~20% | ~45% |
| Thalamus | 3±1% | 14±4% | 4±1% |
| Hypothalamus | 6±2% | 6±1% | ~5% |
| Cerebellum | 1–2% | 2–3% | 0–2% |
| Entire CNS | ~10% | ~11% | ~10% |
Fig. 5. Astroglial proliferation rates vary substantially across the adult CNS.

The proliferation of astroglia in several regions was assessed by a 1-week administration of the thymidine analog BrdU. (A) A pair of recently born velate astroglia (arrows). BrdU-positive/hGFAP-GFP-negative cells in (A) are marked with asterisks. (B) An example of a recently generated eGFP-positive cell (arrow) in the neocortex. An adjacent protoplasmic astrocyte was not generated during the BrdU administration period (arrowhead). (C) The proliferation rate of astroglia varies substantially across the adult CNS, and also depends on the labeling method. Schematic, rostro-caudal atlas sections (Franklin and Paxinos, 1997) with proliferation rates displayed demonstrate that astroglial-turnover rates range from almost zero (in the cerebellum) to ~15–20% (e.g. in the corpus callosum and hippocampus). The colorimetric gradient on the left represents increasing proliferation rate (expressed as the percentage of GFP-, GFAP- and S100β-positive/BrdU-positive cells mm−2 in 30 μm sections) of all GFP-, GFAP- and S100β-positive cells). Scale bars: A, 25 μm; B, 50 μm.
We computed the mitotic index for major CNS regions and, analogous to the data on astroglial density, mapped astroglial proliferation data onto a standard CNS atlas (Fig. 5A,B) (Franklin and Paxinos, 1997). The mitotic index ranges from 1–2% in the cerebellum to ~40% in the hippocampal dentate gyrus immunolabeled for GFAP (Table 3). In addition, although the overall mitotic index is similar regardless of the labeling method, there are clear differences in proliferation rates in hGFAP-GFP labeled, and GFAP- positive and S100βpositive astroglia. For example, in the fimbria/fornix region, only 5±2% of hGFAP-GFP cells are generated during the 1-week BrdU administration period, versus ~20% and ~45% in GFAP- and S100β-positive cells, respectively. Similarly, the proliferation rate of S100β-positive cells in the SVZ is ~ 0%, versus 25±5% hGFAP-GFP- and 36±10 and GFAP-positive cells. However, the SVZ/RMS have been shown to contain GFAP-positive cells that have the potential to act as neuronal precursors, so both the density and proliferation estimates for these neurogenic regions contains this subset of GFAP-positive progenitors.
CONCLUSIONS
- There are distinct and region-specific differences in astroglial morphology. These morphologic differences are as diverse as those for neuronal populations across the adult mammalian CNS, and can be used to define anatomical regions.
- The extent to which the varied morphology of astroglial sub-types is seen depends on how astroglia are labeled.
- Astroglial density varies considerably, and can distinctly and independently define neuronally-defined anatomical regions and sub-regions.
- The method by which astroglia are labeled influences the densities recorded in several anatomical sub-regions.
- The proliferation rate of astroglia varies widely across different CNS regions, and reflects neuronally-defined regions of the adult mammalian CNS.
- The reported rate at which new astroglia are born in several CNS sub-regions is influenced by the method used to label astroglia.
- Together, these studies demonstrate that astroglial morphology, density and proliferation independently define the discrete cytoarchitecture of the adult mammalian CNS.
DISCUSSION
These experiments demonstrate that astroglia display considerable, region-specific differences in morphology, density and proliferation across the rostro-caudal extent of the adult mouse CNS. Each of these indices reflects the classical, neuronally-defined anatomy of the adult mammalian CNS. To illustrate this heterogeneity, we developed astroglial density and proliferation ‘atlases’ of the adult mouse CNS, which complement those for the neuronally-defined CNS. Our analysis used transgenic mice with an enhanced GFP reporter under the control of the hGFAP promoter (Nolte et al., 2001), and immunolabeling against GFAP and S100β, to perform an extensive characterization of adult CNS astroglia, based on their morphology, density and proliferation rates.
Although it is clear that no single reporter system or immunolabel highlights every astroglial cell in the CNS, we found that hGFAP-GFP mice are particularly advantageous for morphological investigations of astroglial heterogeneity. An additional advantage over other reporter systems is that the complete and distinct morphology of astroglia is apparent during neural development and is maintained through adulthood. Compared with other promoter-driven systems and immunolabels for GFAP, A2B5 and S100β, the high-level, largely astroglial-specific and consistent expression of GFP in this system provides a reliable and efficient way to characterize the substantial diversity of astroglial morphology, density and proliferation.
Others have described considerable heterogeneity of astroglia with respect to development, proliferation, morphology, location, protein expression and function (Prochiantz and Mallat, 1988; D’Ambrosio et al., 1998; Wilkin et al., 1990; Zhang, 2001; Bushong et al., 2002; Ogata and Kosaka, 2002; Matthias et al., 2003; Scotti Campos, 2003; Kimelberg, 2004; Wallraff et al., 2004). The existence of striking regional and sub-regional variations in astroglial characteristics indicates that this immense diversity influences neural function in important, region-specific ways. Furthermore, these variations raise speculations regarding pathophysiology, such as are particular astroglial subtypes in distinct CNS regions more likely to develop into glial tumors? Recent reports (Bruijn et al., 2004; Pehar et al., 2004; Cassina et al., 2005) suggest that future work should also assess whether regional differences in populations of astroglia influences the degree of susceptibility of CNS sub-regions to neuronal degeneration.
What induces and maintains the regional differences among astroglia is unknown. Given the complex, crucial interactions between neurons and glia in the developing and adult CNS, it is likely that these interactions themselves influence astroglial morphology, density and proliferation. The existence of such broad variations in morphology, expression, density and proliferation highlights the possibility that the developing neuronal populations influence the characteristics of astroglia. Although outside the scope of this current study, one can speculate that the developing neuronal environment influences the lineage progression of astroglial sub-types in order to guarantee that the most effective glial support network is available for the function and long-term survival of that particular neuronal population. In addition to possible neuronal influences on glia, the local microenvironment can direct and maintain the morphology and heterogeneity of astroglia (Reichenbach and Wolburg, 2005). For example, both the tumor suppressor PTEN and the cyclin-dependent protein kinase inhibitor p27 have crucial roles in controlling astroglial proliferation (Koguchi et al., 2002; Fraser et al., 2004). Thus, it is possible that the regulatory effects exerted by these and other factors are regionally varied and contribute to regional differences in astroglial proliferation and turnover.
Together, our data on the expression, morphology, density and proliferation rates of astroglia reinforce the existence of remarkable regional heterogeneity of astroglia in the adult mammalian CNS. Our multiple modes of analysis provide further evidence of the complex and varied roles of astroglia in the developing and adult CNS, and will lead to a better understanding of neuron-glia interactions and the key influences on astroglial morphology and function.
Acknowledgments
We are grateful to Karen Billmers, Alex Eswar and Kyle MacQuarrie for their excellent technical assistance; to Drs Joao Menezes, Bradley Molyneaux and Hande Özdinler, and other members of the Macklis lab for helpful discussions; and to two anonymous reviewers for helpful suggestions. The transgenic hGFAP-GFP mouse line was a generous gift of Drs. Helmut Kettenmann and Christiane Nolte (Max Delbrück Center for Molecular Medicine, Berlin). This study was supported by grants from the NIH-NINDS (JDM; NS 45523, NS 49553, NS 41590), CNS Foundation (JDM); a fellowship from the Paralyzed Veterans of America/Travis Roy Foundation (JGE), and a fellowship from the Heart and Stroke Foundation of Canada (JGE).
References
- Amateau SK, McCarthy MM. Sexual differentiation of astrocyte morphology in the developing rat preoptic area. Journal of Neuroendocrinology. 2002;14:904–910. doi: 10.1046/j.1365-2826.2002.00858.x. [DOI] [PubMed] [Google Scholar]
- Bailey MS, Shipley MT. Astrocyte subtypes in the rat olfactory bulb: morphological heterogeneity and differential laminar distribution. Journal of Comparative Neurology. 1993;328:501–526. doi: 10.1002/cne.903280405. [DOI] [PubMed] [Google Scholar]
- Barbin G, Katz DM, Chamak B, Glowinski J, Prochiantz A. Brain astrocytes express region-specific surface glycoproteins in culture. Glia. 1988;1:96–103. doi: 10.1002/glia.440010111. [DOI] [PubMed] [Google Scholar]
- Batter DK, Corpina RA, Roy C, Spray DC, Hertzberg EL, Kessler JA. Heterogeneity in gap junction expression in astrocytes cultured from different brain regions. Glia. 1992;6:213–221. doi: 10.1002/glia.440060309. [DOI] [PubMed] [Google Scholar]
- Beyer C, Epp B, Fassberg J, Reisert I, Pilgrim C. Region- and sex-related differences in maturation of astrocytes in dissociated cell cultures of embryonic rat brain. Glia. 1990;3:55–64. doi: 10.1002/glia.440030108. [DOI] [PubMed] [Google Scholar]
- Bignami A, Eng LF, Dahl D, Uyeda CT. Localization of the glial fibrillary acidic protein in astrocytes by immunofluorescence. Brain Research. 1972;43:429–435. doi: 10.1016/0006-8993(72)90398-8. [DOI] [PubMed] [Google Scholar]
- Bordey A, Sontheimer H. Ion channel expression by astrocytes in situ: comparison of different CNS regions. Glia. 2000;30:27–38. doi: 10.1002/(sici)1098-1136(200003)30:1<27::aid-glia4>3.0.co;2-#. [DOI] [PubMed] [Google Scholar]
- Braak E. On the fine structure of the external glial layer in the isocortex of man. Cell Tissue Research. 1975;157:367–390. doi: 10.1007/BF00225527. [DOI] [PubMed] [Google Scholar]
- Bruijn LI, Miller TM, Cleveland DW. Unraveling the mechanisms involved in motor neuron degeneration in ALS. Annual Reviews of Neuroscience. 2004;27:723–749. doi: 10.1146/annurev.neuro.27.070203.144244. [DOI] [PubMed] [Google Scholar]
- Bruni JE, Clattenburg RE, Millar E. Tanycyte ependymal cells in the third ventricle of young and adult rats: a Golgi study. Anatomische Anzeige. 1983;153:53–68. [PubMed] [Google Scholar]
- Burbach GJ, Dehn D, Del Turco D, Staufenbiel M, Deller T. Laser microdissection reveals regional and cellular differences in GFAP mRNA upregulation following brain injury, axonal denervation, and amyloid plaque deposition. Glia. 2004;48:76–84. doi: 10.1002/glia.20057. [DOI] [PubMed] [Google Scholar]
- Bushong EA, Martone ME, Jones YZ, Ellisman MH. Protoplasmic astrocytes in CA1 stratum radiatum occupy separate anatomical domains. Journal of Neuroscience. 2002;22:183–192. doi: 10.1523/JNEUROSCI.22-01-00183.2002. [DOI] [PMC free article] [PubMed] [Google Scholar]
- Bushong EA, Martone ME, Ellisman MH. Maturation of astrocyte morphology and the establishment of astrocyte domains during postnatal hippocampal development. International Journal of Developmental Neuroscience. 2004;22:73–86. doi: 10.1016/j.ijdevneu.2003.12.008. [DOI] [PubMed] [Google Scholar]
- Butt AM, Colquhoun K, Tutton M, Berry M. Threedimensional morphology of astrocytes and oligodendrocytes in the intact mouse optic nerve. Journal of Neurocytology. 1994;23:469–485. doi: 10.1007/BF01184071. [DOI] [PubMed] [Google Scholar]
- Cassina P, Pehar M, Vargas MR, Castellanos R, Barbeito AG, Estevez AG, Thompson JA, Beckman JS, Barbeito L. Astrocyte activation by fibroblast growth factor-1 and motor neuron apoptosis: implications for amyotrophic lateral sclerosis. Journal of Neurochemistry. 2005;93:38–46. doi: 10.1111/j.1471-4159.2004.02984.x. [DOI] [PubMed] [Google Scholar]
- Colodner KJ, Montana RA, Anthony DC, Folkerth RD, De Girolami U, Feany MB. Proliferative potential of human astrocytes. Journal of Neuropathology and Experimental Neurology. 2005;64:163–169. doi: 10.1093/jnen/64.2.163. [DOI] [PubMed] [Google Scholar]
- Connor JR, Berkowitz EM. A demonstration of glial filament distribution in astrocytes isolated from rat cerebral cortex. Neuroscience. 1985;16:33–44. doi: 10.1016/0306-4522(85)90044-2. [DOI] [PubMed] [Google Scholar]
- D’Ambrosio R, Wenzel J, Schwartzkroin PA, McKhann GM, 2nd, Janigro D. Functional specialization and topographic segregation of hippocampal astrocytes. Journal of Neuroscience. 1998;18:4425–4438. doi: 10.1523/JNEUROSCI.18-12-04425.1998. [DOI] [PMC free article] [PubMed] [Google Scholar]
- Das GD. Differentiation of Bergmann glia cells in the cerebellum: a golgi study. Brain Research. 1976;110:199–213. doi: 10.1016/0006-8993(76)90397-8. [DOI] [PubMed] [Google Scholar]
- Davies DL, Niesman IR, Boop FA, Phelan KD. Heterogeneity of astroglia cultured from adult human temporal lobe. International Journal of Developmental Neuroscience. 2000;18:151–160. doi: 10.1016/s0736-5748(99)00083-0. [DOI] [PubMed] [Google Scholar]
- Emsley JG, Arlotta P, Macklis JD. Star-cross’d neurons: astroglial effects on neural repair in the adult mammalian CNS. Trends in Neurosciences. 2004;27:238–240. doi: 10.1016/j.tins.2004.02.008. [DOI] [PubMed] [Google Scholar]
- Eng LF. Glial fibrillary acidic protein (GFAP): the major protein of glial intermediate filaments in differentiated astrocytes. Journal of Neuroimmunology. 1985;8:203–214. doi: 10.1016/s0165-5728(85)80063-1. [DOI] [PubMed] [Google Scholar]
- Ernsberger P, Iacovitti L, Reis DJ. Astrocytes cultured from specific brain regions differ in their expression of adrenergic binding sites. Brain Research. 1990;517:202–208. doi: 10.1016/0006-8993(90)91027-e. [DOI] [PubMed] [Google Scholar]
- Franklin KBJ, Paxinos G. The Mouse Brain in Stereotaxic Coordinates. Academic Press; 1997. [Google Scholar]
- Fraser MM, Zhu X, Kwon CH, Uhlmann EJ, Gutmann DH, Baker SJ. Pten loss causes hypertrophy and increased proliferation of astrocytes in vivo. Cancer Research. 2004;64:7773–7779. doi: 10.1158/0008-5472.CAN-04-2487. [DOI] [PubMed] [Google Scholar]
- Gadisseux JF, Evrard P, Mission JP, Caviness VS., Jr Dynamic changes in the density of radial glial fibers of the developing murine cerebral wall: a quantitative immunohistological analysis. Journal of Comparative Neurology. 1992;322:246–254. doi: 10.1002/cne.903220210. [DOI] [PubMed] [Google Scholar]
- Gensert JM, Goldman JE. In vivo characterization of endogenous proliferating cells in adult rat subcortical white matter. Glia. 1996;17:39–51. doi: 10.1002/(SICI)1098-1136(199605)17:1<39::AID-GLIA4>3.0.CO;2-2. [DOI] [PubMed] [Google Scholar]
- Gensert JM, Goldman JE. Heterogeneity of cycling glial progenitors in the adult mammalian cortex and white matter. Journal of Neurobiology. 2001;48:75–86. [PubMed] [Google Scholar]
- Gressens P, Evrard P. The glial fascicle: an ontogenic and phylogenic unit guiding, supplying and distributing mammalian cortical neurons. Brain Research Developmental Brain Research. 1993;76:272–277. doi: 10.1016/0165-3806(93)90218-y. [DOI] [PubMed] [Google Scholar]
- Hafidi A, Sanes DH, Hillman DE, Kedeshian P. Structural and molecular heterogeneity of astrocytes and oligodendrocytes in the gerbil lateral superior olive. Neuroscience. 1994;60:503–519. doi: 10.1016/0306-4522(94)90261-5. [DOI] [PubMed] [Google Scholar]
- Hill SJ, Barbarese E, McIntosh TK. Regional heterogeneity in the response of astrocytes following traumatic brain injury in the adult rat. Journal of Neuropathology and Experimental Neurology. 1996;55:1221–1229. doi: 10.1097/00005072-199612000-00005. [DOI] [PubMed] [Google Scholar]
- Hoke A, Silver J. Heterogeneity among astrocytes in reactive gliosis. Perspectives in Developmental Neurobiology. 1994;2:269–274. [PubMed] [Google Scholar]
- Jabs R, Pivneva T, Huttmann K, Wyczynski A, Nolte C, Kettenmann H, Steinhauser C. Synaptic transmission onto hippocampal glial cells with hGFAP promoter activity. Journal of Cell Science. 2005;118:3791–3803. doi: 10.1242/jcs.02515. [DOI] [PubMed] [Google Scholar]
- Jeglinski W, Pepeu G, Oderfeld-Nowak B. Differential susceptibility of senile and lesion-induced astrogliosis to phosphatidylserine. Neurobiology of Aging. 1997;18:81–86. doi: 10.1016/s0197-4580(96)00209-6. [DOI] [PubMed] [Google Scholar]
- Jessen KR, Thorpe R, Mirsky R. Molecular identity, distribution and heterogeneity of glial fibrillary acidic protein: an immunoblotting and immunohistochemical study of Schwann cells, satellite cells, enteric glia and astrocytes. Journal of Neurocytology. 1984;13:187–200. doi: 10.1007/BF01148114. [DOI] [PubMed] [Google Scholar]
- Kalman M, Hajos F. Distribution of glial fibrillary acidic protein (GFAP)-immunoreactive astrocytes in the rat brain. I. Forebrain. Exp Brain Research. 1989;78:147–163. doi: 10.1007/BF00230694. [DOI] [PubMed] [Google Scholar]
- Kettenmann H, Ransom BR. The concept of neuroglia: a historical perspective. In: Kettenmann H, Ransom BR, editors. Neuroglia. Oxford University Press; 2005. pp. 1–16. [Google Scholar]
- Kimelberg HK. The problem of astrocyte identity. Neurochemistry International. 2004;45:191–202. doi: 10.1016/j.neuint.2003.08.015. [DOI] [PubMed] [Google Scholar]
- Klein RS, Fricker LD. Heterogeneous expression of carboxypeptidase E and proenkephalin mRNAs by cultured astrocytes. Brain Research. 1992;569:300–310. doi: 10.1016/0006-8993(92)90643-n. [DOI] [PubMed] [Google Scholar]
- Koguchi K, Nakatsuji Y, Nakayama K, Sakoda S. Modulation of astrocyte proliferation by cyclin-dependent kinase inhibitor p27(Kip1) Glia. 2002;37:93–104. doi: 10.1002/glia.10017. [DOI] [PubMed] [Google Scholar]
- Kondo Y, Ogawa N, Asanuma M, Ota Z, Mori A. Regional differences in late-onset iron deposition, ferritin, transferrin, astrocyte proliferation, and microglial activation after transient forebrain ischemia in rat brain. Journal of Cerebral Blood Flow and Metabolism. 1995;15:216–226. doi: 10.1038/jcbfm.1995.27. [DOI] [PubMed] [Google Scholar]
- Kosaka T, Hama K. Three-dimensional structure of astrocytes in the rat dentate gyrus. Journal of Comparative Neurology. 1986;249:242–260. doi: 10.1002/cne.902490209. [DOI] [PubMed] [Google Scholar]
- Levi G, Patrizio M. Astrocyte heterogeneity: endogenous amino acid levels and release evoked by non-N-methyl-D-aspartate receptor agonists and by potassium-induced swelling in type-1 and type-2 astrocytes. Journal of Neurochemistry. 1992;58:1943–1952. doi: 10.1111/j.1471-4159.1992.tb10073.x. [DOI] [PubMed] [Google Scholar]
- Ludwin SK, Kosek JC, Eng LF. The topographical distribution of S-100 and GFA proteins in the adult rat brain: an immunohistochemical study using horseradish peroxidase-labelled antibodies. Journal of Comparative Neurology. 1976;165:197–207. doi: 10.1002/cne.901650206. [DOI] [PubMed] [Google Scholar]
- Matthias K, Kirchhoff F, Seifert G, Huttmann K, Matyash M, Kettenmann H, Steinhauser C. Segregated expression of AMPA-type glutamate receptors and glutamate transporters defines distinct astrocyte populations in the mouse hippocampus. Journal of Neuroscience. 2003;23:1750–1758. doi: 10.1523/JNEUROSCI.23-05-01750.2003. [DOI] [PMC free article] [PubMed] [Google Scholar]
- Matus A, Mughal S. Immunohistochemical localisation of S-100 protein in brain. Nature. 1975;258:746–748. doi: 10.1038/258746a0. [DOI] [PubMed] [Google Scholar]
- McDermott KW, Lantos PL. The distribution of glial fibrillary acidic protein and vimentin in postnatal marmoset (Callithrix jacchus) brain. Brain Research Developmental Brain Research. 1989;45:169–177. doi: 10.1016/0165-3806(89)90036-9. [DOI] [PubMed] [Google Scholar]
- Miller RH, Liuzzi FJ. Regional specialization of the radial glial cells of the adult frog spinal cord. Journal of Neurocytology. 1986;15:187–196. doi: 10.1007/BF01611655. [DOI] [PubMed] [Google Scholar]
- Miller RH, Zhang H, Fok-Seang J. Glial cell heterogeneity in the mammalian spinal cord. Perspectives in Developmental Neurobiology. 1994;2:225–231. [PubMed] [Google Scholar]
- Morga E, Faber C, Heuschling P. Cultured astrocytes express regional heterogeneity of the immunoreactive phenotype under basal conditions and after gamma-IFN induction. Journal of Neuroimmunology. 1998;87:179–184. doi: 10.1016/s0165-5728(98)00099-x. [DOI] [PubMed] [Google Scholar]
- Morga E, Faber C, Heuschling P. Regional heterogeneity of the astroglial immunoreactive phenotype: effect of lipopolysaccharide. Journal of Neuroscience Research. 1999;57:941–952. [PubMed] [Google Scholar]
- Nolte C, Matyash M, Pivneva T, Schipke CG, Ohlemeyer C, Hanisch UK, Kirchhoff F, Kettenmann H. GFAP promotercontrolled EGFP-expressing transgenic mice: a tool to visualize astrocytes and astrogliosis in living brain tissue. Glia. 2001;33:72–86. [PubMed] [Google Scholar]
- Ogata K, Kosaka T. Structural and quantitative analysis of astrocytes in the mouse hippocampus. Neuroscience. 2002;113:221–233. doi: 10.1016/s0306-4522(02)00041-6. [DOI] [PubMed] [Google Scholar]
- Pehar M, Cassina P, Vargas MR, Castellanos R, Viera L, Beckman JS, Estevez AG, Barbeito L. Astrocytic production of nerve growth factor in motor neuron apoptosis: implications for amyotrophic lateral sclerosis. Journal of Neurochemistry. 2004;89:464–473. doi: 10.1111/j.1471-4159.2004.02357.x. [DOI] [PubMed] [Google Scholar]
- Prochiantz A, Mallat M. Astrocyte diversity. Annals of the New York Academy of Science. 1988;540:52–63. doi: 10.1111/j.1749-6632.1988.tb27051.x. [DOI] [PubMed] [Google Scholar]
- Rasia-Filho AA, Xavier LL, dos Santos P, Gehlen G, Achaval M. Glial fibrillary acidic protein immunodetection and immunoreactivity in the anterior and posterior medial amygdala of male and female rats. Brain Research Bulletin. 2002;58:67–75. doi: 10.1016/s0361-9230(02)00758-x. [DOI] [PubMed] [Google Scholar]
- Reichenbach A. Attempt to classify glial cells by means of their process specialization using the rabbit retinal Muller cell as an example of cytotopographic specialization of glial cells. Glia. 1989;2:250–259. doi: 10.1002/glia.440020406. [DOI] [PubMed] [Google Scholar]
- Reichenbach A, Wolburg H. Astrocytes and ependymal glia. In: Kettenmann H, Ransom BR, editors. Neuroglia. Oxford University Press; 2005. pp. 19–35. [Google Scholar]
- Ruzicka BB, Fox CA, Thompson RC, Meng F, Watson SJ, Akil H. Primary astroglial cultures derived from several rat brain regions differentially express mu, delta and kappa opioid receptor mRNA. Brain Research Molecular Brain Research. 1995;34:209–220. doi: 10.1016/0169-328x(95)00165-o. [DOI] [PubMed] [Google Scholar]
- Schnitzer J. Retinal astrocytes: their restriction to vascularized parts of the mammalian retina. Neuroscience Letters. 1987;78:29–34. doi: 10.1016/0304-3940(87)90556-8. [DOI] [PubMed] [Google Scholar]
- Schnitzer J. Astrocytes in the guinea pig, horse, and monkey retina: their occurrence coincides with the presence of blood vessels. Glia. 1988;1:74–89. doi: 10.1002/glia.440010109. [DOI] [PubMed] [Google Scholar]
- Schwartz JP, Taniwaki T. Heterogeneity of expression of neuropeptide genes by astrocytes: functional implications. Perspectives in Developmental Neurobiology. 1994;2:251–257. [PubMed] [Google Scholar]
- Scotti Campos L. Evidence for astrocyte heterogeneity: a distinct subpopulation of protoplasmic-like glial cells is detected in transgenic mice expressing Lmo1-lacZ. Glia. 2003;43:195–207. doi: 10.1002/glia.10254. [DOI] [PubMed] [Google Scholar]
- Shao Y, Porter JT, McCarthy KD. Neuroligand receptor heterogeneity among astroglia. Perspectives in Developmental Neurobiology. 1994;2:205–215. [PubMed] [Google Scholar]
- Sharif A, Renault F, Beuvon F, Castellanos R, Canton B, Barbeito L, Junier MP, Chneiweiss H. The expression of PEA-15 (phosphoprotein enriched in astrocytes of 15 kDa) defines subpopulations of astrocytes and neurons throughout the adult mouse brain. Neuroscience. 2004;126:263–275. doi: 10.1016/j.neuroscience.2004.02.039. [DOI] [PubMed] [Google Scholar]
- Sontheimer H. Astrocytes, as well as neurons, express a diversity of ion channels. Canadian Journal of Physiology and Pharmacology. 1992;70:S223–238. doi: 10.1139/y92-266. [DOI] [PubMed] [Google Scholar]
- Staugaitis SM, Zerlin M, Hawkes R, Levine JM, Goldman JE. Aldolase C/zebrin II expression in the neonatal rat forebrain reveals cellular heterogeneity within the subventricular zone and early astrocyte differentiation. Journal of Neuroscience. 2001;21:6195–6205. doi: 10.1523/JNEUROSCI.21-16-06195.2001. [DOI] [PMC free article] [PubMed] [Google Scholar]
- Takemura M, Nishiyama H, Itohara S. Distribution of phosphorylated glial fibrillary acidic protein in the mouse central nervous system. Genes Cells. 2002;7:295–307. doi: 10.1046/j.1365-2443.2002.00513.x. [DOI] [PubMed] [Google Scholar]
- Topp KS, Faddis BT, Vijayan VK. Trauma-induced proliferation of astrocytes in the brains of young and aged rats. Glia. 1989;2:201–211. doi: 10.1002/glia.440020309. [DOI] [PubMed] [Google Scholar]
- Uyeda CT, Eng LF, Bignami A. Immunological study of the glial fibrillary acidic protein. Brain Research. 1972;37:81–89. doi: 10.1016/0006-8993(72)90347-2. [DOI] [PubMed] [Google Scholar]
- Valentino KL, Jones EG, Kane SA. Expression of GFAP immunoreactivity during development of long fiber tracts in the rat CNS. Brain Research. 1983;285:317–336. doi: 10.1016/0165-3806(83)90029-9. [DOI] [PubMed] [Google Scholar]
- Valverde F, Lopez-Mascaraque L. Neuroglial arrangements in the olfactory glomeruli of the hedgehog. Journal of Comparative Neurology. 1991;307:658–674. doi: 10.1002/cne.903070411. [DOI] [PubMed] [Google Scholar]
- Venance L, Premont J, Glowinski J, Giaume C. Gap junctional communication and pharmacological heterogeneity in astrocytes cultured from the rat striatum. Journal of Physiology. 1998;510 (Pt 2):429–440. doi: 10.1111/j.1469-7793.1998.429bk.x. [DOI] [PMC free article] [PubMed] [Google Scholar]
- Wallraff A, Odermatt B, Willecke K, Steinhauser C. Distinct types of astroglial cells in the hippocampus differ in gap junction coupling. Glia. 2004;48:36–43. doi: 10.1002/glia.20040. [DOI] [PubMed] [Google Scholar]
- Walz W. Controversy surrounding the existence of discrete functional classes of astrocytes in adult gray matter. Glia. 2000;31:95–103. doi: 10.1002/1098-1136(200008)31:2<95::aid-glia10>3.0.co;2-6. [DOI] [PubMed] [Google Scholar]
- Waxman SG. The astrocyte as a component of the node of Ranvier. Trends in Neurosciences. 1986;9:250–253. [Google Scholar]
- Wilkin GP, Marriott DR, Cholewinski AJ. Astrocyte heterogeneity. Trends in Neurosciences. 1990;13:43–46. doi: 10.1016/0166-2236(90)90065-i. [DOI] [PubMed] [Google Scholar]
- Won CL, Oh YS. cAMP-induced stellation in primary astrocyte cultures with regional heterogeneity. Brain Research. 2000;887:250–258. doi: 10.1016/s0006-8993(00)02922-x. [DOI] [PubMed] [Google Scholar]
- Ye H, Hernandez MR. Heterogeneity of astrocytes in human optic nerve head. Journal of Comparative Neurology. 1995;362:441–452. doi: 10.1002/cne.903620402. [DOI] [PubMed] [Google Scholar]
- Yong VW, Yong FP, Olivier A, Robitaille Y, Antel JP. Morphologic heterogeneity of human adult astrocytes in culture: correlation with HLA-DR expression. Journal of Neuroscience Research. 1990;27:678–688. doi: 10.1002/jnr.490270428. [DOI] [PubMed] [Google Scholar]
- Yuasa S. Bergmann glial development in the mouse cerebellum as revealed by tenascin expression. Anatomy and Embryology (Berlin) 1996;194:223–234. doi: 10.1007/BF00187133. [DOI] [PubMed] [Google Scholar]
- Zerlin M, Milosevic A, Goldman JE. Glial progenitors of the neonatal subventricular zone differentiate asynchronously, leading to spatial dispersion of glial clones and to the persistence of immature glia in the adult mammalian CNS. Developmental Biology. 2004;270:200–213. doi: 10.1016/j.ydbio.2004.02.024. [DOI] [PubMed] [Google Scholar]
- Zhang SC. Defining glial cells during CNS development. Nature Reviews Neuroscience. 2001;2:840–843. doi: 10.1038/35097593. [DOI] [PubMed] [Google Scholar]