Recurrent DNA inversion rearrangements in the human genome (original) (raw)
Abstract
Several lines of evidence suggest that reiterated sequences in the human genome are targets for nonallelic homologous recombination (NAHR), which facilitates genomic rearrangements. We have used a PCR-based approach to identify breakpoint regions of rearranged structures in the human genome. In particular, we have identified intrachromosomal identical repeats that are located in reverse orientation, which may lead to chromosomal inversions. A bioinformatic workflow pathway to select appropriate regions for analysis was developed. Three such regions overlapping with known human genes, located on chromosomes 3, 15, and 19, were analyzed. The relative proportion of wild-type to rearranged structures was determined in DNA samples from blood obtained from different, unrelated individuals. The results obtained indicate that recurrent genomic rearrangements occur at relatively high frequency in somatic cells. Interestingly, the rearrangements studied were significantly more abundant in adults than in newborn individuals, suggesting that such DNA rearrangements might start to appear during embryogenesis or fetal life and continue to accumulate after birth. The relevance of our results in regard to human genomic variation is discussed.
Keywords: nonallelic homologous recombination, somatic cell variation, structural variation
Studies from different laboratories have now cumulatively indicated that the human genome is a dynamic structure. For example, gene amplification has been shown to be a recurrent mechanism by which mammalian cells develop chemical resistance (1) or a manifestation of tumorigenesis progression (2). Genomic rearrangements can also serve as a basis for certain human diseases and genomic disorders (3). One of the first pathological conditions recognized as resulting from rearrangements in the human genome was ∝-thalassemia, which is caused by deletions in the ∝-globin loci on human chromosome 16 (4). A large number of genomic disorders have been already identified and shown to be associated with genomic imbalances resulting from chromosomal rearrangements. In some cases, a similar rearrangement at the same locus, but which leads to a different type of imbalance, can lead to different clinical conditions. For example, a duplication of the myelin gene, PMP22, results in Charcot–Marie–Tooth disease type 1A (CMT1A), whereas the deletion of the same gene causes hereditary neuropathy with liability to pressure palsies (HNPP) (5). Indeed, many common traits may be the result of genomic rearrangements. These include cases of male infertility, hypertension, mental retardation, and color blindness, among others (see ref. 5 for a review).
Since the release of the human genome sequence in 2001 (6), much attention has been directed to features of the human genome that are variable among individuals. Initially, it was widely accepted that the vast extent of this variation existed primarily as SNPs and low-complexity tandem-repeat variants, such as micro- and minisatellites. This conception of the human genome has dramatically changed since the publication of two seminal papers by Iafrate et al. (7) and Sebat et al. (8) in 2004. These groups showed that the genome of healthy individuals differs in the copy number of different DNA segments that range in size from kilobases to megabases. Other groups have used a variety of techniques to confirm the findings of the initial studies and to identify more sites and types of structural genomic variation in the genomes of healthy individuals, including deletions, duplications, and inversions (9–17).
Most interesting is the accumulation of evidence for the notion that structural genomic variation is associated with the susceptibility to certain common diseases, such as glomerulonephritis (18). In some instances, a particular structural genomic variation has been shown to predispose to chromosomal rearrangements that in turn result in pathological conditions (19). Actually, structural variation appears to contribute a larger number of variable base pairs than SNPs (15, 20, 21). However, our understanding of structural variation and its phenotypic consequences, such as involvement in genomic disorders and the predisposition to certain traits, is still thought to be in its infancy. Comprehensive studies in this field undoubtedly will enhance our understanding of the dynamics of the human genome.
On the basis of the existence of widespread structural genomic variation and human genomic disorders, it can be inferred that the human genome is subject to recurrent chromosomal rearrangements. Moreover, in several cases it has been shown that the same type of structural genomic variation can recur in unrelated individuals. One mechanism that has been proposed as a cause of some of these recurrent rearrangements in the human genome is nonallelic homologous recombination (NAHR) (5, 9, 22). In NAHR, repeated sequences presenting high identity recombine, producing different types of rearrangements, including deletions, duplications, inversions, and translocations of DNA segments. The type of rearrangements derived from NAHR depends on the location and relative orientation of the repeated sequences that are involved in the recombination event. A recent study by Lam and Jeffreys (23) demonstrated the occurrence of spontaneous deletions derived from NAHR in the genomic region harboring the duplicated ∝-globin genes in human chromosome 16.
The research in our laboratory has focused on the study of chromosomal rearrangements in the bacterial genome. From the DNA sequence of a genome, the different reiterated regions can be located and the potential rearrangements that can be generated by NAHR can be predicted. Previously, we have used a PCR-based experimental approach to verify the occurrence of these different types of rearrangements in bacterial cultures (24, 25). We have now implemented this PCR-based strategy to analyze genomic rearrangements in the human genome. Our results support that recurrent genomic rearrangements derived from NAHR events occur at high frequency in human somatic cells.
Results
Rationale for the Analysis of Human Genome Dynamics.
To study the dynamics of the human genome, we have targeted the detection of chromosomal rearrangement breakpoints. This requires the availability of a very high-quality genomic reference sequence. The current human genome sequence meets such quality standards, containing few gaps with a very low estimated error rate (26). For this study, the National Center for Biotechnology Information (NCBI) Build 36 version of the human reference genome sequence was used.
To identify potential sites for NAHR, the human reference genome sequence was first analyzed to find chromosomal regions of high sequence identity. If an NAHR-mediated recombination event is to occur, new genomic structures would be expected to be formed. Moreover, if these events occurred in somatic cells, then these new genomic structures would be predicted to be present in a very small fraction of the total cells being analyzed, with the vast majority of cells containing the corresponding nonrearranged genomic structure (herein referred to as wild-type structures). Evidence for this can be found in other organisms, such as bacteria (24, 25). Hence, to identify such chromosomal rearrangements, a very sensitive and specific experimental procedure is necessary. In our view, at the present time, the technique of choice for this type of study would be a PCR-based assay using appropriately defined oligonucleotide primers.
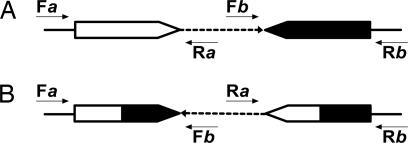
The present study is focused on DNA inversions derived from NAHR events between pairs of repeated sequences located in inverse orientation that may generate DNA inversions. The scheme presented in Fig. 1A exemplifies a pair of wild-type structures, denoted as a and b, and the corresponding inversion rearrangement that may be produced by NAHR (Fig. 1B), along with the PCR primers necessary to detect the different structures. The primers must match regions proximal, albeit external, to the repeats. If forward and reverse primers flanking one of the repeats are used for the PCR assay, then the corresponding wild-type structure is detected (Fig. 1A). An inversion breakpoint may be detected by using either both forward primers (F_a_ and F_b_) or both reverse primers (R_a_ and R_b_) (Fig. 1B). According to the position of the corresponding primers in the nucleotide sequence, the exact size of the expected PCR fragment can be calculated.
Fig. 1.
Detection of wild-type and rearranged structures by PCR. (A) Repeated sequences in inverse orientation. (B) Structures formed by an inversion rearrangement. White or black large arrowheads represent the wild-type identical cores a and b, respectively (see Results); mixed (white and black) large arrowheads represent the repeated cores after the rearrangement. Thin black arrows represent PCR primers: F_a_, forward primer of region a; R_a_, reverse primer of region a; F_b_, forward primer of region b, R_b_, reverse primer of region b (see Results). Dashed arrows represent the DNA between the corresponding repeated sequences; solid lines represent DNA outside the segment containing the corresponding repeated sequences.
Selection of Repeated Sequences to Analyze Genome Dynamics.
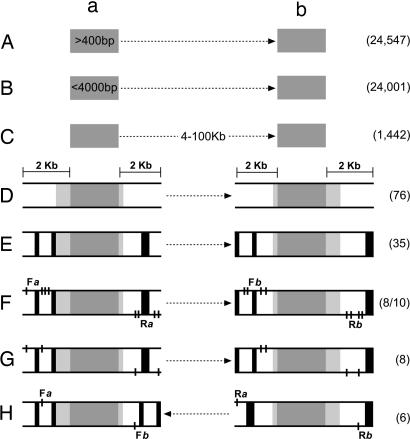
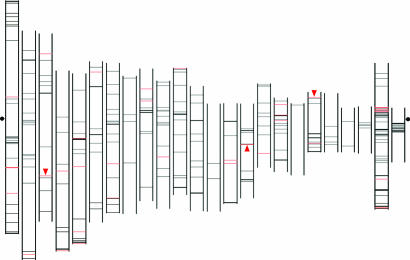
The genomic regions to be studied were selected by a multistep bioinformatic procedure schematized in Fig. 2. The first step consisted of the identification of all pairs of intrachromosomal inverted sequences formed by two cores, a and b, of at least 400 nucleotides in length sharing 100% sequence identity (see Materials and Methods). These pairs of sequences are herein referred to as potential recombinogenic inverted sequences (PRIS) (Fig. 2A). A total of 24,547 PRIS were found in the NCBI Build 36 of the human reference genome. The PRIS are distributed among all 24 different chromosomes, and the cores comprising these PRIS varied in length from 400 to 74,868 nucleotides. The total number of nucleotides present in the nonredundant PRIS was 31,115,694 bp, accounting for ≈1% of the human genome. We subsequently restricted our search to PRIS formed by cores smaller than 4 kb in length and, hence, which might be efficiently amplified by standard PCR methodologies (n = 24,001; Fig. 2B), followed by an additional arbitrary search criteria whereby the distance separating the corresponding cores of a PRIS was between 4 kb and 100 kb (n = 1,442; Fig. 2C). The genomic distribution of this set of PRIS is shown in Fig. 3.
Fig. 2.
Bioinformatic workflow pathway to select appropriate regions to study human genome dynamics by PCR. Different steps of the workflow pathway as described in the text. Dark gray zones represent identical cores a and b of each region. Light gray zones represent homologous regions adjacent to identical cores. Black zones represent common repeats of the human genome. White zones represent DNA segments that can be used to design the corresponding PCR primers. Dashed arrows represent DNA present between the identical cores of the corresponding region. Black lines represent the position of primers: F_a_, forward primer(s) of region a; R_a_, reverse primer(s) of region a; F_b_, forward primer(s) of region b; R_b_, reverse primer(s) of region b. The restrictions imposed in different steps are indicated in the first step in which they were introduced (see Results). The numbers of PRIS remaining after the different restrictions imposed are indicated in parenthesis; from step F, of the 35 PRIS remaining only 10 were analyzed (see Results).
Fig. 3.
Localization of moderately sized PRIS in the human chromosomes. Starting on the left-hand side of the figure, human chromosomes 1–22, X, and Y are aligned by the centromere (indicated by dots at the left and right side of the figure). The p arm is shown at the top and the q arm at the bottom of each chromosome. The lines indicate the position of the 1,442 PRIS formed by two cores of intrachromosomal inverted DNA sequences sharing 100% identity with a size ranging from 400 to 4,000 nucleotides and situated at a distance between 4 kb and 100 kb (see Results). The set of workable PRIS (see Results) is indicated by red lines. The red triangles correspond to the three PRIS analyzed in this study and referred to in the text as regions IR-1 (in chromosome 19), IR-2 (in chromosome 15), and IR-3 (in chromosome 3).
To design appropriate primers flanking the two cores of the corresponding PRIS, the presence of zones of “unique” DNA sequence upstream and downstream of each core is imperative. We refer here to “unique” DNA sequence as one compared with the corresponding borders of each core of the PRIS and not to the whole genome. It is important to point out that most of the cores are actually immersed in larger homologous regions presenting high identity, usually referred to as segmental duplications (22). We determined the degree of sequence identity in the regions adjacent to the corresponding cores of each of the PRIS by global alignment (see Materials and Methods) of the DNA sequence of each core extended 2 kb upstream and 2 kb downstream. The analysis of the 1,442 alignments determined that only 76 PRIS contain zones of “unique” DNA sequence (Fig. 2D).
Furthermore, the presence of DNA sequences reiterated in other locations of the genome could impair the performance of the corresponding PCR primers. The most prominent reiterated elements of the human genome are the so-called common repeats. These repeats include simple and low-complexity tandem repeats, such as microsatellites and minisatellites, short and long interspersed nuclear elements, DNA transposons, and ribosomal and transfer RNAs, among others. The presence of common repeats in the borders of each core of the 75 PRIS was determined (see Materials and Methods). Only those presenting at least 200 bp of “unique” DNA sequence devoid of common repeats in both borders of each PRIS were selected. This selection resulted in a set of 35 workable PRIS (Fig. 2E).
In summary, according to the different restrictions imposed in the present study, each workable PRIS is formed by two cores, a and b, of intrachromosomal inverted DNA sequences sharing 100% identity, with a size ranging from 400 to 4,000 nucleotides, situated at a distance between 4 kb and 100 kb, and presenting at least 200 bp of unique sequence in the zones located 2 kb upstream and 2 kb downstream of each core (see scheme in Fig. 2E). This workable set of PRIS is distributed among most of the chromosomes and is highlighted in Fig. 3; the locations of the cores of each PRIS, their sizes, and the distance between them are listed in supporting information (SI) Table 1.
Design of Valid Primers to Analyze Genome Dynamics.
From this set of workable PRIS, we arbitrarily selected 10 to design PCR primers. From our experience using the PCR method to detect rearrangements in bacterial genomes, we have realized that it is important to design and test several PCR primers flanking each of the selected repeated sequences (24). Accordingly, four forward primers were designed in the upstream region and four reverse primers were designed in the downstream region of the two cores, a and b, of each of the selected PRIS. The design of each primer included the analysis of its potential priming sites in the whole genome and its capacity to generate PCR products in silico when combined with other prospective primers (see Materials and Methods). All primers selected as _in silico_-valid were highly specific to detect its corresponding genomic region. Furthermore, when combined to detect the corresponding inversion rearrangement, no in silico products were reported.
From the 10 selected PRIS, we could design _in silico_-valid PCR primers for 8 of them (Fig. 2F). The corresponding 32 PCR primers of each of the eight PRIS selected were synthesized and tested experimentally. The 16 combinations of oligonucleotides to detect each of the cores of the set of eight PRIS in the wild-type configuration were used to prime PCRs using a DNA sample derived from blood cells as target. Only those primers producing a single PCR product of the expected size were accepted. If the electrophoresis gels to detect the PCR products were overloaded, then, in some cases, faint secondary bands were observed; this situation was considered acceptable. From the acceptable PCR products we inferred the valid PCR primers.
For the analysis of the inversion breakpoints, we used the set of eight PRIS with valid PCR primers. Each PRIS in this set had at least two valid forward and two valid reverse primers for each core (Fig. 2G). All of the combinations of valid primers were used to search for the inversion breakpoints in each PRIS. It is important to point out that, in contrast to the reactions detecting the wild-type structures, primary PCRs for detecting the inversion rearrangement usually did not produce visible bands after staining the gels with ethidium bromide (see below). This result was expected, because the number of cells containing the targeted rearrangement is expected to be highly diluted in the sample being tested. Hence, secondary PCRs, usually nested or heminested, were performed by using an aliquot of the product of the primary reaction and all of the possible combinations of appropriate primers. Potential evidence for a rearrangement (Fig. 2H) was considered when the appropriate combination of primers produced a PCR product of the expected size of the fragment rearranged and without secondary bands. From the eight PRIS analyzed, in six cases we had clear potential evidence of inversion rearrangements. To ascertain that the PCR product was a recombinant fragment containing the corresponding regions adjacent to core a in one end and to core b in the other end (see above and Fig. 1), the nucleotide sequence of the borders of the PCR products was obtained. The fragments selected presented a DNA sequence that matched that of the expected inverted region. In some cases, we detected minor deviations from the reference sequence that should correspond to SNPs or mutations (data not shown). The six PRIS that showed evidence of inversion rearrangements correspond to numbers 5, 6, 7, 13, 22, and 27 in SI Table 1. Five of them are located within known human genes; in two cases, the corresponding cores overlap with exons (PRIS 22 and 27), whereas in the other three, both cores are contained within the same intron (PRIS 5, 6, and 13).
Assembly of Rearrangement Kits.
For further experiments, we selected PRIS 27, located on chromosome 19; PRIS 22, located on chromosome 15; and PRIS 6, located on chromosome 3. These PRIS will herein be denoted as inverted region 1 (IR-1), 2 (IR-2), and 3 (IR-3), respectively, and are indicated in Fig. 3. For each region, we prepared a set of primers constituting a “rearrangement kit” (RKit) (SI Table 2). Each RKit is composed of all PCR primers necessary to perform the primary and secondary PCRs for detecting the following specific structures of each selected region: the a core, the b core, and the recombinant structure derived from the inversion. Another reagent of each RKit contains a pair of primers to obtain a PCR fragment of the identical sequence corresponding to the cores; when labeled with radioactivity, this fragment can be used as a hybridization probe to detect any of the PCR products corresponding to the specific region.
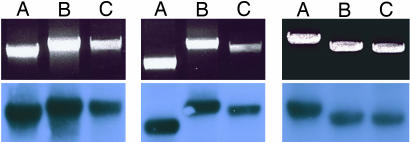
As mentioned above, to validate the fragments corresponding to the inversion rearrangements, the nucleotide sequence of the borders of the corresponding PCR products was determined. The PCR products obtained with the specific primers included in the corresponding RKits of regions IR-1, IR-2, and IR-3 were further validated. Each PCR product was cloned, and the borders of the inserts from three recombinant plasmids, which in all cases showed the size of the expected DNA fragment, were sequenced (see Materials and Methods). For all of the RKits used in this study, the nucleotide sequence of both the PCR product and the insert of the clones derived from it ascertained the presence of the expected borders of the breakpoints derived from the corresponding inversion rearrangement. The reagents of the RKits are presented in SI Table 2. An example of the PCR products representing the different structures of each of the selected regions of the genome is shown in Fig. 4.
Fig. 4.
Detection of wild-type and rearranged structures by PCR. Total human DNA isolated from blood cells of an adult individual (see Materials and Methods) was used as target for PCR primed with the oligonucleotides indicated in SI Table 2 for the RKits corresponding to regions IR-1 (Left), IR-2 (Center), and IR-3 (Right). (Upper) Shown are the PCR products stained with ethidium bromide. (Lower) Shown are the autoradiographies of Southern blots of the gels shown in the upper blots hybridized with the corresponding probe for each region. A, PCRs corresponding to the a core; B, PCRs corresponding to the b core; C, PCRs corresponding to the structure formed by the inversion rearrangement. The migration of the PCR products corresponds to their expected sizes in bp, which are as follows: 2,603; 2,845; 2,876; 2,070; 2,885; 2,694; 3,344; 2,894; and 2,806 from left to right.
Characteristics of the Regions Selected to Detect Genomic Rearrangements.
The regions selected to analyze the occurrence of genomic rearrangements are schematized in Fig. 5. Both the wild-type structure and that derived from an inversion due to NAHR of the corresponding identical cores are shown.
Fig. 5.
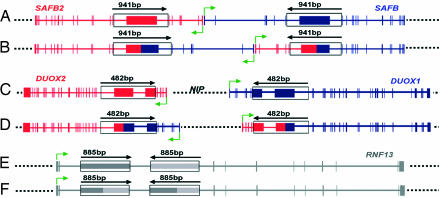
Characteristics of the regions analyzed to detect inversion rearrangements in the human genome. (A) Wild-type structure of IR-1. (B) Inverted structure of IR-1. (C) Wild-type structure of IR-2. (D) Inverted structure of IR-2. (E) Wild-type structure of IR-3. (F) Inverted structure of IR-3. Horizontal solid lines correspond to genes harboring the cores participating in the rearrangement; vertical solid zones correspond to the exons of such genes. In IR-1 and IR-2 where two homologous genes, SAFB2/SAFB and DUOX2/DUOX1, respectively, participate in the rearrangement, one gene is shown in red and one is shown in blue. In IR-3, the gene where the rearrangement is localized is shown in gray. Green arrows indicate the site of initiation and the direction of transcription of each gene. Dotted lines represent DNA between or outside the genes involved in the rearrangements. The identical cores of each region are represented as rectangles. The size scale is different for each region and is expanded in the identical cores; the size of each core is indicated above a solid arrow that shows the relative orientation of each core. The rest of the scale is similar for the various structures present but is different for each region. The scales can be inferred from the size of the DNA segment between the identical cores in each region; 36,924; 24,128; and 7,935 bp for IR-1, IR-2, and IR-3, respectively. In IR-2, the presence of gene NIP in the region between genes DUOX2 and DUOX1 is indicated.
The identical cores a and b of region IR-1 are DNA fragments of 941 bp separated by 36,925 bp. Core a contains exon 7 and part of introns 6-7 and 7-8 of gene SAFB2; core b contains exon 7 and part of introns 6-7 and 7-8 of gene SAFB (Fig. 5A). Genes SAFB2 and SAFB are paralogous genes transcribed in the opposite direction. The function of these genes has been proposed to be involved in chromatin organization, transcriptional regulation, RNA splicing, and stress response (27). As shown in Fig. 5B, an inversion rearrangement derived from NAHR mediated by the two identical cores would alter the structure of the two genes.
In region IR-2, the identical cores are DNA stretches of 482 bp separated by 24,129 bp. Core a includes exon 7 and part of exon 6, as well as intron 6-7 and part of intron 7-8 of gene DUOX2 (Fig. 5C). Core b includes exon 8 and part of exon 7, as well as intron 7-8 and part of intron 8-9 of gene DUOX1 (Fig. 5C). These genes have been annotated as NADPH oxydases and have been found to be highly expressed in thyroid cells (28). In the region between genes DUOX2 and DUOX1, another gene, NIP, is located. As in the case of SAFB2 and SAFB, genes DUOX2 and DUOX1 are paralogous genes transcribed in the opposite direction. Accordingly, the inversion mediated by NAHR of the two identical cores (Fig. 5D) would alter the structure of the genes.
In the case of region IR-3, the identical cores are DNA segments of 885 bp separated by 7,935 bp. Both of them are part of a common repeat structure, a long terminal repeat, and are located in the same intron, intron 3, of gene RNF13 (Fig. 5E). This gene has been annotated as a ring zinc finger protein; its specific function has not been determined. The inversion resulting from NAHR between the two cores (Fig. 5F) would result in a minor alteration of gene structure, located within intron 3, and presumably would not have physiological relevance.
Time Kinetics of the Detection of Rearrangements by PCR.
Using the reagents from a RKit, PCRs were performed to detect either wild-type or rearranged structures. Both primary and secondary reactions were performed, and aliquots were analyzed at different cycles. The aliquots were subjected to agarose gel electrophoresis and revealed by both ethidium bromide staining and by Southern blots hybridized against a radioactive probe. An example using region IR-1 and a target DNA from blood cells is presented in Fig. 6.
Fig. 6.
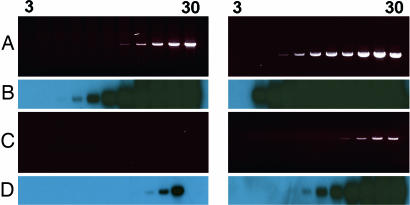
Time kinetics of the PCR to detect wild-type and inverted structures. A 100-ng DNA sample from blood cells of an adult individual was used as target for PCR. The reactions were primed with the oligonucleotides to detect the wild-type structure of core a (A and B) and of the inverted structure (C and D) of region IR-1 (as indicated in SI Table 2). (Left) PCR primary reaction. (Right) PCR secondary reaction. Aliquots were taken every 3 cycles, from cycle 3 to cycle 30. The PCR products were revealed with either ethidium bromide (A and C) or by Southern blots hybridized with the corresponding probe (B and D).
In the PCR revealing the wild-type structure, ethidium bromide staining showed the expected fragment since the primary reaction (Fig. 6A), whereas the structure corresponding to the inversion rearrangement breakpoint was revealed only until the secondary, in this case nested, reaction (Fig. 6C). By using Southern blots, we could demonstrate that the fragment revealing the rearranged structure breakpoint is actually being produced in the primary reaction (Fig. 6D).
Time kinetics of the PCR might be used as a semiquantitative method to estimate the relative proportion of rearranged structures compared with wild-type structures. However, this technique is only an approximation, because the doubling of the PCR product in each cycle is usually obtained in the case of small products and under certain specific conditions, such as those used for quantitative PCR. To quantify the relative proportion of rearrangements in a DNA sample, we decided to use a more reliable method based on the dilution of the target DNA (see below).
Dilution Kinetics of the Detection of Rearrangements by PCR.
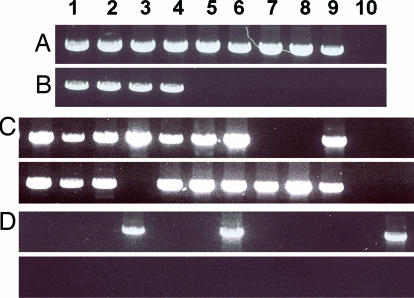
When the target DNA for a PCR is diluted and the reaction is primed to detect a wild-type structure, a dilution is reached in which no product is found. This dilution should be near to a target DNA concentration of approximately one haploid genome per reaction. In contrast, if the reaction is primed to detect a rearrangement, then the dilution at which no product is found should be proportional to the relative concentration of the respective rearrangement in the DNA sample. A typical experiment is presented in Fig. 7 by using a DNA sample from blood cells as target. The wild-type structure corresponding to core a of region IR-1 gave positive PCRs up to a dilution containing ≈10 pg of DNA per reaction; at a concentration of 3 pg per reaction, theoretically slightly less than one haploid genome per reaction, no PCR product was observed (Fig. 7A). In contrast, when the PCR was primed to detect the inversion breakpoint, the reaction containing ≈3 ng was still positive, whereas the reactions containing 1 ng or less were all negative (Fig. 7B).
Fig. 7.
Dilution kinetics to detect wild-type and inverted structures. A DNA sample from blood cells of an adult individual was used as target for PCR. PCR was primed with the oligonucleotides to detect the wild-type structure of core a (A) and the inverted structure (B–D) of IR-1 (as indicated in SI Table 2). The PCR products were revealed by ethidium bromide after gel electrophoresis. (A and B) Different amounts of DNA were used: 1, 100 ng; 2, 33 ng; 3, 10 ng; 4, 3 ng; 5, 1 ng; 6, 333 pg; 7, 100 pg; 8, 33 pg; 9, 10 pg, 10, 3 pg. (C and D) Twenty-four different aliquots containing 3 ng (C) or 1 ng (D) of DNA were used to detect the inverted structure.
It is important to note that, as expected, at the dilutions presenting the last positive or the first negative reaction, some aliquots present positive and some negative reactions. This finding is illustrated in Fig. 7 C and D for PCRs detecting the inversion rearrangement. From 24 aliquots of the dilution containing 3 ng of target DNA per reaction, 17 were positive (Fig. 7C). At the next dilution, containing 1 ng of target DNA per reaction, of 24 aliquots only 3 gave positive reactions (Fig. 7D). In dilutions containing 18 ng or more target DNA per reaction, all of the aliquots gave a positive reaction, whereas in dilutions containing <1 ng, all of the aliquots gave negative reactions (data not shown). The relative concentration of DNA necessary to produce one positive reaction detecting the rearrangement, compared with that necessary to produce a positive reaction detecting the wild-type structure, is proportional to the relative concentration of rearranged vs. wild-type structures in the target DNA.
Relative Concentration of Rearranged Structures in Different Samples of DNA Derived from Somatic Cells.
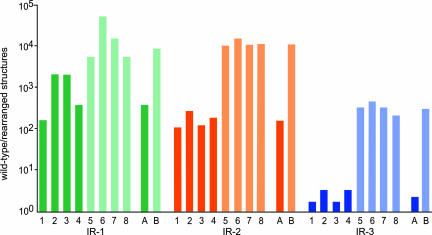
The dilution strategy exemplified above was used to detect the relative concentration of rearrangement breakpoints in DNA samples from unrelated individuals. DNA was extracted from blood cells of either newborn (umbilical cord blood) or adult individuals (see Materials and Methods). For each DNA sample, several aliquots from different dilutions were used as targets for PCRs to detect both wild-type (core a) and the corresponding rearranged structure derived from inversion events of regions IR-1, IR-2, and IR-3. Several aliquots of appropriate dilutions were used, and the relative concentration of target DNA to produce one positive reaction detecting either the wild-type or the corresponding rearranged structure was calculated. The ratio of the concentration of wild-type structures over that of rearranged structures of the different target DNAs is presented in a logarithmic scale in Fig. 8.
Fig. 8.
Relative concentration of wild-type and inverted structures in DNA samples isolated from different nonrelated individuals. DNA isolated from blood cells of different individuals was used as target for PCR. The reaction was primed with the oligonucleotides indicated in SI Table 2 to detect the a cores or the inverted structures of IR-1, IR-2, and IR-3. The amount of wild-type and inverted structures was determined by analyzing several aliquots from samples containing different amounts of DNA (see Results). The relative amount of wild-type structures to inverted structures is indicated in a logarithmic scale. 1–4, DNA samples from four different adult individuals; 5–8, DNA samples from umbilical cord blood of four different newborns (see Materials and Methods); A, mean value for DNA from adult individuals; B, mean value for DNA from newborn individuals.
The eight individuals tested presented inversion rearrangements in the three regions analyzed. However, the relative concentration of rearrangements varied both between samples and between regions. At the extremes, a newborn sample of DNA presented ≈105 wild-type structures per one inverted structure in region IR-1 (individual 6), whereas some adult samples presented approximately two wild-type structures per one inverted structure in region IR-3 (individuals 1 and 3). In all samples, region IR-3 presented a higher relative concentration of rearranged structures than regions IR-1 and IR-2. The most striking finding was that, for the three regions analyzed, DNA isolated at the time of birth contained a significantly lower concentration of rearranged structures than that isolated from adult individuals. The difference of mean values between the two groups was significant for the three regions, IR-1 (P < 0.02), IR-2 (P < 0.001), and IR-3 (P < 0.001), by using a one-way analysis of variance. The ratio of mean values between both groups was 17-, 70-, and 166-fold for regions IR-1, IR-2 and IR-3, respectively.
Discussion
This study shows that total DNA from blood cells of unrelated, healthy individuals contains genomic structures that evidence inversion rearrangements derived from NAHR. From these results it can be inferred that such rearrangements are recurrent in the human genome. Moreover, these events occur at a relatively high frequency compared with point mutations. The rearrangements breakpoints are present in low proportions in the DNA samples, and thus highly specific and sensitive approaches capable of detecting these genomic alterations must be used. The PCR methodology allows such specificity and sensitivity, provided that appropriate primers can be obtained. The multistep procedure that we have proposed, although laborious and time-consuming, is suitable for this purpose.
It has been reported that under certain conditions, PCR can produce chimeric molecules derived from the in vitro interaction between molecules sharing a common sequence track (29, 30). The conditions used for the PCRs in this study have been optimized to avoid such artifacts. In fact, the overall results obtained here are not compatible with being derived from PCR artifacts. A careful analysis of the data presented in Fig. 7 illustrates this point. At a certain DNA dilution, different aliquots of the target DNA, containing the same amount of wild-type structures, produce either positive or negative reactions when primed to detect the corresponding rearranged structure (Fig. 7D). Moreover, increasing the amount of wild-type structures by 3-fold (Fig. 7C) results in different aliquots still having either positive or negative reactions. This indicates that the target to obtain the PCR product corresponding to the rearranged structure has reached a critical point of dilution in the DNA sample, whereas wild-type structures are still in excess. Most important in regard to this point are the data presented in Fig. 8. Although the methodology for DNA isolation and the conditions of the PCRs were the same for all of the samples analyzed, the relative concentration of wild-type vs. rearranged structures varied more than 100-fold when certain types of samples were compared.
One of the genomic regions analyzed, region IR-3, presented a much higher concentration of rearranged structures. Actually, in adult individuals, the concentration of the rearranged structures approached that of the wild-type structures. In this region, the distance separating the identical cores is smaller, ≈8 kb, than that of regions IR-1 (≈37 kb) and IR-2 (≈24 kb). In addition, the two identical cores of this region are located within one intron (see Fig. 5), and, presumably, its inversion should not have physiological consequences. However, the few regions analyzed do not allow proposing a conclusion. In contrast to region IR-3, inversion rearrangements in regions IR-1 and IR-2 might result in chimeric genes that in turn could produce alternative mRNAs and proteins, as well as differences in transcriptional regulation.
The human genome presents a very large number of reiterated sequences that could generate rearrangements by NAHR. The procedure to select appropriate regions used here is very stringent and allows the analysis of a minor fraction of potential recombinogenic regions, in this case only 2.5% of the regions in which the identical cores are separated by a distance from 4 to 100 kb. Future improvements in the bioinformatic and experimental procedures will certainly result in the possibility of analyzing a larger proportion of the genome. From the eight PRIS finally selected to search for inversion rearrangement breakpoints, we found positive evidence for six. This result suggests that a large number of potential recombinogenic regions might actually produce rearrangements. Moreover, it must be pointed out that the lack of evidence for rearrangement with the PCR methodology proposed does not ascertain the absence of rearranged structures. As mentioned above, not all of the combinations of valid primers are suitable to detect rearrangements.
Our results, together with those of Lam and Jeffreys (23), indicate that some cells within a population, in this case blood cells from normal individuals, can undergo genomic rearrangements. Assuming that a very large amount of different rearrangements can be generated in the human genome, cell populations might be considered as mosaics in regard to their genome structure. However, these inversion rearrangements do not compromise permanently the structure of the genome, because they are potentially reversible events. Some of the rearrangements might impair the survival of the respective cell, leading to its death. Others might be physiologically neutral and thus should be found in the population at a proportion related to the rate of generation of the rearrangement and to the lifespan of the respective cell line, among other factors. It is conceivable that certain rearrangements could make some cells better fitted for certain functions within a mosaic cell population. Finally, some rearrangements could result in cells having a reproductive advantage. This could be related to the series of genetic alterations that participate in the development of cancer. Indeed, the tandem amplification of some proto-oncogenes (31) could be a typical example.
The experiments presented in Fig. 8 show that, for the three regions analyzed, the respective rearrangements are present at significantly higher concentrations in the DNA from adult than that from newborn individuals. This finding suggests that rearrangements might start to appear during embryonic or fetal development and continue to accumulate during the lifespan of the individual.
It is of utmost importance to find out whether different recurrent rearrangements occur as well in the germ-line cells. Considering structural polymorphisms as an important class of genetic variation in human genomes, various studies have addressed the question of its heritability. From the existence of inversion polymorphisms (32) and copy number variants (10) associated with a modest level of linkage disequilibrium with SNP markers (33), it can be inferred that rearrangements do occur in the germ line. Recently, Lam and Jeffreys (23) have found deletions in the region of the ∝-globin genes in spermatozoids of normal individuals. If a gamete with a particular rearrangement participates in the development of a new individual and if this individual is fertile, then the rearrangement might be spread in the population as a structural variant or polymorphism.
The finding of recurrent rearrangements in somatic cells of normal individuals should expand our concepts in human variation. The genome varies not only between individuals but also within cell populations of a single individual.
Materials and Methods
Approval of the Protocol and Informed Consent.
The protocol for this study was approved by the Bioethics Committee of the Center for Genomic Sciences of the National University of Mexico. Informed consent was obtained for participating individuals.
Collection of Blood.
Umbilical cord blood was obtained from remainder umbilical cord attached to placenta after vaginal delivery. Blood was collected by the delivering physicians by using elution into cups followed by transfer to EDTA tubes. Blood from adult individuals (ages from 20 to 60 years) was collected by venepuncture into tubes containing EDTA. All of the blood samples were deidentified and assigned study identification numbers so that results could not be linked to specific subjects.
DNA Purification.
DNA was purified from blood samples by using the QIAamp DNA Blood mini kit from Qiagen (Valencia, CA). DNA concentration was estimated with the Smart Spec 3000 from BioRad (Hercules, CA). Each DNA sample was adjusted to different concentrations, and several aliquots of each concentration were frozen until used.
PCR Conditions.
All of the primers used are shown in SI Table 1 and were commercially synthesized by Biosynthesis (Lewinsville, TX). PCRs were performed with the rTth DNA Polymerase XL kit from Applied Biosystems (Foster City, CA) by using a GeneAmp PCR System 9700 from Applied Biosystems. Unless otherwise indicated, PCR conditions for both primary and secondary reactions (usually nested or heminested) (see SI Table 1) underwent the following: denaturation at 94°C for 3 min; 35 cycles of denaturation (30 sec at 94°C), annealing and synthesis (5 min at 65°C), and extension (5 min at 72°C); and a final extension for 10 min at 72°C. To perform secondary reactions, an aliquot of the product of the corresponding primary reaction was used as target DNA.
Cloning of PCR Products.
Before cloning, PCR products were cleaned by PCR96 Cleanup kit (Millipore, Billerica, MA) or purified from agarose gels by using the QIAquick Gel Extraction kit (Qiagen). These products were cloned by T-A annealing into pCR 2.1-TOPO vector by using the TOPO TA Cloning kit (Invitrogen, Carlsbad, CA).
DNA Sequencing.
DNA sequencing reactions were performed by using the Big Dye Terminator V3.1 Cycle Sequencing kit using the AB1 3730 XL automatic DNA sequencer (Applied Biosystems).
Bioinformatics Methods.
The bioinformatics methodology used in this study was a combination of published sequence analysis programs and a set of Perl scripts made to optimize the selection of the regions according to the different conditions we established. The sequences of the 24 human chromosomes of the NCBI Build 36.1 human genome assembly were downloaded from the NCBI FTP site (accession nos. NC_000001–NC_000024) to work with them locally. The software tool REPuter (34) was used for the identification of all of the 100% identical repeated sequences with a minimum length of 400 nucleotides in each of the human chromosomes. For the global alignment of the sequences and to best identify the similarities and differences between them, we used the multiple global alignment program ClustalW (35). The identification of all common repeats was made by using the RepeatMasker program (by A. Smit, R. Hubley, and E. Green; www.repeatmasker.org), which screens DNA sequences for interspersed repeats and low-complexity DNA sequences. The oligonucleotides used for priming the PCRs were first designed by using the Oligo 6 Primer Analysis software. Next, two main Perl scripts were used for the testing of the oligonucleotides. The first one, which we called “StringSearch,” was used for finding the regions in the genome where the oligonucleotides could match with zero or any given number of mismatches. The second Perl script, called “VirtualPCR,” was used for predicting all of the possible PCR products that could be formed by a given pair of primers with zero or any given number of mismatches.
Supplementary Material
Supporting Tables
Acknowledgments
We thank Jaime Mora for sharing an academic life full of ideals; Guillermo Soberón, Robert Haselkorn, Donald Helinski, and Robert Schimke for their continuous support, encouragement, and inspiration; David Romero and Julio Collado for their helpful suggestions; Dr. Ricardo Jáuregui Tejeda (Hospital General de Toluca Dr. Nicolás San Juan, Toluca, Mexico) for providing umbilical cord blood samples; and Angeles Moreno, Marisa Rodríguez, Rosa Ma. Ocampo, Rosa Isela Santamaría, and Alma R. Reyes for their technical assistance.
Abbreviations
IR-n
inverted region n
NAHR
nonallelic homologous recombination
PRIS
potential recombinogenic inverted sequences
RKit
rearrangement kit.
Footnotes
The authors declare no conflict of interest.
References
- 1.Alt F, Kellems RE, Bertino JR, Schimke RT. J Biol Chem. 1978;253:1357–1370. [PubMed] [Google Scholar]
- 2.Schimke RT. Cell. 1984;37:705–713. doi: 10.1016/0092-8674(84)90406-9. [DOI] [PubMed] [Google Scholar]
- 3.Shaw CJ, Lupski JR. Hum Mol Genet. 2004;13:R57–R64. doi: 10.1093/hmg/ddh073. [DOI] [PubMed] [Google Scholar]
- 4.Higgs DR, Old JM, Pressley L, Clegg JB, Weatherall DJ. Nature. 1980;284:632–635. doi: 10.1038/284632a0. [DOI] [PubMed] [Google Scholar]
- 5.Stankiewicz P, Lupski JR. Curr Opin Genet. 2002;12:312–319. doi: 10.1016/s0959-437x(02)00304-0. [DOI] [PubMed] [Google Scholar]
- 6.Lander ES, Linton LM, Birren B, Nusbaum C, Zody MC, Baldwin J, Devon K, Dewar K, Doyle M, FitzHugh W, et al. Nature. 2001;409:860–921. doi: 10.1038/35057062. [DOI] [PubMed] [Google Scholar]
- 7.Iafrate AJ, Feuk L, Riviera MN, Listewnik ML, Donahoe PK, Qi Y, Scherer SW, Lee C. Nat Genet. 2004;36:949–951. doi: 10.1038/ng1416. [DOI] [PubMed] [Google Scholar]
- 8.Sebat J, Lakshmi B, Troge J, Alexander J, Young J, Lundin P, Maner S, Massa H, Walker M, Chi M, et al. Science. 2004;305:525–528. doi: 10.1126/science.1098918. [DOI] [PubMed] [Google Scholar]
- 9.Tuzun E, Sharp AJ, Bailey JA, Kaul R, Morrison VA, Pertz LM, Haugen E, Hayden H, Albertson D, Pinkel D, et al. Nat Genet. 2005;37(7):727–732. doi: 10.1038/ng1562. [DOI] [PubMed] [Google Scholar]
- 10.Conrad DF, Andrews TD, Carter NP, Hurles ME, Pritchard JK. Nat Genet. 2005;38:75–81. doi: 10.1038/ng1697. [DOI] [PubMed] [Google Scholar]
- 11.Hinds DA, Stuve LL, Nilsen GB, Halperin E, Eskin E, Ballinger DG, Frazer KA, Cox DR. Science. 2005;307:1072–1079. doi: 10.1126/science.1105436. [DOI] [PubMed] [Google Scholar]
- 12.McCarroll SA, Hadnott TN, Perry GH, Sabeti PC, Zody MC, Barrett JC, Dallaire S, Gabriel SB, Lee C, Daly MJ, et al. Nat Genet. 2005;38:86–92. doi: 10.1038/ng1696. [DOI] [PubMed] [Google Scholar]
- 13.Sharp AJ, Locke DP, McGrath SD, Cheng Z, Bailey JA, Vallente RU, Pertz LM, Clark RA, Schwartz S, Segraves R, et al. Am J Hum Genet. 2005;77:78–88. doi: 10.1086/431652. [DOI] [PMC free article] [PubMed] [Google Scholar]
- 14.Stefansson H, Helgason A, Thorleifsoon G, Steinthorsdottir V, Masson G, Barnard J, Baker A, Jonasdottir A, Ingason A, Gudnadottir VG, et al. Nat Genet. 2005;37:129–137. doi: 10.1038/ng1508. [DOI] [PubMed] [Google Scholar]
- 15.Redon R, Ishikawa S, Fitch KR, Feuk L, Perry GH, Andrews TD, Fiegler H, Shapero MH, Carson AR, Chen W, et al. Nature. 2006;444:444–454. doi: 10.1038/nature05329. [DOI] [PMC free article] [PubMed] [Google Scholar]
- 16.Khaja R, Zhang J, MacDonald JR, He Y, Joseph-George AM, Wei J, Rafia MA, Qian C, Shaga M, Pantano L, et al. Nat Genet. 2006;38:1413–1418. doi: 10.1038/ng1921. [DOI] [PMC free article] [PubMed] [Google Scholar]
- 17.Wong KK, de Leevw RJ, Dosanjh NS, Kimm LR, Cheng Z, Horsman DE, MacAulay C, Ng RT, Brown CJ, Eichler EE, et al. Am J Hum Genet. 2007;80:91–104. doi: 10.1086/510560. [DOI] [PMC free article] [PubMed] [Google Scholar]
- 18.Aitman T, Dong R, Vyse TJ, Norsworthy PJ, Johnson MD, Smith J, Mangion J, Roberton-Lowe C, Marshall AJ, Petretto E, et al. Nature. 2006;439:851–855. doi: 10.1038/nature04489. [DOI] [PubMed] [Google Scholar]
- 19.Koolen DA, Vissers LE, Pfundt R, Leeuw N, Knight S, Regan R, Kooy RF, Reyniers E, Romano C, Fichera M, et al. Nat Genet. 2006;38:999–1001. doi: 10.1038/ng1853. [DOI] [PubMed] [Google Scholar]
- 20.Sharp AJ, Cheng Z, Eichler EE. Annu Rev Genomics Hum Genet. 2006;7:407–442. doi: 10.1146/annurev.genom.7.080505.115618. [DOI] [PubMed] [Google Scholar]
- 21.Freeman JL, Perry GH, Feuk L, Redon R, McCarroll AS, Altshuler DM, Aburatani H, Jones KW, Tyler-Smith C, Hurles ME. Genome Res. 2006;16:949–961. doi: 10.1101/gr.3677206. [DOI] [PubMed] [Google Scholar]
- 22.Bailey JA, Yavor AM, Massa HF, Trask BJ, Eichler EE. Genome Res. 2001;11:1005–1017. doi: 10.1101/gr.187101. [DOI] [PMC free article] [PubMed] [Google Scholar]
- 23.Lam KG, Jeffreys AJ. Proc Natl Acad Sci USA. 2006;103:8921–8927. doi: 10.1073/pnas.0602690103. [DOI] [PMC free article] [PubMed] [Google Scholar]
- 24.Flores M, Mavingui P, Perret X, Broughton WJ, Romero D, Hernández G, Dávila G, Palacios R. Proc Natl Acad Sci USA. 2000;97:9138–9143. doi: 10.1073/pnas.97.16.9138. [DOI] [PMC free article] [PubMed] [Google Scholar]
- 25.Guo X, Flores M, Mavingui P, Fuentes SI, Hernández G, Dávila G, Palacios R. Genome Res. 2003;13:1810–1817. doi: 10.1101/gr.1260903. [DOI] [PMC free article] [PubMed] [Google Scholar]
- 26.International Human Genome Sequencing Consortium. Nature. 2004;431:931–945. doi: 10.1038/nature03001. [DOI] [PubMed] [Google Scholar]
- 27.Oesterreich S. J Cell Biochem. 2003;90:653–661. doi: 10.1002/jcb.10685. [DOI] [PubMed] [Google Scholar]
- 28.Pachucki J, Wang D, Christoph D, Miot F. Mol Cell Endocrinol. 2004;214:53–62. doi: 10.1016/j.mce.2003.11.026. [DOI] [PubMed] [Google Scholar]
- 29.Judo MS, Wedel AB, Wilson C. Nucleic Acids Res. 1998;26:1819–1825. doi: 10.1093/nar/26.7.1819. [DOI] [PMC free article] [PubMed] [Google Scholar]
- 30.Shakifhani S. Environ Microbiol. 2002;4:482–486. [Google Scholar]
- 31.Albertson DG. Trends Genet. 2006;22:448–455. doi: 10.1016/j.tig.2006.06.007. [DOI] [PubMed] [Google Scholar]
- 32.Repping S, van Daalen SK, Brown LG, Korver CM, Lange J, Marszalek JD, Pyntikova T, van der Veen F, Skaletsky H, Page DC, Page DC, et al. Nat Genet. 2007;38(4):463–467. doi: 10.1038/ng1754. [DOI] [PubMed] [Google Scholar]
- 33.Locke DP, Sharp AJ, McCarroll SA, McGrath SD, Newman TL, Cheng Z, Schwartz S, Albertson DG, Pinkel D, Altshuler DM, et al. Am J Hum Genet. 2006;79:275–290. doi: 10.1086/505653. [DOI] [PMC free article] [PubMed] [Google Scholar]
- 34.Kurtz S, Choudhuri JV, Ohlebusch E, Schleiermacher C, Stoyle J, Giegerich R. Nucleic Acids Res. 2001;29:4633–4642. doi: 10.1093/nar/29.22.4633. [DOI] [PMC free article] [PubMed] [Google Scholar]
- 35.Chenna R, Sugawara H, Koike T, Lopez R, Gibson TJ, Higgins DG, Thompson JD. Nucleic Acids Res. 2003;31:3497–3500. doi: 10.1093/nar/gkg500. [DOI] [PMC free article] [PubMed] [Google Scholar]
Associated Data
This section collects any data citations, data availability statements, or supplementary materials included in this article.
Supplementary Materials
Supporting Tables
