Bcl-2 decreases the free Ca2+ concentration within the endoplasmic reticulum (original) (raw)
Abstract
The antiapoptotic protein Bcl-2 localizes not only to mitochondria but also to the endoplasmic reticulum (ER). However, the function of Bcl-2 at the level of the ER is poorly understood. In this study, we have investigated the effects of Bcl-2 expression on Ca2+ storage and release by the ER. The expression of Bcl-2 decreased the amount of Ca2+ that could be released from intracellular stores, regardless of the mode of store depletion, the cell type, or the species from which Bcl-2 was derived. Bcl-2 also decreased cellular Ca2+ store content in the presence of mitochondrial inhibitors, suggesting that its effects were not mediated through mitochondrial Ca2+ uptake. Direct measurements with ER-targeted Ca2+-sensitive fluorescent “cameleon” proteins revealed that Bcl-2 decreased the free Ca2+ concentration within the lumen of the ER, [Ca2+]ER. Analysis of the kinetics of Ca2+ store depletion in response to the Ca2+-ATPase inhibitor thapsigargin revealed that Bcl-2 increased the permeability of the ER membrane. These results suggest that Bcl-2 decreases the free Ca2+ concentration within the ER lumen by increasing the Ca2+ permeability of the ER membrane. The increased ER Ca2+ permeability conferred by Bcl-2 would be compatible with an ion channel function of Bcl-2 at the level of the ER membrane.
The protooncogene Bcl-2 protects cells against apoptosis (1). Morphological and biochemical studies demonstrate that Bcl-2 has two major intracellular localizations (2–5): (i) mitochondria and (ii) the endoplasmic reticulum (ER). Mitochondria have received major attention as organelles involved in apoptosis. However, Bcl-2 not only prevents the mitochondrial permeability switch and the subsequent release of cytochrome c (6–8), but also inhibits apoptosis in response to microinjected cytochrome c (9, 10). This finding suggests that Bcl-2 inhibits apoptotic mechanisms downstream of cytochrome c, possibly at the level of the ER. Consistent with this hypothesis, a recent study demonstrated that ER-targeted Bcl-2 was able to inhibit apoptosis induced by Myc in a rat fibroblast cell line (11).
The ER plays a prominent role in intracellular Ca2+ homeostasis. It regulates not only the [Ca2+] within its lumen ([Ca2+]ER), but also the cytosolic [Ca2+] ([Ca2+]c) (12, 13) and the Ca2+ permeability of the plasma membrane (store-operated Ca2+ influx) (14, 15). The function of Bcl-2 at the ER is only poorly understood. However, several arguments point toward the possibility that Bcl-2 might alter ER ionic homeostasis: (i) the three-dimensional structure of Bcl-2-related proteins is reminiscent of pore-forming bacterial toxins (16, 17), (ii) Bcl-2 can function as an ion channel in artificial lipid bilayers (18–21), and (iii) alteration of cellular Ca2+ signaling by Bcl-2, compatible with altered ER Ca2+ homeostasis, has been reported in several studies (22–25).
In this study, we have investigated the effect of Bcl-2 on (i) the regulation of [Ca2+]c by ER Ca2+ stores and (ii) the Ca2+ concentration within the ER, [Ca2+]ER. Our studies demonstrate that Bcl-2 decreases [Ca2+]ER, possibly reflecting the insertion of Bcl-2 ion channels in the ER membrane.
Materials and Methods
Materials.
The monoclonal anti-human Bcl-2 (hBcl-2) Ab was from Santa Cruz Biotechnology, and polyclonal anti-hBcl-2 or anti-mouse Bcl-2 (mBcl-2) from Calbiochem. The enhanced chemiluminescence (ECL) detection system was purchased from Amersham Pharmacia. Transfast transfection reagent was purchased from Promega. All other chemicals were of analytical grade and were obtained from Sigma, Merck, Fluka, Molecular Probes, Dako, and Millipore.
Buffers.
The medium referred to as Ca2+ medium contained 143 mM NaCl, 6 mM KCl, 1 mM CaCl2, 1 mM MgSO4; 0.1% glucose, and 20 mM Hepes (pH 7.4). The Ca2+-free medium had the same ionic composition; however, CaCl2 was omitted and replaced with 0.1 mM EGTA. For ER Ca2+ measurements, a slightly different ionic composition was used: the Ca2+ medium contained 140 mM NaCl, 5.6 mM KCl, 1 mM MgCl2, 1 mM CaCl2, 11 mM glucose, and 10 mM Hepes (pH 7.4), and the Ca2+-free medium contained no CaCl2, but 0.5 mM EGTA. When DMSO was used as a drug solvent, the final concentration in the recording medium did not exceed 0.1%.
Bcl-2-Expressing Cell Lines.
Mouse lymphoma A20 cells, stably expressing hBcl-2/pMV12 plasmid or control vector pMV12 (26), and rat embryo R6 fibroblasts, expressing hBcl-2/pcDNA3 plasmid, mBcl-2/pMV12 plasmid or control vector pcDNA3 (27), were cultured as described.
Transient Transfection.
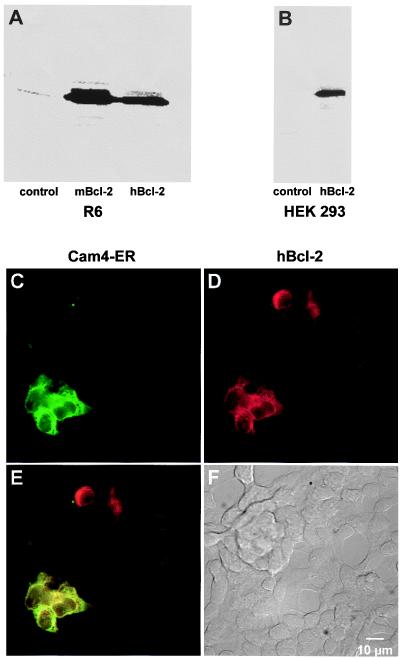
Human embryonic kidney (HEK)-293 cells (≈200,000) were plated on 25-mm glass coverslips and, after reaching 60% confluence, transiently transfected with the cDNA encoding Cam4-ER by using calcium phosphate for HEK cells and Transfast for R6 cells. The transient cotransfection was performed at 10:1 Bcl-2 to Cam4-ER ratio to ensure expression of Bcl-2 in the Cam4-ER-labeled cells. Under these conditions, the Bcl-2 protein was efficiently expressed (Fig. 1B) and, as expected from the 10:1 ratio, all Cam4-ER-expressing cells were positive for Bcl-2, as assessed by fluorescence imaging (Fig. 1 C–F). 47% of the hBcl-2-positive cells expressed Cam-4ER (n = 112).
Figure 1.
Western blot and immunofluorescence analysis of Bcl-2 expression in transfected cells. Western blot of control, mBcl-2, and hBcl-2-expressing R6 rat embryo fibroblasts (A) or HEK-293 cells (B). (C–F) Fluorescence imaging analysis of Bcl-2 expression in HEK-293 cells, transiently cotransfected with the hBcl-2 (or control vector) and with ER-targeted cameleon (Cam4-ER). (C) Cam4-ER fluorescence. (D) Bcl-2 immunofluorescence. (E) Pseudocolored and merged images of the cells (yellow = colocalization). (F) Differential interference contrast Nomarski image of the cells.
Immunoblotting and immunochemistry were performed according to standard methods (28, 29).
Measurement of [Ca2+]c in Intact Cells.
[Ca2+]c was measured with the fluorescent Ca2+ indicator fura-2 acetoxymethyl ester (fura2-AM) under conditions that minimize fura-2 compartmentalization as described by Mery et al. (28). Fura-2-loaded cells were kept in Ca2+ medium; before the fluorimetric measurement, an aliquot of 2 × 10⁶ cells was centrifuged for 1 min, resuspended in a Ca2+-free medium, and used immediately for the recording. The amount of cytosolic versus compartmentalized fura-2 was directly measured by exposing fura-2-loaded cells to 25 μM digitonin (which permeabilizes the plasma membrane, but not the membrane of intracellular organelles) and measuring the amount of digitonin-releasable fura-2. The fluorescence decrease in response to digitonin (i.e., the release of fura-2) as assessed by fluorescence imaging was 94.9 ± 2% and 94.7 ± 0.6% of total fluorescence in A20 control and A20-Bcl-2-expressing cells, respectively (n = 29).
[Ca2+ ]ER Measurements.
[Ca2+]ER was measured by dual-emission ratio imaging by using the ER-targeted “cameleon” fluorescent protein Cam-4ER, as described by Miyawaki et al. (30). Three to 4 days after transfection, coverslips were inserted into a superfusion chamber (Medical System, Greenvale, NY) equipped with gravity-feed inlets and vacuum outlet for solution changes. Cells were imaged at 37°C on a Zeiss axiovert S100 TV equipped for epifluorescence microscopy, by using a ×100, 1.3 NA oil-immersion objective (Zeiss), 430 ± 6 nm excitation (DeltaRam monochromator, Photon Technology International, Princeton), a 455DRLP dichroic mirror, and two emission filters (475DF15 and 535DF25, Omega Optical, Glen Spectra, Middlesex, U.K.) alternated by a filterwheel (Ludl Electronic Products, Hawthorn, NY). Images were acquired on a 12-bit, cooled charge-coupled device (CCD) interlined camera (Visicam, Visitron System, Puchheim, Germany) controlled by the Metamorph/Metafluor 3.5 software (Universal Imaging, West Chester, PA), and stored on optical disks (Fujitsu, Europe, Middlesex, U.K.) for later analysis and archiving. After background subtraction, the Cam-4ER fluorescence ratio R (535/475 nm) was calibrated in [Ca2+] by using the equation: [Ca2+] = K_′_d [(_R_ − (_R_min + 14/100 × (_R_max − _R_min))/(_R_max − _R_)](1/_n_), where _R_max = ratio obtained in presence of 10 μM ionomycin and 20 mM CaCl2, _R_min = ratio obtained in presence of 10 μM ionomycin and 20 mM EGTA, K_′_d = 292 μM, the apparent dissociation constant, and n = 0.60, the Hill coefficient of the fitted Ca2+ calibration curve. This curve was obtained in situ on HEK-293 cells expressing Cam-4-ER, permeabilized with ionomycin (10 μM) and digitonin (5 μg/ml) and incubated with different Ca2+-containing solutions buffered with 5 mM EGTA and 5 mM HEEDTA (_N_-hydroxyethyl-ethylendiamine triacetic acid) below 100 μM free Ca2+ calculated according to Bers et al. (31).
pH Measurements.
Cells were transfected and imaged as described above by using 480 ± 10 nm excitation, 535 ± 22.5 nm emission, and a 505DRLP dichroic mirror to selectively record at the pH-sensitive enhanced yellow fluorescent protein (EYFP) fluorescence of the cameleon molecule (32). Calibration was performed by using the K+/H+ ionophore nigericin (10 μM) in high KCl solutions buffered to pH 6.3 and 7.6 with 20 mM Mes or Hepes, respectively.
Results
It was the aim of this study to investigate the effect of the protooncogene Bcl-2 on the regulation of cellular Ca2+ homeostasis by ER-type Ca2+ stores. As cellular models we used (i) mouse B lymphoma cells A20, which were retrovirally transduced with hBcl-2; (ii) R6 rat embryo fibroblasts transduced retrovirally with mouse or stably transfected with hBcl-2; and (iii) HEK-293, transiently transfected with hBcl-2. Control cells were transduced or transfected with the empty vector (control). Bcl-2 was efficiently expressed in Bcl-2-transfected cells (but not in control cells) as shown by Western blotting of R6 cells and HEK-293 cells (Fig. 1 A and B), as well as A20 cells (J.T. and M. Schroter, unpublished observation).
Bcl-2 Reduces the Amount of Ca2+ That Can Be Released from Intracellular Stores.
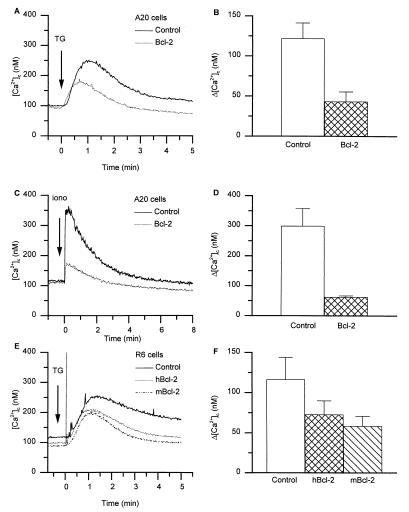
As a first approach to study the amount of Ca2+ contained within ER-type Ca2+ stores, we used thapsigargin (TG), an inhibitor of the ER Ca2+-ATPase (33, 34). As shown in Fig. 2, the addition of TG to control A20 cells in a Ca2+-free medium led to an increase in [Ca2+]c, reflecting the release of Ca2+ from the ER. In Bcl-2-transfected cells, the amplitude of the TG-induced Ca2+ release was markedly reduced (Fig. 2A). Similarly, as shown in Fig. 2 C and D, [Ca2+]c elevations in response to ionomycin were markedly diminished in Bcl-2-transfected cells compared with control cells. Thus, our results clearly demonstrate reduced [Ca2+]c elevations in response to Ca2+-mobilizing agonists in Bcl-2-expressing cells. However, there are contradictory results in the literature (see also Introduction and Discussion). We therefore investigated whether our observations also apply to other cell types and to Bcl-2 derived from other species. Similar to the observations in A20 cells, TG-induced Ca2+ release from R6 cells (rat embryo fibroblasts) was markedly reduced through the expression of either hBcl-2 or mBcl-2 (Fig. 2 E and F). Thus, the Bcl-2-induced reduction of Ca2+ store content can be observed in different cell lines and with Bcl-2 from different species.
Figure 2.
Bcl-2 reduces the amount of releasable Ca2+ from intracellular stores. (A) [Ca2+]c trace in control and Bcl-2-expressing A20 cells in response to 100 nM TG. (B) Peak [Ca2+]c increase in response to 100 nM TG in control and Bcl-2-expressing A20 cells. (C) [Ca2+]c trace in control and Bcl-2-expressing A20 cells in response to 100 nM ionomycin. (D) Peak [Ca2+]c increase in response to 100 nM ionomycin in control and Bcl-2-expressing A20 cells. (E) [Ca2+]c traces in control R6 cells and R6 cells expressing hBcl-2 or mBcl-2, in response to 100 nM TG. (F) Peak Ca2+ increase in response to 100 nM TG in control R6 cells and R6 cells expressing hBcl-2 or mBcl-2 (the initial short-lasting upstroke seen in R6-hBcl-2 cells is pipetting artifact). Data shown in B, D, and F are mean ± SEM from four independent experiments.
Bcl-2 Decreases the Free Ca2+ Concentration Within the ER.
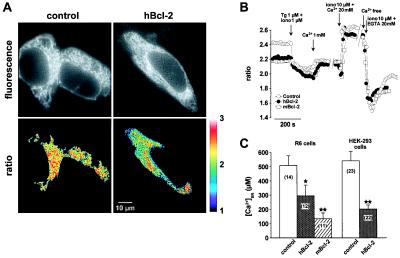
We next investigated the free Ca2+ concentration within the ER ([Ca2+]ER) in control and Bcl-2-transfected cells. To measure [Ca2+]ER, we transiently transfected cells with an ER-targeted Ca2+-sensitive fluorescent protein cameleon (30). We studied [Ca2+]ER in R6 stably expressing hBcl-2 and mBcl-2 (we were not able to obtain satisfactory expression of cameleon in A20 cells). To exclude that the observed effects were a reaction to long-term expression of Bcl-2 in a cell line, rather than an acute effect of Bcl-2, we also performed transient transfection experiments. For this purpose, we cotransfected HEK-293 cells with Bcl-2 and ER-targeted cameleon. As shown in Fig. 3C, the effect of Bcl-2 was identical in transiently and in stably transfected cells; namely, there was a marked decrease in [Ca2+]ER.
Figure 3.
Bcl-2 reduces the free Ca2+ concentration within the ER. (A) Measurements using ER-targeted cameleon. (Upper) Single wavelength cameleon fluorescence (emission 535 nm) of control and hBcl-2-expressing HEK-293 cells, showing the reticular pattern typical of the ER. (Lower) Corresponding emission ratio images of the same cells (535/475 nm), thresholded to extract the region of interest that were spatially averaged to yield [Ca2+]ER values. (B) Time course of spatially averaged Cam4-ER ratio fluorescence in control R6 cells, and R6 cells expressing hBcl-2 or mBcl-2. Cells were incubated in Ca2+-free medium and stimulated with TG (1 μM) and ionomycin (iono) (1 μM) to completely deplete intracellular Ca2+ stores. The calibration procedure systematically performed at the end of each experiment is shown to illustrate the dynamic range (_R_max/_R_min) of the probe. (C) Basal [Ca2+]ER values (mean ± SEM) in control R6 cells versus hBcl-2 and mBcl-2 stable transfectants, as well as in control and Bcl-2-transfected HEK-293 cells. Measurements of [Ca2+]ER were made 3–4 days after transfection with Cam4-ER (R6 cells) or Cam4-ER plus Bcl-2 or control vector (HEK-293 cells). Results are derived from three independent experiments. *, P < 0.05; **, P < 0.0002.
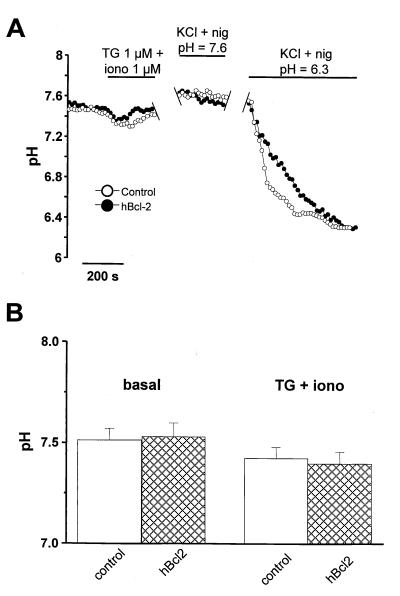
Fig. 3A shows images from cameleon-expressing HEK-293 cells. The two upper panels show single wavelength recording to document the subcellular localization of cameleon: as expected for ER-targeted cameleon, a fluorescence pattern typical for an ER localization was observed in both control and Bcl-2-transfected cells. The two lower panels show ratiometric recordings to measure the [Ca2+]ER. The pseudocolor representation demonstrates the lower [Ca2+]ER in the Bcl-2-expressing cells. Note also the marked decrease of fluorescence ratio in the region of the nuclear envelope. Fig. 3B shows time resolved measurements of [Ca2+]ER in R6 cells incubated in calcium-free medium and stimulated with TG (1 μM) and ionomycin (1 μM) to completely deplete intracellular Ca2+ stores. The cameleon fluorescence ratio was markedly lower in R6 cells expressing hBcl-2 or mBcl-2, as compared with control cells. Note, however, that the residual fluorescence level after complete depletion of ER-type Ca2+ stores by TG and ionomycin were comparable in all three cell lines, confirming that the difference in fluorescence ratio was indeed caused by a different [Ca2+]ER. The difference was not because of a nonspecific alteration in cameleon fluorescence, as the dynamic range of the signals (_R_max/_R_min, measured at steady-state to allow equilibration of the pH gradients, see below) were comparable in control and Bcl-2 overexpressors (Fig. 3B). However, a pH difference could possibly account for part of the observed effect, as the Cam4-ER used in this study belongs to the first generation of cameleon probes designed with a pH-sensitive EYFP (S65G/S72A/T203Y) (32). Indeed, pH effects were evident during calibration with EGTA as Ca2+/H+ exchange by ionomycin caused a transient drop in fluorescence ratio (Fig. 3B). Because Bcl-2 has been reported to alter or regulate proton fluxes in mitochondria (35), a lower ER pH could explain the lower ratio observed in Bcl-2 overexpressors. To investigate this possibility, we exploited the pH sensitivity of the cameleons to measure ER pH, by directly monitoring the EYFP fluorescence of Cam4-ER (480-nm excitation, 535-nm emission). In this condition, Ca2+-dependent fluorescence resonance energy transfer does not occur and the probe reports pH instead of Ca2+ changes. Accordingly, large fluorescence changes were observed on exposure of cells to NH4Cl (data not shown) or to the H+/K+ ionophore nigericin (Fig. 4A), confirming that the probe adequately reported organellar pH. Fig. 4 shows that the pH of the ER was similar in control and hBcl-2 overexpressing cells, both under basal conditions and after depletion with TG and ionomycin. Indeed, although exchange of luminal Ca2+ for external H+ by ionomycin caused a slight acidification of the ER, no significant difference in ER pH was observed between control and Bcl-2 overexpressing cells that could account for the differences observed in Ca2+ measurements (Fig. 4 A and B). Thus, the expression of either hBcl-2 or mBcl-2 lowers the free Ca2+ concentration within the ER.
Figure 4.
Bcl-2 overexpression does not affect the pH of the ER. ER pH was measured by directly exciting at 480 nm the pH-dependent EYFP contained within the cameleon probe and measuring its fluorescence emission at 535 nm. HEK-293 cells cotransfected with Cam4-ER and hBcl-2 or control vector were used. (A) Time-course experiment showing the effect of TG and ionomycin (iono) on ER pH and the subsequent calibration with 130 mM KCl + 10 μM nigericin (nig) at pH 7.6 and 6.3. (B) pH values measured in the ER of control and hBcl-2 overexpressing cells, in basal condition and after store depletion with TG (1 μM) and ionomycin (1 μM). Data are mean ± SEM (n = 5) from two independent experiments in each condition.
The Bcl-2-Induced Decrease in [Ca2+]ER Is Not Secondary to an Increased Mitochondrial Ca2+ Uptake.
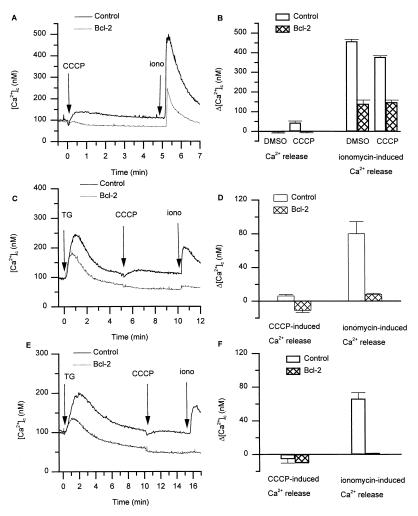
An increased Ca2+ pumping by mitochondria might account for a decreased ER Ca2+ content. We therefore investigated the effect of the mitochondrial inhibitor carbonyl cyanide _m_-chlorophenylhydrazone (CCCP). Fig. 5 A and B show experiments investigating the effect of CCCP in control and Bcl-2-expressing A20 cells loaded with fura-2. In control cells, the addition of CCCP induced a small, but reproducible, Ca2+ release. In Bcl-2-expressing cells, there was clearly no Ca2+ release in response to CCCP, ruling out an increased mitochondrial Ca2+ uptake in Bcl-2-expressing cells. To investigate whether the inhibition of mitochondrial Ca2+ uptake led to changes in the content of ER-type Ca2+ stores, we added ionomycin 5 min after CCCP. The decreased amount of intracellularly stored Ca2+ in Bcl-2-expressing cells was also observed in cells pretreated with mitochondrial inhibitor. Thus, mitochondrial Ca2+ uptake does not account for the decreased Ca2+ store content in Bcl-2-expressing cells.
Figure 5.
Mitochondria and TG-insensitive Ca2+ pools in Bcl-2-expressing cells. (A) Typical [Ca2+]c traces of cells sequentially exposed to the mitochondrial inhibitor CCCP (1 μM) followed by ionomycin (iono) (100 nM). (B) Peak [Ca2+]c after addition of CCCP or solvent control (left bars) and after subsequent addition of ionomycin (right bars); mean ± SEM of three independent experiments. (C and E) Typical [Ca2+]c trace in cells sequentially exposed to TG (100 nM) for 0 min, CCCP (1 μM) for 5 min or 10 min, and ionomycin (100 nM) at 10 min or 15 min. (D and F) Peak [Ca2+]c after addition of CCCP (left bars) and after subsequent addition of ionomycin (right bars) to cells previously exposed to TG at t = 0. The time between TG and ionomycin addition was 5 min or 10 min for D and F, respectively.
To further analyze the influence of Bcl-2 on the intracellular Ca2+ distribution, we measured the [Ca2+]c changes during sequential additions of TG, CCCP, and ionomycin (Fig. 5). The results showed that TG-induced Ca2+ release was markedly reduced in Bcl-2-expressing cells. These results are similar to the effect described above with CCCP alone. The effect of CCCP was similar (although of slightly lower amplitude) after TG addition (Fig. 5 C and E) as compared with the addition of CCCP alone (Fig. 5A). Interestingly, the amount of ionomycin-releasable Ca2+ in Bcl-2-expressing cells was reduced even after addition of TG and CCCP, i.e., after depletion of typical ER-type Ca2+ stores and mitochondrial Ca2+ stores (Fig. 5 C and E). Thus, the Bcl-2-induced decrease in Ca2+ content was not restricted to compartments which are loaded by sarco/ER Ca2+-ATPases (SERCA)-type Ca2+ pumps. Note that this observation makes it unlikely that an alteration of SERCA pumps is the mechanism of Bcl-2-induced decrease in Ca2+ store content.
Bcl-2 Enhances the Ca2+ Permeability of the ER.
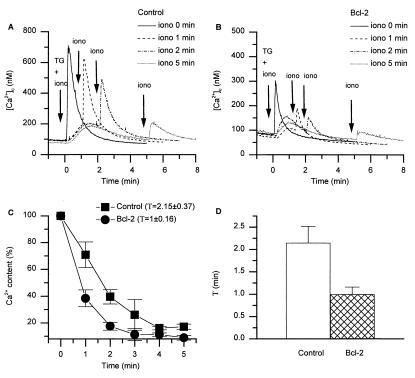
To study the Ca2+ permeability of the ER membrane, we analyzed the kinetics of TG-induced Ca2+ store-depletion. For this purpose, ionomycin was added at defined time intervals after TG addition, and the [Ca2+]c increase was compared with the response obtained with concomitant addition of TG and ionomycin (= 100% Ca2+ store content). As expected from the results of Fig. 2, the total amount of Ca2+ released in response to the concomitant addition of TG and ionomycin was decreased in Bcl-2-transfected cells. More importantly, however, the kinetic of Ca2+ release was markedly accelerated in Bcl-2-transfected cells (Fig. 6C): 1 min after TG addition, 60% of the total amount of Ca2+ was released in Bcl-2-transfected cells, whereas only 30% was released in control cells. A monoexponential fit to the data of Fig. 6C revealed that the time constant of TG-induced Ca2+ release was two times faster in Bcl-2-expressing cells (Fig. 6D). Thus, Bcl-2 expression increases the Ca2+ permeability of the ER membrane.
Figure 6.
Bcl-2 increases the permeability of ER-type Ca2+ stores. TG (100 nM) was added at time 0 min, and ionomycin (iono; 10 μM) was added either concomitantly with TG, or at later time points (1 min, 2 min, 3 min, 4, min, 5 min). (A and B) Typical experiments showing [Ca2+]c elevations in control and Bcl-2-transfected cells, respectively; four traces with ionomycin addition at different time points are superimposed to facilitate comparison. (C) Ionomycin-releasable Ca2+ (expressed as % of the initial peak [Ca2+]c) is plotted as a function of time after TG addition. (D) Time constant (τ) of Ca2+ store depletion, calculated for control and Bcl-2-transfected cells by fitting a mono-exponential decay function to the data of C. Results shown in C and D are mean ± SEM of four independent experiments.
Bcl-2 Enhances Unstimulated Ca2+ Influx and Elevates Basal Ca2+ Concentration.
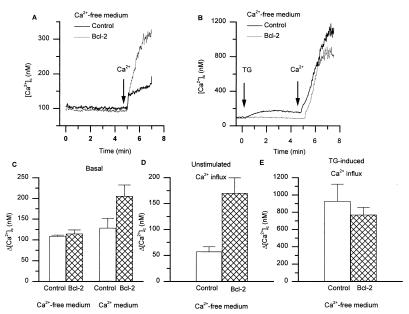
Store-operated Ca2+ influx is activated through a decrease in [Ca2+]ER. We therefore reasoned that Bcl-2 might lead to an enhanced Ca2+ influx, independently of activation of cell surface receptors. Indeed, when Bcl-2-expressing A20 cells were incubated in a Ca2+-free medium and subsequently Ca2+ was added, a relatively large Ca2+ influx could be detected (170 ± 29.6 nM increase), whereas only a small background influx (57.3 ± 9.2 nM increase) was seen in control cells (Fig. 7 A and D). This unstimulated Ca2+ influx in Bcl-2-transfected cells is most likely caused by the Bcl-2-induced store-depletion and thus to store-operated Ca2+ influx. Consistent with this concept, there was no additivity between TG and Bcl-2: TG-induced Ca2+ influx (i.e., maximal store-operated Ca2+ influx) (Fig. 7 B and E). Actually, there was a small, but consistent, decrease in TG-induced Ca2+ influx in Bcl-2-expressing cells. The enhanced Ca2+ influx in unstimulated cells should have as a consequence an increased basal [Ca2+]c when cells are kept in a Ca2+-containing medium. And indeed, when cells were kept under steady-state conditions in a Ca2+-containing medium, the average cytosolic-free Ca2+ concentration was higher in Bcl-2-expressing cells than in control cells (Fig. 7C).
Figure 7.
Bcl-2 increases unstimulated Ca2+ influx and basal [Ca2+]c. (A and B) Cells were suspended in a Ca2+-free medium, and 1 mM Ca2+ was added to the medium after 5-min baseline recording. (A) Typical experiments showing [Ca2+]c elevations in control and Bcl-2-transfected cells without cellular stimulation. (B) Typical experiments showing [Ca2+]c elevations in control and Bcl-2-transfected cells after TG stimulation. (C) Basal [Ca2+]c of cells maintained in Ca2+-free medium or in Ca2+-containing medium; mean ± SEM of four independent experiments. (D) Statistical analysis of experiments as shown in A. (E) Statistical analysis of experiments as shown in B.
Discussion
In this study, we analyzed the effect of the antiapoptotic protein Bcl-2 on ER-type Ca2+ stores. We demonstrate that Bcl-2 decreases the free Ca2+ concentration within the ER through a mechanism that involves an increased permeability of the ER membrane. This effect of Bcl-2 appears to be a general feature, as it is observed in different cell types and with Bcl-2 from different species.
Mechanisms of Bcl-2-Induced Decrease in [Ca2+]ER.
Our results suggest that an increase in the ER Ca2+ store permeability mediates the decrease in [Ca2+]ER. Two mechanisms might account for this increased Ca2+ permeability of the ER membrane: (i) an increase in number or activity of preexistent ER Ca2+ channels (in particular Ins(1,4,5)_P_3 receptor), or (ii) a formation of an ER conductance by Bcl-2. Bcl-2 clearly is an ion channel (21, 22). For this reason we favor the hypothesis that the increased ER conductance is directly due to the Bcl-2 channel. However, although presently available data suggest that the Bcl-2 channel is selective for cations over anions (in particular K+ over Cl−; ref. 21), it is not clear to which extent the channel conducts divalent cations. Thus, the alternative possibility of a Bcl-2 activation of an endogenous Ca2+ conductance should also be considered.
Relationship Between This Study and Previous Results_._
When reviewing the literature concerning the observed effects of Bcl-2 on Ca2+ signaling, we realized considerable discrepancies and contradictions (22–25, 36–38). Note however that all these studies have indirectly deduced [Ca2+]ER from [Ca2+]c measurements. Thus, only direct measurements of [Ca2+]ER provide reliable information about the Ca2+ content of the ER.
[Ca2+ ]ER and Apoptosis: What Is the Connection?
The Ca2+ ion is one of the most important and versatile intracellular messengers in eukaryotic cells. [Ca2+]c elevations may not only activate a variety of cellular functions, but may also induce apoptosis or, paradoxically, even prevent apoptosis (reviewed in the introduction of ref. 39). A biphasic mechanism, where moderate [Ca2+]c elevations are antiapoptotic (40), but excessive [Ca2+]c elevations are proapoptotic represents a reasonable working hypothesis at this point. [Ca2+]ER also plays a complex role in the regulation of various cellular functions, from the regulation of store-operated Ca2+ influx (41), to the regulation of ER protein folding and chaperone interaction (42), gene expression (43–45), and regulation of nuclear pore opening (46). Concerning the role of [Ca2+]ER in the regulation of apoptosis, an apparent paradox, similar to the one observed with [Ca2+]c, exists. TG-induced massive Ca2+ store depletion may induce cell death (47). However, recent results suggest that Ca2+ stored within the ER may also be the cause of apoptosis, as it is the source for Ins(1,4,5)_P_3-dependent Ca2+ spikes which lead to Ca2+-dependent activation of the mitochondrial transition pore (39). A moderate decrease in [Ca2+]ER, as observed in response to Bcl-2 expression, would therefore be expected to have an antiapoptotic effect. Thus, the Bcl-2-induced lowering of [Ca2+]ER might decrease directly the Ca2+ activation of the mitochondrial transition pore. However, as [Ca2+]ER has many distinct cellular effects (see above), other explanations have to be considered, such as alterations of nuclear import, protein folding, or gene expression. Finally, given the known antiapoptotic effects of moderate [Ca2+]c elevations (40) and store-operated Ca2+ influx (48, 49), the Bcl-2-induced increase in unstimulated Ca2+ influx and elevation of basal [Ca2+]c (Fig. 7) are good candidates to be involved in its antiapoptotic activity.
Acknowledgments
We thank Dr. R. Y. Tsien for kindly providing us with Cam4-ER, Dr. Reynald Olivier for helpful advice, and Antoinette Monod and Cyril Castelbou for technical assistance. We thank also Dr. Pierre Maechler for kindly providing us with the anti-hBcl-2 Ab. This work was supported by Swiss National Foundation Grant 31-55344.98 and the Swiss Cancer League Grant.
Abbreviations
ER
endoplasmic reticulum
[Ca2+]c
cytosolic free Ca2+ concentration
[Ca2+]ER
ER (intralumenal) free Ca2+ concentration
CCCP
carbonyl cyanide _m_-chlorophenylhydrazone
fura-2-AM
fura-2 acetoxymethyl ester
EYFP
enhanced yellow fluorescent protein
hBcl-2
human Bcl-2
mBcl-2
mouse Bcl-2
TG
thapsigargin
HEK
human embryonic kidney
Note Added in Proof
A recent publication using ER-targeted aequorin also concludes that Bcl-2 decreases [Ca2+]ER.
Footnotes
This paper was submitted directly (Track II) to the PNAS office.
References
- 1.Tsujimoto Y, Croce C M. Proc Natl Acad Sci USA. 1986;83:5214–5218. doi: 10.1073/pnas.83.14.5214. [DOI] [PMC free article] [PubMed] [Google Scholar]
- 2.Monaghan P, Robertson D, Amos T A, Dyer M J, Mason D Y, Greaves M F. J Histochem Cytochem. 1992;40:1819–1825. doi: 10.1177/40.12.1453000. [DOI] [PubMed] [Google Scholar]
- 3.Jacobson M D, Burne J F, King M P, Miyashita T, Reed J C, Raff M C. Nature (London) 1993;361:365–369. doi: 10.1038/361365a0. [DOI] [PubMed] [Google Scholar]
- 4.Krajewski S, Tanaka S, Takayama S, Schibler M J, Fenton W, Reed J C. Cancer Res. 1993;53:4701–4714. [PubMed] [Google Scholar]
- 5.Hockenbery D, Nunez G, Milliman C, Schreiber R D, Korsmeyer S J. Nature (London) 1990;348:334–336. doi: 10.1038/348334a0. [DOI] [PubMed] [Google Scholar]
- 6.Yang J, Liu X, Bhalla K, Kim C N, Ibrado A M, Cai J, Peng T I, Jones D P, Wang X. Science. 1997;275:1129–1132. doi: 10.1126/science.275.5303.1129. [DOI] [PubMed] [Google Scholar]
- 7.Kluck R M, Bossy-Wetzel E, Green D R, Newmeyer D D. Science. 1997;275:1132–1136. doi: 10.1126/science.275.5303.1132. [DOI] [PubMed] [Google Scholar]
- 8.Liu X, Kim C N, Yang J, Jemmerson R, Wang X. Cell. 1996;86:147–157. doi: 10.1016/s0092-8674(00)80085-9. [DOI] [PubMed] [Google Scholar]
- 9.Zhivotovsky B, Orrenius S, Brustugun O T, Doskeland S O. Nature (London) 1998;391:449–450. doi: 10.1038/35060. [DOI] [PubMed] [Google Scholar]
- 10.Brustugun O T, Fladmark K E, Doskeland S O, Orrenius S, Zhivotovsky B. Cell Death Differ. 1998;5:660–668. doi: 10.1038/sj.cdd.4400399. [DOI] [PubMed] [Google Scholar]
- 11.Lee S T, Hoeflich K P, Wasfy G W, Woodgett J R, Leber B, Andrews D W, Hedley D W, Penn L Z. Oncogene. 1999;18:3520–3528. doi: 10.1038/sj.onc.1202716. [DOI] [PubMed] [Google Scholar]
- 12.Pozzan T, Rizzuto R, Volpe P, Meldolesi J. Physiol Rev. 1994;74:595–636. doi: 10.1152/physrev.1994.74.3.595. [DOI] [PubMed] [Google Scholar]
- 13.Meldolesi J, Pozzan T. Trends Biochem Sci. 1998;23:10–14. doi: 10.1016/s0968-0004(97)01143-2. [DOI] [PubMed] [Google Scholar]
- 14.Berridge M J. Biochem J. 1995;312:1–11. doi: 10.1042/bj3120001. [DOI] [PMC free article] [PubMed] [Google Scholar]
- 15.Parekh A B, Penner R. Physiol Rev. 1997;77:901–930. doi: 10.1152/physrev.1997.77.4.901. [DOI] [PubMed] [Google Scholar]
- 16.Muchmore S W, Sattler M, Liang H, Meadows R P, Harlan J E, Yoon H S, Nettesheim D, Chang B S, Thompson C B, et al. Nature (London) 1996;381:335–341. doi: 10.1038/381335a0. [DOI] [PubMed] [Google Scholar]
- 17.Schendel S L, Montal M, Reed J C. Cell Death Differ. 1998;5:372–380. doi: 10.1038/sj.cdd.4400365. [DOI] [PubMed] [Google Scholar]
- 18.Schendel S L, Xie Z, Montal M O, Matsuyama S, Montal M, Reed J C. Proc Natl Acad Sci USA. 1997;94:5113–5118. doi: 10.1073/pnas.94.10.5113. [DOI] [PMC free article] [PubMed] [Google Scholar]
- 19.Schlesinger P H, Gross A, Yin X M, Yamamoto K, Saito M, Waksman G, Korsmeyer S J. Proc Natl Acad Sci USA. 1997;94:11357–11362. doi: 10.1073/pnas.94.21.11357. [DOI] [PMC free article] [PubMed] [Google Scholar]
- 20.Minn A J, Velez P, Schendel S L, Liang H, Muchmore S W, Fesik S W, Fill M, Thompson C B. Nature (London) 1997;385:353–357. doi: 10.1038/385353a0. [DOI] [PubMed] [Google Scholar]
- 21.Antonsson B, Conti F, Ciavatta A, Montessuit S, Lewis S, Martinou I, Bernasconi L, Bernard A, Mermod J J, Mazzei G, et al. Science. 1997;277:370–372. doi: 10.1126/science.277.5324.370. [DOI] [PubMed] [Google Scholar]
- 22.Distelhorst C W, McCormick T S. Cell Calcium. 1996;19:473–483. doi: 10.1016/s0143-4160(96)90056-1. [DOI] [PubMed] [Google Scholar]
- 23.Lam M, Dubyak G, Chen L, Nunez G, Miesfeld R L, Distelhorst C W. Proc Natl Acad Sci USA. 1994;91:6569–6573. doi: 10.1073/pnas.91.14.6569. [DOI] [PMC free article] [PubMed] [Google Scholar]
- 24.He H, Lam M, McCormick T S, Distelhorst C W. J Cell Biol. 1997;138:1219–1228. doi: 10.1083/jcb.138.6.1219. [DOI] [PMC free article] [PubMed] [Google Scholar]
- 25.Baffy G, Miyashita T, Williamson J R, Reed J C. J Biol Chem. 1993;268:6511–6519. [PubMed] [Google Scholar]
- 26.Schroter M, Lowin B, Borner C, Tschopp J. Eur J Immunol. 1995;25:3509–3513. doi: 10.1002/eji.1830251245. [DOI] [PubMed] [Google Scholar]
- 27.Otter I, Conus S, Ravn U, Rager M, Olivier R, Monney L, Fabbro D, Borner C. J Biol Chem. 1998;273:6110–6120. doi: 10.1074/jbc.273.11.6110. [DOI] [PubMed] [Google Scholar]
- 28.Mery L, Mesaeli N, Michalak M, Opas M, Lew D P, Krause K H. J Biol Chem. 1996;271:9332–9339. doi: 10.1074/jbc.271.16.9332. [DOI] [PubMed] [Google Scholar]
- 29.Stendahl O, Krause K H, Krischer J, Jerstrom P, Theler J M, Clark R A, Carpentier J L, Lew D P. Science. 1994;265:1439–1441. doi: 10.1126/science.8073285. [DOI] [PubMed] [Google Scholar]
- 30.Miyawaki A, Llopis J, Heim R, McCaffery J M, Adams J A, Ikura M, Tsien R Y. Nature (London) 1997;388:882–887. doi: 10.1038/42264. [DOI] [PubMed] [Google Scholar]
- 31.Bers D M, Patton C W, Nuccitelli R. Methods Cell Biol. 1994;40:3–29. doi: 10.1016/s0091-679x(08)61108-5. [DOI] [PubMed] [Google Scholar]
- 32.Miyawaki A, Griesbeck O, Heim R, Tsien R Y. Proc Natl Acad Sci USA. 1999;96:2135–2140. doi: 10.1073/pnas.96.5.2135. [DOI] [PMC free article] [PubMed] [Google Scholar]
- 33.Thastrup O, Cullen P J, Drobak B K, Hanley M R, Dawson A P. Proc Natl Acad Sci USA. 1990;87:2466–2470. doi: 10.1073/pnas.87.7.2466. [DOI] [PMC free article] [PubMed] [Google Scholar]
- 34.Bian J H, Ghosh T K, Wang J C, Gill D L. J Biol Chem. 1991;266:8801–8806. [PubMed] [Google Scholar]
- 35.Shimizu S, Eguchi Y, Kamiike W, Funahashi Y, Mignon A, Lacronique V, Matsuda H, Tsujimoto Y. Proc Natl Acad Sci USA. 1998;95:1455–1459. doi: 10.1073/pnas.95.4.1455. [DOI] [PMC free article] [PubMed] [Google Scholar]
- 36.Bian X, Hughes F M J, Huang Y, Cidlowski J A, Putney J W J. Am J Physiol. 1997;272:C1241–C1249. doi: 10.1152/ajpcell.1997.272.4.C1241. [DOI] [PubMed] [Google Scholar]
- 37.Wei H, Wei W, Bredesen D E, Perry D C. J Neurochem. 1998;70:2305–2314. doi: 10.1046/j.1471-4159.1998.70062305.x. [DOI] [PubMed] [Google Scholar]
- 38.Kuo T H, Kim H R, Zhu L, Yu Y, Lin H M, Tsang W. Oncogene. 1998;17:1903–1910. doi: 10.1038/sj.onc.1202110. [DOI] [PubMed] [Google Scholar]
- 39.Szalai G, Krishnamurthy R, Hajnoczky G. EMBO J. 1999;18:6349–6361. doi: 10.1093/emboj/18.22.6349. [DOI] [PMC free article] [PubMed] [Google Scholar]
- 40.Yano S, Tokumitsu H, Soderling T R. Nature (London) 1998;396:584–587. doi: 10.1038/25147. [DOI] [PubMed] [Google Scholar]
- 41.Putney J W J. Cell Calcium. 1990;11:611–624. doi: 10.1016/0143-4160(90)90016-n. [DOI] [PubMed] [Google Scholar]
- 42.Corbett E F, Oikawa K, Francois P, Tessier D C, Kay C, Bergeron J J, Thomas D Y, Krause K H, Michalak M. J Biol Chem. 1999;274:6203–6211. doi: 10.1074/jbc.274.10.6203. [DOI] [PubMed] [Google Scholar]
- 43.Dedhar S. Trends Biochem Sci. 1994;19:269–271. doi: 10.1016/0968-0004(94)90001-9. [DOI] [PubMed] [Google Scholar]
- 44.Burns K, Duggan B, Atkinson E A, Famulski K S, Nemer M, Bleackley R C, Michalak M. Nature (London) 1994;367:476–480. doi: 10.1038/367476a0. [DOI] [PubMed] [Google Scholar]
- 45.Hardingham G E, Chawla S, Johnson C M, Bading H. Nature (London) 1997;385:260–265. doi: 10.1038/385260a0. [DOI] [PubMed] [Google Scholar]
- 46.Perez-Terzic C, Jaconi M, Clapham D E. BioEssays. 1997;19:787–792. doi: 10.1002/bies.950190908. [DOI] [PubMed] [Google Scholar]
- 47.Zhou Y P, Teng D, Dralyuk F, Ostrega D, Roe M W, Philipson L, Polonsky K S. J Clin Invest. 1998;101:1623–1632. doi: 10.1172/JCI1245. [DOI] [PMC free article] [PubMed] [Google Scholar]
- 48.Kass G E, Orrenius S. Environ Health Perspect. 1999;107, Suppl. 1:25–35. doi: 10.1289/ehp.99107s125. [DOI] [PMC free article] [PubMed] [Google Scholar]
- 49.Franklin J L, Johnson E M J. Trends Neurosci. 1992;15:501–508. doi: 10.1016/0166-2236(92)90103-f. [DOI] [PubMed] [Google Scholar]
- 50.Pinton P, Ferrari D, Magalhaes P, Schulze-Osthoff K, DiVirgilio F, Pozzan T, Rizzuto R. J Cell Biol. 2000;148:857–862. doi: 10.1083/jcb.148.5.857. [DOI] [PMC free article] [PubMed] [Google Scholar]
