Expresson of Vascular Endothelial Growth Factor, Its Receptors (FLT-1, KDR) and TSP-1 Related to Microvessel Density and Patient Outcome in Vertical Growth Phase Melanomas (original) (raw)
Abstract
Microvessel density (MVD) was estimated in a series of 202 vertical growth phase (VPG) melanomas and 68 corresponding metastases, using a marker for angiogenic endothelial cells (CD105) and Factor-VIII. The expression pattern of vascular endothelial growth factor (VEGF), FLT-1, KDR and thrombospondin-1 (TSP-1) was studied by immunohistochemistry, in situ hybridization and reverse-transcriptase polymerase chain reaction. CD105 stained significantly less vessels, but gave only limited additional prognostic information compared with Factor-VIII, and MVD was an independent prognostic factor for both markers. Ninety-eight percent of all cases showed expression of VEGF, and higher expression was found significantly more frequent in thinner and less vascularized tumors. Possible autocrine loops were suggested by co-expression of VEGF and its two receptors in tumor cells, and by a significant correlation between KDR and tumor cell proliferation (Ki-67) in the subgroup of thicker tumors. Staining of VEGF receptors in endothelium was not correlated with MVD. Strong expression of TSP-1 in tumor stroma was found in 43% of the primary tumors, and was significantly correlated with increased thickness, proliferation and MVD, as well as decreased survival. These data suggest that MVD is associated with prognosis in cutaneous melanomas, and that the VEGF system and particularly TSP-1 seem to be involved in the regulation of angiogenesis and progression of these tumors.
The ability of tumors to stimulate endothelial cell growth and differentiation is widely accepted to be of critical importance for progression and metastasis in most tumor types. 1 Microvessel density (MVD), a commonly applied estimate of tumor angiogenesis, is an established prognostic factor in several malignancies, eg, breast cancer, 2 endometrial cancer, 3 and prostate cancer. 4 However, the reports published on prognostic significance of MVD in malignant melanoma are contradictory, 5-12 although survival studies are few. In a previous study, we found a significant prognostic impact of MVD in univariate survival analysis of vertical growth phase melanomas. 13
Because tumor angiogenesis is considered to be of clinical and therapeutic importance, much effort has been taken to describe new angiogenic stimulators and inhibitors. Vascular endothelial growth factor (VEGF) might have a fundamental role in tumor vessel formation, 14 and VEGF expression has been associated with increased angiogenesis in both clinical 15-18 and experimental studies. 19 In addition, recent findings by Detmar and colleagues 20 demonstrate that VEGF overexpression might induce tumor invasiveness in addition to promotion of angiogenesis and tumor growth. In melanocytic tumors, VEGF expression was increased with malignant progression, 11,21,22 although significant associations with increased MVD has not been found.
Alternative exon splicing of the VEGF gene results in at least 5 different isoforms, having 121, 145, 165, 189 and 206 amino acids, respectively. 23 These isoforms differ in heparin binding and diffusibility, 14 and recent studies of different tumors report increased angiogenic potential and negative prognostic impact for the partially cell-retained isoforms (VEGF 165 and 189). 24-27
The FLT-1 and KDR proteins have been identified as VEGF receptors, and are thought to be restricted largely to the vascular endothelium. 14,28,29 Quite recently though, these receptors have been found in ovarian carcinoma cells, 30 melanoma cells, 31-33 thyroid tumors, 34 and breast carcinomas. 35 Although the biological relevance of VEGF receptor expression on tumor cells is not clear, one study found that VEGF increased the proliferation of KDR positive melanoma cells in vitro, 36 whereas others described an inhibitory effect of VEGF on FLT-1 positive tumor cells. 37
Thrombospondin-1 (TSP-1), an extracellular matrix glycoprotein, 38 has been associated with both a supportive 39-41 and inhibitory 42,43 role in tumor invasiveness and progression. Several experimental and clinical studies have provided evidence for an inhibitory role of TSP-1 on tumor angiogenesis, 44-49 and TSP-1 expression has been associated with improved survival in studies of colon 48 and bladder cancer. 45 Furthermore, recent studies have shown that TSP-1 might modulate angiogenesis in opposite directions, depending on which domain of the molecule is active and/or available, or whether different TSP-1 receptors are present on endothelial cells. 50,51
A regulatory role of the p53 tumor supressor gene on angiogenesis has been reported to act through VEGF 18,46,52,53 and/or TSP-1. 44,45,47 Also, the _CDKN2A/_p16/ink4A tumor supressor gene, which is particularly interesting in melanomas, 54-56 has been associated with regulation of VEGF expression, 57 and VEGF is reported to down-regulate p16 and delay senescence in endothelial cells. 58 On this background, the aim of our study was to examine the expression of VEGF, its receptors and TSP-1 in relation to MVD, p53 and p16 protein expression as well as clinicopathologic factors and patient survival in a series of 202 vertical growth phase melanomas.
Materials and Methods
Patients
The patient material of this series is described in detail elsewhere. 56 Briefly, 202 vertical growth phase melanomas occurring during the years 1981–1997 were included. The presence of a vertical growth phase, and the lack of a radial growth phase, ie, adjacent in situ or microinvasive component, were used as inclusion criteria for the present study. 59 In addition, 68 separate biopsies of local (skin; n = 17), regional (lymph nodes; n = 44) or distant (n = 7) metastases from 58 patients with recurrent disease were available for analyses.
Complete information on patient survival, time and cause of death was available in all 202 cases. Last date of follow-up was December 18th, 1998, and median follow-up time for all survivors was 76 months (range, 13–210). Clinical follow-up (with respect to recurrences) was not carried out in 14 (mostly older) patients, and 21 patients were not treated with complete local excision. Thus, recurrence-free time could be studied in 167 patients.
Immunohistochemistry (IHC)
The immunohistochemical staining was performed on formalin-fixed and paraffin-embedded archival tissue (5 μm sections), and the conditions were optimized for each antibody. Some important steps in the respective protocols are summarized in Table 1 ▶ . The staining procedures and evaluation of p16-, p53-, and Ki-67 expression have been described previously. 56 The results on these biomarkers have also been included in the present study (see Results).
Table 1.
Immunohistochemical Staining Methods
| Antibody | Provider | Epitope retreival | Dilution | Incubation | Signal amplification | Controls |
|---|---|---|---|---|---|---|
| pAb A-082, Factor VIII | DAKO | Proteinase K | 1:800 | 25 min RT* | No | Pos: Colon cancer Neg: Omission |
| MoAb Sn6h, CD105 | DAKO | No | 1:1000 | 30 min RT | CSA (DAKO) | Pos: Colon cancer Neg: Omission |
| pAb A-20, VEGF | Santa Cruz | 3× 5 min in citrate buffer (pH = 6) at 500 W | 1:50 | 25 min RT | No | Pos: Endometrial cancer Neg: Omission |
| pAb C-17, Flt-1 | Santa Cruz | 6× 5 min in citrate buffer (pH = 6) at 500 W | 1:100 | Overnight RT | No | Pos: Umbilical vein Neg: Blocking peptide |
| MoAb A-3, KDR | Santa Cruz | 3× 5 min in citrate buffer (pH = 6) at 500 W | 1:500 | 25 min RT | No | Pos: Umbilical vein Neg: Irrelevant mouse MoAb |
| MoAb Ab-7, TSP-1 | Neomarkers | 3× 5 min in Tris-HCL (pH = 1.0) at 500 W | 1:200 | Overnight RT | No | Pos: Colon cancer Neg: Omission |
Staining was performed on a DAKO (Copenhagen, Denmark) TechMate 500 slide processing equipment, using the standard avidin-biotin method. Finally, the peroxidase was localized by the 3-amino-9-ethylcarbazole peroxidase reaction with Harris hematoxylin as counterstain.
In situ hybridization
mRNA in situ hybridization (ISH) was carried out by using the Super Sensitive ISH Detection kit (Biogenex, San Ramon, CA), optimized for paraffin-embedded archival material, and the Omnislide Thermal Cycler (Hybaid, Ashford, UK) equipment. Twenty-five cases with high VEGF expression (index ≥ 4) and 25 cases with low expression, as well as 5 randomly selected metastases, were selected for in situ hybridization on the basis of immunohistochemical staining results. Expression of TSP-1 was studied in 36 randomly selected cases by in situ hybridization.
The sections (5 μm) were dewaxed in xylol. Proteinase K treatment was replaced with microwave treatment in citrate buffer (pH = 6.0) because this method produced more consistent results. After placing the working probe solution (250 ng of probe/ml) on the slides, a 10-minute denaturation step at 95° C on the heating block was performed followed by incubation overnight at 37° C in a humidity chamber. Sections were blocked for endogenous biotin and peroxidase.
The sequence of the biotinylated antisense oligonucleotide probe for VEGF is TGG′TGA′TGT′TGG′ACT′CCT′CAG′TGG′GC. This sequence is previously used by others. 60,61 Further, a cocktail of two biotinylated antisense probes with the following sequences was used for TSP-1: CAT′GGT′GGA′GCT′GTT′GGT′GCC′CAG′CAG′G and TGG′GGC′AGG′ACA′CCT′TTT′TGC′AGA′TGG′T. The sequences showed 100% homology with the respective genes as determined by a BLAST-search in the NCBI databases (National Center for Biotechnology Information, www.ncbi.nlm.nih.gov/) Negative controls were obtained by incubating the control sections with biotinylated sense probes or no probe. Cases showing no reaction when incubated with a polyA probe were regarded to have degradation of mRNA and were excluded from further analysis.
Reverse-Transcription Polymerase Chain Reaction
Thirty cases were randomly selected for the analysis of VEGF isoforms by reverse-transcription polymerase chain reaction (RT-PCR). After deparaffinization of four 10 μm sections, the samples were incubated with proteinase K at 55°C overnight on a rotator. RNA were then isolated by the phenol-chloroform extraction method. 62 RT-PCR were carried out by the Sensiscript kit (Qiagen, Hilden, Germany_)_ according to the recommendations of the provider, and random hexamers were used for first strand cDNA synthesis. VEGF cDNA fragments were amplified by 45 rounds of PCR consisting of 1 minute at 95°C, 1.5 minutes at 53°C and 1.5 minutes at 72°C with Amplitaq Gold (Applied Biosystems, Foster City, CA), and PCR products were run on a 3% agarose gel containing ethidiumbromide and visualized by UV-light.
The quality of mRNA was examined by two primer pairs for β-actin (products of 150 and 265 bp, respectively). Table 2 ▶ shows the sequences of the primers used, as well as the expected size of the PCR products. The quality of RNA isolated from the archival material was not optimal, and the critical length for successful amplification was found to be around 200 bp in most cases. Thus, to get short products, we used primer pairs specific for each splice variant of VEGF. Negative results were only considered reliable if the actual sample showed a β-actin product longer than the expected product of the isoform being analyzed. cDNA from a snap frozen Ewing sarcoma, expressing the VEGF isoforms, was used as a positive control for the PCR step.
Table 2.
Sequences of Primers Used in RT-PCR Analyses for 3 Different Splice Variants of VEGF
| Primers | Sequence | Product length |
|---|---|---|
| VEGF121 lower | 5′-ATC TGG TCC CCG AAA CGC T-3′ | |
| VEGF121 upper* | 5′-TAT GCG GAT CCA ACC TCA CCA A-3′ | 173 bp |
| VEGF165 lower | 5′-ACA TTT ACA CGT CTG CGG ATC T-3′ | |
| VEGF165 upper* | 5′-TAT GCG GAT CCA ACC TCA CCA A-3′ | 172 bp |
| VEGF189 lower | 5′-ACA TTT ACA CGT CTG CGG ATC T-3′ | |
| VEGF189 upper | 5′-AGG GAA AGG GGC AAA AAC G-3′ | 122 bp |
Evaluation of MVD
MVD was assessed as described previously. 13 Briefly, the sections were scanned at low magnifications (×25 and ×100) to identify the most vascular areas of the tumor (hotspots), according to Weidner and colleagues. 2 Within these areas, which were almost exclusively localized within and around the invasive front at the tumor base, a maximum of 10 fields at ×400 magnification (HPF, 0.16 mm 2 per field) were examined, and the mean value of these fields was calculated. Vessels more than one-half HPF (×400) away from (below) the invasive front, or vessels close (<1 HPF) to ulcerated areas were not counted. Any highlighted endothelial cell or cell cluster, clearly separate from adjacent microvessels, tumor cells, and connective tissue elements, were regarded as a distinct countable microvessel. 2
Using Factor-VIII stained slides, MVD was estimated in the hotspot areas. In addition, specific MVD counts were established for the central tumor areas as well as for the tumor base, and a ratio between the two was also calculated. In parallel, MVD in the hotspots was estimated using the CD105/endoglin antibody, which has been promoted as a marker more specific for tumor associated vessels 63-65 and a proliferation-associated marker on endothelial cells. 66
Evaluation of Staining Results
A staining index, obtained as a product of staining intensity (0–3) and proportion of immunopositive tumor or endothelial cells (≤10% = 1, 10 to 50% = 2, >50% = 3), was calculated for VEGF staining and its receptors, as well as for in situ hybridization results for VEGF and TSP-1 mRNA. FLT-1 staining in tumor associated endothelial cells was evenly weak in most positive cases, and quantification by the staining index was not suitable, therefore the expression was recorded as absent or present. When present, the intensity of the VEGF labeling of inflammatory cells and keratinocytes was recorded as minimal, moderate or strong. The mRNA expressing cell type was also noted after in situ hybridization for VEGF and TSP-1 mRNA.
Using similar criteria as for the VEGF staining, a staining index (area × intensity) was calculated for TSP-1 positivity. TSP-1 expression was graded as absent/low (index, ≤ 2) or moderate/high on the basis of extracellular immunostaining in intratumoral or immediate peritumoral (<1 HPF) areas. Nuclear staining, which was observed occasionally in tumor cells and frequently in inflammatory cells, was considered to be nonspecific. 45,67
For statistical purposes, cut points for continuous variables, and the variables evaluated by the staining index, were based on the distribution of these values. The staining indices for VEGF, its receptors and TSP-1 showed bimodal distributions, and the cut points were set between distinct peaks.
Statistics
Analyses were performed using the statistical package SPSS, version 9.0. 68 Associations between different categorical variables were assessed by Pearson’s χ 2 test. Continuous variables not following the normal distribution were compared between two or more groups using the Mann-Whitney U or Kruskal-Wallis H tests. A Wilcoxon signed ranks test was used to compare related samples. Univariate analyses of time to death due to malignant melanoma or time to recurrence (recurrence-free survival) were performed using the product-limit procedure (Kaplan-Meier method), with date of histological diagnosis as the starting point. Patients who died of other causes were censored at the time of death. Differences between categories were tested by the log-rank test. The influence of covariates on patient survival and recurrence-free survival was analyzed by the proportional hazards method, 69 including all variables with a P value ≤ 0.15 in univariate analyses, and tested by the likelihood ratio test. Model assumptions were tested by log-minus-log plots, and significant variables were tested for interactions. Estimated hazard ratio, 95%. CI for hazard ratio and P values are given in the tables.
Results
MVD
Using the Factor-VIII antibody (F-VIII), median MVD in the primary tumors (hotspot areas) was 125 microvessels per mm 2 (range, 31–456; mean, 132; SD, 59), compared with a median of 106 microvessels per mm 2 (range, 19–281; mean, 124; SD, 58) in the metastases (Wilcoxon signed ranks test, P = 0.037). The most active areas were almost exclusively located at the tumor base.
Median MVD counted at the tumor base was 125 microvessels per mm2, compared with 75 when counted in central areas of the tumor (intratumor MVD; Wilcoxon signed ranks test, P < 0.0001). The median intratumor/tumor base ratio for MVD was 0.57, and a higher ratio was significantly associated with Clark’s level 5 of invasion, 0.81 versus 0.55 for the others (Mann-Whitney U test, P = 0.006).
The CD105/endoglin antibody gave a median MVD in the primary tumors (hotspot areas) of 94 microvessels per mm 2 (range, 6–350; mean, 109; SD, 69). Estimates of MVD by F-VIII and CD105 were significantly correlated (Figure 1 ▶ , linear regression r = 0.40, P < 0.0001), although MVD counts by CD105 were significantly lower (Wilcoxon signed ranks test, P < 0.001). Table 2 ▶ shows a comparison between the two vessel markers with respect to associations between MVD and other variables studied, and some differences were present. CD105 was significantly associated with tumor thickness, in contrast to the findings for F-VIII. Also, biomarkers such as p53 and VEGF protein staining were significantly associated with CD105 expression (Table 2) ▶ .
Figure 1.

Microvessel density (MVD) in vessels/mm 2 by CD105 antibody plotted against MVD by Factor-VIII antibody in a simple scatterplot. A regression line is shown to illustrate the relationship (see Results).
The median CD105/F-VIII ratio (hotspot areas) was 0.63 (range, 0.03–2.67; mean, 0.69; SD, 0.43). Increased CD105/F-VIII ratio was significantly correlated with increased tumor thickness using median thickness as cut-point (Mann-Whitney U test, P = 0.018), and presence of p53 staining (Mann-Whitney U test, P = 0.01).
VEGF Protein Staining (IHC)
Positive staining for VEGF protein in the cytoplasm of tumor cells was present in 98% of the primary tumors, with high expression (staining index ≥ 4) in 68%; 68% of the metastasis also had high VEGF expression. All cases showed positivity in inflammatory cells, and 35% had high VEGF expression in these cells. Seven and 61% of the cases showed strong VEGF expression in the keratinocytes and endothelial cells, respectively (Figure 2c) ▶ .
Figure 2.
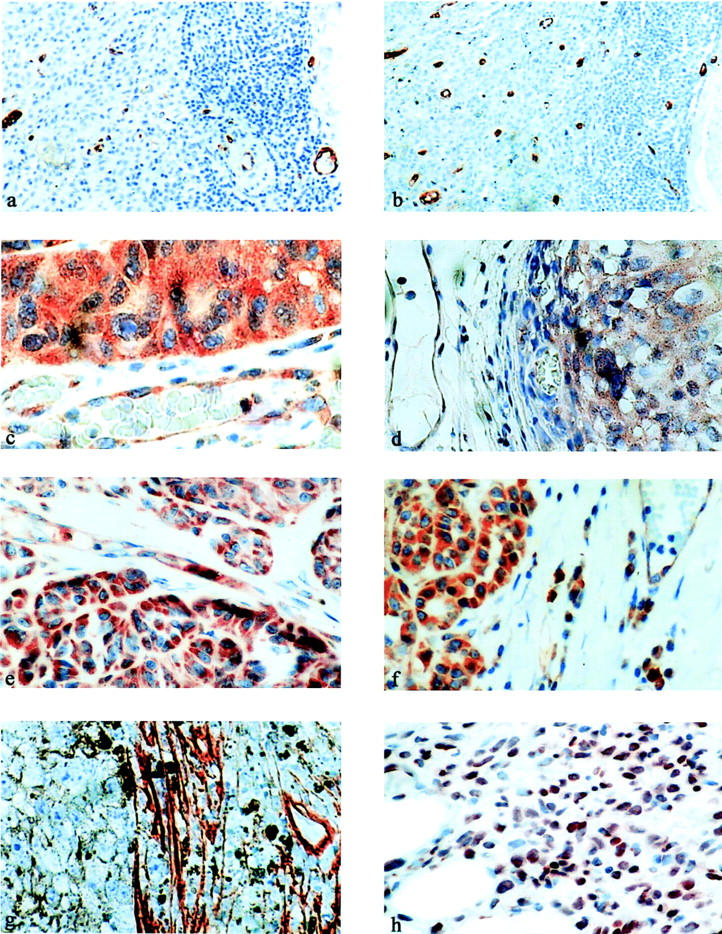
MVD at the tumor base as illustrated by CD105- (a) and Factor VIII antibody (b). VEGF protein expression by immunohistochemistry (c) and VEGF mRNA expression by in situ hybridization (d). e: Positive staining of Flt-1 receptors. f: KDR receptors in tumor associated endothelium and melanoma cells. (g) Intratumoral stromal tissue expressing the TSP-1 protein. h: TSP-1 mRNA by in situ hybridization.
As shown in Table 2 ▶ , MVD, as assessed by CD105/endoglin staining, was lower in cases showing high expression (index ≥ 4) of the VEGF protein (Mann-Whitney U test, P = 0.04); correspondingly, increased VEGF protein expression was significantly associated with lower tumor thickness (Mann-Whitney U test, P = 0.04) and lower (≤4) Clark’s level of invasion (P = 0.04). In tumors ≤ 3.55 mm (median), 74% showed strong VEGF expression, compared with 61% in tumors >3.55 mm.
Interestingly, the association between VEGF expression and MVD (CD105) was opposite in thin and thick lesions. As illustrated in Figure 3a ▶ ), in tumors ≤ 3.55 mm (median), strong VEGF expression was not significantly associated with higher MVD by CD105 (Mann-Whitney U test, P = 0.6), whereas in tumors > 3.55 mm, strong VEGF expression was significantly associated with lower MVD (Mann-Whitney U test, P = 0.001).
Figure 3.

a: Inverse relations between VEGF protein expression and MVD when the cases were grouped in thin and thick lesions. b: Opposite associations between expression of TSP-1 protein and MVD depending on p53 expression status (absent or present) of the tumor. * Statistically significant differences, P < 0.05 (see Results).
VEGF expression was significantly higher in cases with presence of vascular invasion (P = 0.04). There was no association between VEGF expression and MVD by F-VIII in neither primary tumors nor metastases.
VEGF mRNA
As described, 25 cases with high VEGF protein expression (index ≥ 4) were compared with 25 cases with low expression (index, < 4) by in situ hybridization for VEGF mRNA. VEGF mRNA expression was found as a granular reactivity in the cytoplasm of tumor cells in positive cases (Figure 2d) ▶ . Similar to the immunohistochemical analysis, the expression was diffusely distributed throughout the tumor in most cases. Weak hybridization signals in other cell types, including endothelial cells were detected occasionally (Figure 2) ▶ . No hybridization was seen when incubating with the sense probe or no probe. Eight cases were negative or very weak (index 0–1), 17 cases were moderate (index 2–3), whereas 25 cases were strong (index ≥ 4). The agreement between the two methods (IHC and ISH) was 74% with a corresponding kappa value κ = 0.63 (χ2, P < 0.0001).
VEGF mRNA Isoforms
Twenty-three of 30 cases included for RT-PCR (77%) produced evaluable bands for β-actin (150 and 265 bp). Six of these cases (26%) were positive for VEGF189, and 1 of these 6 was also positive for both VEGF121 and VEGF165, whereas the remaining 17 cases were negative for all isoforms analyzed. Negative cases that did not show a β-actin band longer than the VEGF isoform product of interest were regarded as not valuable. As illustrated in Figure 4 ▶ , the amount of amplifiable VEGF mRNA in the positive cases was small in comparison with that of β-actin, as interpreted from the thickness of the bands. The median MVD by CD105 in the 6 cases expressing VEGF189 was 31 vessels/mm, 2 compared with 81 in the 17 cases positive for β-actin but lacking bands for VEGF189 (Mann-Whitney U test, P = 0.14).
Figure 4.

RT-PCR analysis of VEGF mRNA isolated from paraffin embedded melanomas. Lanes 1, 11, 12 and 19: 100-bp marker. Lane 2: positive control for β-actin (150 bp). Lanes 3-8: β-actin in melanoma samples (cases 527, 519, 518, 515, 514, and 509). Lane 9: VEGF121 in case 527. Lane 10: Positive control for VEGF121. Lane 13: VEGF165 in case no 527. Lane 14: positive control for VEGF165. Lane 15: positive control for VEGF189. Lanes 16-18: VEGF189 in case 527, 519, and 518.
FLT-1 and KDR Protein Staining
Presence of FLT-1 staining in endothelial cells was recorded in 28% of the cases, and was significantly associated with increased VEGF expression in tumor cells (χ2, P = 0.04). FLT-1 expression in endothelial cells was further correlated with presence of nuclear p16 staining (χ2, P = 0.008). No significant association with MVD was found.
FLT-1 staining was present at various levels in tumor cells in 83% of the cases, with high expression (index ≥ 4) in 46%. Strongly positive cases were significantly associated with FLT-1 in endothelial cells (χ2, P < 0.0001) and presence of nuclear p16 expression (χ2, P = 0.01).
In tumor-associated endothelial cells, KDR expression was present in 83% of the cases, with high expression (index ≥ 4) in 66%. High expression was significantly associated with absent p53 staining (χ2, P = 0.006). No significant correlation was found between KDR expression in endothelial cells and clinico-pathological variables or MVD.
Tumor cells showed KDR staining in 89% of the cases, being strong (index ≥ 4) in 72%. High KDR expression was significantly associated with lower MVD (CD105, Mann Whitney U Test, P = 0.02), and absence of p53 staining (χ2, P = 0.002). By comparing the cases by median tumor thickness (3.55 mm), we found that KDR expression in tumor cells was significantly associated with increased proliferative rate by Ki-67 in the thicker cases, with a median proliferative rate of 26% by low KDR expression, as compared to 38% by high KDR expression (Mann Whitney U test, P = 0.003). In the same subgroup of thick tumors, high KDR expression in tumor cells was significantly associated with weak or absent p16 staining (χ2, P = 0.008).
In cases with nests of infiltrating melanoma cells in the dermis, we often observed a perinodular staining pattern with increased KDR expression in the cells lining the stromal septa compared with cells in the center of the nests. In several cases, we also observed increased expression at the borders of the tumors, although a more homogenous distribution of positive cells was more frequent (Figure 2f) ▶ .
Significant co-expression in tumor cells was found between FLT-1 and VEGF (χ2, P < 0.0001). A significant co-expression between KDR and VEGF was also present (χ2, P = 0.02), and cases that co-expressed KDR and VEGF in tumor cells (n = 98) had significantly lower MVD by CD105 (Mann-Whitney U test, P = 0.01).
TSP-1 Protein Staining
As illustrated in Figure 2g ▶ , the TSP-1 protein was immunohistochemically detected in the tumor stroma, especially near ulcerated areas, in the stromal septa, and at the tumor base. Forty-three percentage of the primary tumors and 41% of metastases showed moderate or high TSP-1 expression (index > 2) by immunohistochemistry. In the primary tumors, moderate or high TSP-1 expression was significantly correlated with increased MVD (both vessel markers), as shown in Table 1 ▶ . The same trend was found, although not significantly, in the metastases (Mann-Whitney U test, P = 0.10). TSP-1 expression was significantly higher in ulcerated tumors (χ2, P < 0.0001), and when ulcerated and non-ulcerated (n = 105) cases were analyzed separately, the relation between TSP-1 and MVD was different in the two subgroups. Increased TSP-1 expression was significantly associated with increased MVD (Mann-Whitney U test, P = 0.02) in the non-ulcerated tumors, whereas no association was observed in the ulcerated tumors.
Figure 3b ▶ illustrates the relation between TSP-1 expression and MVD depending on the p53 status of the tumor. In p53-positive tumors, moderate or high TSP-1 expression was significantly correlated with increased MVD (Mann-Whitney U test, P = 0.004), whereas in p53-negative tumors, the inverse relation was observed (not statistically significant, P = 0.36).
High expression of TSP-1 protein was further associated with increased tumor thickness (Mann-Whitney U test, P < 0.001), Clark’s level 5 versus 2–4 (χ2, P = 0.02), presence of vascular invasion (χ2, P = 0.04), increased proliferative rate by Ki-67 (Mann-Whitney U test, P < 0.001), presence of p53 expression (χ2, P = 0.014) and loss of nuclear p16 expression (χ2, P = 0.009).
TSP-1 mRNA
TSP-1 mRNA was detected in the nuclei of tumor cells, fibroblasts and inflammatory cells, as well as in endothelial cells in some cases (Figure 2h) ▶ . The intensity of the chromogenic signal appeared to be comparable in different cell populations within each case, and the staining was relatively homogenous throughout the tumor tissue. In some cases, however, the expression was more marked in the deepest infiltrating part of the tumor. The expression was regarded as high (index ≥ 4) in 12 cases (33%), 18 cases (50%), and 16 cases (44%), for tumor cells, inflammatory cells, and fibroblasts, respectively. There was no statistically significant association between strong protein staining and mRNA expression in either of these cell types, although there was a trend of stronger protein staining in cases with high mRNA expression in the tumor cells (66% with strong TSP-1 protein staining), compared to cases with low mRNA expression (43% of which had strong TSP-1 protein staining; χ2, P = 0.19).
Presence of ulceration was significantly associated with increased expression of TSP-1 mRNA in tumor cells and fibroblasts (χ2, P = 0.05 for both). Whereas no association was present between p53 protein staining and TSP-1 mRNA expression in tumor cells, absent p53 staining (tumor cells, index = 0) was significantly correlated to high TSP-1 mRNA expression in inflammatory cells and fibroblasts (χ2, P = 0.02, and P = 0.03, respectively). No significant associations were found with MVD.
Survival Analysis
Table 3 ▶ shows the results of univariate survival analysis for the angiogenesis variables. Of these, only MVD and TSP-1 expression were significant and included in multivariate analysis (Figure 5) ▶ In addition, the following variables, all significant or of borderline significance in univariate analysis (P ≤ 0.15), were included: anatomical site, tumor thickness, Clark’s level of invasion, vascular invasion, tumor ulceration, p16, p53, and Ki-67 expression. 56 The MVDs for F-VIII and CD105 were analyzed separately. MVD by CD105 was categorized by the median value, whereas MVD by F-VIII was categorized by the 67th percentile to show a significant difference; using the median value gave no significant difference. 13 Only cases with complete information on all variables were included in multivariate analysis. Anatomical site, Clark’s level of invasion, vascular invasion, p16 expression, p53 expression, Ki-67 expression, and MVD remained as independent prognostic factors in the final multivariate model. The results of multivariate survival analysis including MVD by CD105 (n = 170) are shown in Table 4 ▶ . When MVD with F-VIII was included (n = 184), the Hazard Ratio for MVD was 1.9 (1.05–3.4) (P = 0.03), with only minor adjustments for the covariables.
Table 3.
Microvessel Density (Median Vessel Counts/mm2) Related to Standard Clinicopathological Variables
| Variable | No. of patients | MVD (F. VIII) | P value* | MVD (CD 105) | P value* |
|---|---|---|---|---|---|
| Anatomic site | |||||
| Head/neck | 47 | 125 | 0.75† | 100 | 0.27† |
| Trunk | 49 | 119 | 81 | ||
| Upper extremity | 38 | 131 | 91 | ||
| Lower extremity | 52 | 113 | 113 | ||
| Clark’s level of invasion | |||||
| III | 21 | 119 | 0.77† | 84 | 0.67† |
| IV | 131 | 125 | 97 | ||
| V | 35 | 131 | 100 | ||
| Tumor thickness | |||||
| ≤3.6 mm‡ | 92 | 119 | 0.05 | 81 | 0.001 |
| >3.6 mm | 96 | 131 | 113 | ||
| Tumor ulceration | |||||
| Absent | 105 | 112 | 0.003 | 91 | 0.12 |
| Present | 79 | 138 | 106 | ||
| Vascular invasion | |||||
| Absent | 150 | 119 | 0.09 | 97 | 0.7 |
| Present | 38 | 131 | 94 | ||
| Ki-67 expression | |||||
| ≤16%§ | 49 | 113 | 0.08 | 94 | 0.3 |
| >16% | 139 | 125 | 100 | ||
| p53 staining | |||||
| Absent | 29 | 119 | 0.3 | 78 | 0.02 |
| Present | 158 | 125 | 106 | ||
| p16 staining¶ | |||||
| Weak/absent (≤1) | 85 | 125 | 0.3 | 94 | 0.8 |
| Moderate/strong (>1) | 102 | 119 | 94 | ||
| VEGF staining¶ | |||||
| Weak/absent (<4) | 60 | 128 | 0.4 | 119 | 0.015 |
| Moderate/strong (≥4) | 127 | 119 | 87 | ||
| TSP-1 staining¶ | |||||
| Absent/weak (<2) | 103 | 119 | 0.007 | 81 | 0.001 |
| Moderate/strong (≥2) | 77 | 131 | 113 | ||
| Flt-1 staining∥ | |||||
| Absent | 127 | 125 | 0.9 | 103 | 0.6 |
| Present | 50 | 128 | 93 | ||
| KDR staining¶∥ | |||||
| Weak/absent (<4) | 62 | 125 | 0.7 | 106 | 0.08 |
| Moderate/strong (≥4) | 121 | 125 | 88 |
Figure 5.

Survival curves were estimated according to the Kaplan-Meier method with death due to melanoma as end point. a: Survival by MVD using the CD105 antibody. b: Survival by TSP-1 expression.
Table 4.
Estimated 5- and 10-Year Survival for Patients with VGP Melanoma
| Variables | No. of patients | Estimated survival rates, % (SE) | P Value* | |
|---|---|---|---|---|
| 5 years | 10 years | |||
| MVD (F-VIII) | ||||
| Low† | 126 | 72 (4.4) | 60 (5.4) | 0.06 |
| High | 62 | 54 (7.6) | 49 (8.2) | |
| MVD (CD105) | ||||
| Low‡ | 86 | 73 (5.5) | 58 (7.6) | 0.04 |
| High | 84 | 57 (5.6) | 51 (6.0) | |
| VEGF expression§ | ||||
| Weak/absent (<4) | 60 | 61 (5.6) | 58 (7.6) | 0.12 |
| Moderate/strong (≥4) | 127 | 70 (5.2) | 61 (6.4) | |
| Flt-1 staining§ | ||||
| Weak/absent (<4) | 96 | 67 (5.1) | 58 (7.3) | 0.8 |
| Moderate/strong (≥4) | 82 | 63 (6.2) | 51 (7.0) | |
| KDR staining§¶ | ||||
| Weak/absent (<4) | 51 | 58 (7.4) | 49 (8.0) | 0.8 |
| Moderate/strong (≥4) | 133 | 69 (4.5) | 58 (5.7) | |
| TSP-1 expression§ | ||||
| Weak/absent (<2) | 103 | 75 (4.6) | 68 (5.8) | 0.0001 |
| Moderate/strong (≥2) | 77 | 51 (6.5) | 35 (8.4) |
Discussion
In the present study we show that angiogenesis, as estimated by MVD, and using two different endothelial cell markers (F-VIII and CD105/endoglin), is an independent prognostic variable in vertical growth phase melanomas. Based on previous reports, the importance of angiogenesis in malignant melanomas has been controversial, 5-12 although survival studies are few. This might partly be due to differences in patient selection, antibodies used and procedures for microvessel quantification. We used two different antibodies, and the hotspot strategy introduced by Weidner and co-workers for microvessel counts. Our findings are in accordance with similar studies on a variety of human cancers, 70 and support the view of neovascular dependency of tumor growth and progression. However, the prognostic impact was limited, and the statistical significance in multivariate analysis was clearly dependent on sample size, as we, in a previous study of 102 of these cases, reported a borderline significance of MVD. 13
MVD at the tumor base was significantly higher compared with counts for the central areas of the tumors. It is likely that most tumor-associated vessels in the periphery are recruited from pre-existing vascular networks. The activity of angiogenic factors might be especially elevated at the invasive front, and interactions between tumor cells, stromal cells, and inflammatory cells are probably important. 71-73 In contrast to microvessel counts from areas located at the invasive front, intratumoral MVD was not a prognostic factor in this study, although the ratio between counts from central areas to those at the base increased with tumor thickness.
Theoretically, the relationship between vessel counts by a marker more selective for activated and proliferating endothelial cells, like CD105, 63,64 and vessel counts by panendothelial markers, such as F-VIII or CD34, could give additional information on the angiogenic status of a tumor. One study of breast cancer found the CD105 counts to be of stronger prognostic importance than counts by CD34. 74 We found that an increased CD105/F-VIII ratio was related to increased tumor thickness and presence of p53 staining. One possible explanation is that the relative amount of normal vessels entrapped by the tumor is higher in smaller and p53 negative tumors, whereas the proliferating tumor-associated vessels (CD105 positive) are more numerous in larger and p53-positive lesions. However, no significant association was present between patient prognosis and the amount of CD105-positive vessels relative to the amount of F-VIII-positive vessels. Thus, in malignant melanoma, CD105 gives limited additional information to F-VIII.
It has recently been suggested that highly invasive and metastatic melanoma cells are capable of generating vascular channels that might facilitate tumor perfusion, without the involvement of endothelial cells, 75,76 although the conclusions are disputed by others. 77 If this property is true for cutaneous melanoma, it might explain the presence of thick, highly proliferative and aggressive cases with low MVD by counting vessels lined with differentiated endothelial cells. Interestingly, our cases showed significantly lower counts of F-VIII positive vessels within the tumor than in the periphery, and still no or minimal necrosis in most cases.
In addition to being a mitogen and permeability factor, 14 VEGF is also a survival factor for endothelial cells, 78 and the regulation of VEGF expression, as well as the influence of VEGF on tumor vasculature, seems to be complex. 58,79 In melanocytic lesions, increased expression of VEGF has been associated with malignant progression. 11,21,22 In accordance with this, we find that practically all vertical growth phase melanomas express VEGF to some extent. However, the level of VEGF expression was significantly, but inversely, related to tumor thickness and MVD. This finding suggests that VEGF might be up-regulated in some smaller tumors, whereas a lower level of expression was found in thicker and more vascularized tumors. In the latter lesions, a lower baseline level of VEGF might be sufficient for the maintenance of an established vascular system, with VEGF acting as a survival factor for newly formed endothelial cells. 80 One study suggests that the constitutive level of VEGF is more important than the hypoxic up-regulation of VEGF in melanoma angiogenesis. 81 Alternatively, other angiogenic factors, such as bFGF, IL-8, and ephrins, may be more relevant for the vascular phenotype of this subgroup. 82,83 A recent experimental study indicated that the angiogenesis in poorly angiogenic melanomas was promoted solely by VEGF, whereas multiple angiogenic factors were involved in the angiogenesis of highly angiogenic melanomas. 84
To be available to endothelial cells, VEGF must be secreted as freely diffusible proteins (VEGF121, VEGF165), or modified by protease activation and cleavage of the longer isoforms. 14 In a limited number of cases, VEGF189-positive tumors tended to have a lower MVD when compared with the others. This might be in accordance with our immunohistochemical findings, although in discordance with some results on other tumor types. 26,27,85 Our findings should be interpreted with care due to the small number of positive cases, and limited mRNA quality in paraffin embedded tumor material.
Increasing evidence support the expression and functional importance of VEGF receptors in cell types other than endothelial cells 30,32,33,35,86-88 . We found that VEGF receptors FLT-1 and KDR were present at various levels in tumor cells in most of the cases, and both receptors were significantly co-expressed with VEGF. This might suggest the presence of possible autocrine loops, and we found a significant association between KDR expression and tumor cell proliferation as estimated by Ki-67 staining in the subgroup of thicker tumors (above median). Others have discussed the presence of such autocrine loops in various tumors 30,32,33,35,88 , and some functional evidence have been published showing increased proliferation of KDR expressing cells, 36,89 or decreased proliferation of FLT-1 expressing cells 37,89 in response to VEGF. Further, increased expression of matrix metalloproteinases and increased invasiveness were found after VEGF stimulation of FLT-1 expressing smooth muscle cells. 87 The VEGF system might therefore be important for various processes involving other cell types, including tumor cells, in addition to its influence on endothelial cell proliferation, migration, and differentiation. 90
Staining of thrombospondin-1 protein was mainly found in the tumor stroma, whereas TSP-1 mRNA was detected in the nuclei of both tumor cells, stromal cells and inflammatory cells. The stromal expression of TSP-1 protein was significantly associated with predictors of aggressive tumor behavior, like increased thickness and level of invasion, high proliferative rate (Ki-67), high MVD, tumor ulceration, vascular invasion, altered p53 and p16, as well as decreased survival. Several in vitro studies provide evidence that TSP-1 is a suppressor of angiogenesis and tumor progression, 43-49 but the correlation between in vitro experiments and in vivo studies of angiogenesis appears to be complex. 91 Recent evidence published by Taraboletti and colleagues show that the 25-kd fragment of TSP-1 potentiates the proangiogenic effect of FGF-2, whereas the 140-kd fragment inhibits FGF-2 induced angiogenesis, 51 further suggesting the importance of environmental settings for the dual role of TSP-1 in angiogenesis. Our results may be in agreement with reports suggesting a proinvasive 40,41 and prometastatic 39 effect of matrix bound TSP-1, possibly through increased attachment to vessel walls, 39,92 mediated by interactions with different TSP-1 receptors on tumor cells. 93,94 This mechanism could also explain the association with vascular invasion. Other studies have shown a proproliferative effect of TSP-1 on tumor cells, in accordance with our findings. 93,95
As recently reported, TSP-1 protein, immobilized in the extracellular matrix, might stimulate endothelial cell proliferation through the α3β1 integrin, 50 which is considered to be a major TSP-1 binding integrin on human endothelial cells. This may be in accordance with our present findings. Another TSP-1 receptor, of particular interest in melanomas, is the αvβ3 integrin, and increased tumor cell expression of this multiligand receptor has been associated with progression and metastasis in cutaneous melanomas. 96-99
Presence of nuclear p53 staining, as an indication of altered p53 function, was associated with increased MVD, as well as increased expression of TSP-1. We were not able to show any association between lower MVD and increased expression of TSP-1 in tumor cells with normal p53 status (no staining), as found in experimental models and some clinical studies, 44,45,47 and our findings indicate that other regulators of TSP-1 than p53 might be involved.
The relationship between level of TSP-1 protein expression and MVD was different in ulcerated and non-ulcerated tumors, indicating a possible interaction with angiogenic factors associated with ulceration. Presence of tumor ulceration was related to increased stromal TSP-1 staining and TSP-1 mRNA expression in tumor cells and fibroblasts, suggesting the possibility that TSP-1 might be induced by growth factors involved in wound healing, which might be of further importance for the progression and poor prognosis in this subset of melanomas.
In conclusion, MVD provided independent prognostic information in this series of cutaneous melanomas, without being a very strong prognostic factor. The angiogenic endothelial cell marker CD105 stained significantly fewer vessels than the panendothelial marker Factor-VIII antibody, but gave only limited information in addition to the latter. VEGF and its receptors FLT-1 and KDR were significantly co-expressed at various levels in tumor cells, suggesting possible autocrine or paracrine loops. Increased VEGF expression in tumor cells was significantly more frequent in thinner and less vascularized tumors, whereas the thicker and more vascularized lesions consistently showed a lower baseline level of expression. TSP-1 expression in tumor stroma was significantly associated with several markers of aggressive tumor behavior, reduced patient survival, and increased MVD, suggesting an important role for TSP-1 in melanoma progression and metastasis.
Table 5.
Multivariate Survival Analysis for Patients with VPG Melanoma, using Death as End-Point
| Variable | Categories | n | HR* | P Value† |
|---|---|---|---|---|
| Anatomic site | Other‡ | 44 | 1 | |
| Trunk | 126 | 3.3 | 0.0001 | |
| Level of invasion (Clark) | II, III, IV | 141 | 1 | |
| V | 29 | 5.7 | <0.0001 | |
| p16 expression | Absent/minimal§ | 77 | 3.2 | |
| Moderate/strong | 93 | 1 | 0.0001 | |
| p53 expression | Absent¶ | 24 | 1 | |
| Moderate/strong | 146 | 18.9 | 0.004 | |
| Ki-67 expression | ≤16%∥ | 43 | 1 | |
| >16% | 127 | 2.7 | 0.02 | |
| Vascular invasion | Absent | 136 | 1 | |
| Present | 34 | 2.2 | 0.01 | |
| MVD (CD105) | Low** | 86 | 1 | |
| High | 84 | 1.7 | 0.04 |
Acknowledgments
We thank Mrs. Gerd Lillian Hallseth, Dr. May Britt Kalvenes PhD, and Mr. Bendik Nordanger for excellent technical assistance.
Footnotes
Address reprint requests to Lars A. Akslen MD, PhD, Department of Pathology, The Gade Institute, Haukeland Hospital, N-5021 Bergen, Norway. E-mail: lars.akslen@gades.uib.no.
Supported by Norwegian Cancer Society Grants 94070/001 and 94070/007.
References
- 1.Folkman J: What is the evidence that tumors are angiogenesis dependent? J Natl Cancer Inst 1990, 82:4-6 [DOI] [PubMed] [Google Scholar]
- 2.Weidner N, Semple JP, Welch WR, Folkman J: Tumor angiogenesis and metastasis- correlation in invasive breast carcinoma. N Engl J Med 1991, 324:1-8 [DOI] [PubMed] [Google Scholar]
- 3.Salvesen HB, Iversen OE, Akslen LA: Prognostic significance of angiogenesis and Ki-67, p53, and p21 expression: a population-based endometrial carcinoma study. J Clin Oncol 1999, 17:1382-1390 [DOI] [PubMed] [Google Scholar]
- 4.Weidner N, Carroll PR, Flax J, Blumenfeld W, Folkman J: Tumor angiogenesis correlates with metastasis in invasive prostate carcinoma. Am J Pathol 1993, 143:401-409 [PMC free article] [PubMed] [Google Scholar]
- 5.Carnochan P, Briggs JC, Westbury G, Davies AJ: The vascularity of cutaneous melanoma: a quantitative histological study of lesions 0.85–1.25 mm in thickness. Br J Cancer 1991, 64:102-107 [DOI] [PMC free article] [PubMed] [Google Scholar]
- 6.Ribatti D, Vacca A, Palma W, Lospalluti M, Dammacco F: Angiogenesis during tumor progression in human malignant melanoma. EXS 1992, 61:415-420 [DOI] [PubMed] [Google Scholar]
- 7.Barnhill RL, Fandrey K, Levy MA, Mihm MC, Jr, Hyman B: Angiogenesis and tumor progression of melanoma: quantification of vascularity in melanocytic nevi and cutaneous malignant melanoma. Lab Invest 1992, 67:331-337 [PubMed] [Google Scholar]
- 8.Graham CH, Rivers J, Kerbel RS, Stankiewicz KS, White WL: Extent of vascularization as a prognostic indicator in thin (< 0.76 mm) malignant melanomas. Am J Pathol 1994, 145:510-514 [PMC free article] [PubMed] [Google Scholar]
- 9.Busam KJ, Berwick M, Blessing K, Fandrey K, Kang S, Karaoli T, Fine J, Cochran AJ, White WL, Rivers J: Tumor vascularity is not a prognostic factor for malignant melanoma of the skin. Am J Pathol 1995, 147:1049-1056 [PMC free article] [PubMed] [Google Scholar]
- 10.Rongioletti F, Miracco C, Gambini C, Pastorino A, Tosi P, Rebora A: Tumor vascularity as a prognostic indicator in intermediate-thickness (0.76–4 mm) cutaneous melanoma: a quantitative assay. Am J Dermatopathol 1996, 18:474-477 [DOI] [PubMed] [Google Scholar]
- 11.Marcoval J, Moreno A, Graells J, Vidal A, Escriba JM, Garcia Ramirez M, Fabra A: Angiogenesis and malignant melanoma: angiogenesis is related to the development of vertical (tumorigenic) growth phase. J Cutan Pathol 1997, 24:212-218 [DOI] [PubMed] [Google Scholar]
- 12.Neitzel LT, Neitzel CD, Magee KL, Malafa MP: Angiogenesis correlates with metastasis in melanoma. Ann Surg Oncol 1999, 6:70-74 [DOI] [PubMed] [Google Scholar]
- 13.Straume O, Salvesen HB, Akslen LA: Angiogenesis is prognostically important in vertical growth phase melanomas. Int J Oncol 1999, 15:595-599 [DOI] [PubMed] [Google Scholar]
- 14.Ferrara N: Molecular and biological properties of vascular endothelial growth factor. J Mol Med 1999, 77:527-543 [DOI] [PubMed] [Google Scholar]
- 15.Guidi AJ, Schnitt SJ, Fischer L, Tognazzi K, Harris JR, Dvorak HF, Brown LF: Vascular permeability factor (vascular endothelial growth factor) expression and angiogenesis in patients with ductal carcinoma in situ of the breast. Cancer 1997, 80:1945-1953 [DOI] [PubMed] [Google Scholar]
- 16.Kang SM, Maeda K, Onoda N, Chung YS, Nakata B, Nishiguchi Y, Sowa M: Combined analysis of p53 and vascular endothelial growth factor expression in colorectal carcinoma for determination of tumor vascularity and liver metastasis. Int J Cancer 1997, 74:502-507 [DOI] [PubMed] [Google Scholar]
- 17.Fontanini G, Boldrini L, Calcinai A, Chine S, Lucchi M, Mussi A, Angeletti CA, Basolo F, Bevilacqua G: Thrombospondins I and II messenger RNA expression in lung carcinoma: relationship with p53 alterations, angiogenic growth factors, and vascular density. Clin Cancer Res 1999, 5:155-161 [PubMed] [Google Scholar]
- 18.Takahashi Y, Bucana CD, Cleary KR, Ellis LM: p53, vessel count, and vascular endothelial growth factor expression in human colon cancer. Int J Cancer 1998, 79:34-38 [DOI] [PubMed] [Google Scholar]
- 19.Claffey KP, Brown LF, del Aguila LF, Tognazzi K, Yeo KT, Manseau EJ, Dvorak HF: Expression of vascular permeability factor/vascular endothelial growth factor by melanoma cells increases tumor growth, angiogenesis, and experimental metastasis. Cancer Res 1996, 56:172-181 [PubMed] [Google Scholar]
- 20.Detmar M, Velasco P, Richard L, Claffey KP, Streit M, Riccardi L, Skobe M, Brown LF: Expression of vascular endothelial growth factor induces an invasive phenotype in human squamous cell carcinomas. Am J Pathol 2000, 156:159-167 [DOI] [PMC free article] [PubMed] [Google Scholar]
- 21.Erhard H, Rietveld FJ, van Altena MC, Brocker EB, Ruiter DJ, de Waal RM: Transition of horizontal to vertical growth phase melanoma is accompanied by induction of vascular endothelial growth factor expression and angiogenesis. Melanoma Res 1997, 7(Suppl 2):19-26 [PubMed] [Google Scholar]
- 22.Salven P, Heikkila P, Joensuu H: Enhanced expression of vascular endothelial growth factor in metastatic melanoma. Br J Cancer 1997, :930-934 [DOI] [PMC free article] [PubMed] [Google Scholar]
- 23.Houck KA, Ferrara N, Winer J, Cachianes G, Li B, Leung DW: The vascular endothelial growth factor family: identification of a fourth molecular species and characterization of alternative splicing of RNA. Mol Endocrinol 1991, 5:1806-1814 [DOI] [PubMed] [Google Scholar]
- 24.Fontanini G, Boldrini L, Chine S, Pisaturo F, Basolo F, Calcinai A, Lucchi M, Mussi A, Angeletti CA, Bevilacqua G: Expression of vascular endothelial growth factor mRNA in non-small-cell lung carcinomas. Br J Cancer 1999, 79:363-369 [DOI] [PMC free article] [PubMed] [Google Scholar]
- 25.Tokunaga T, Oshika Y, Abe Y, Ozeki Y, Sadahiro S, Kijima H, Tsuchida T, Yamazaki H, Ueyama Y, Tamaoki N, Nakamura M: Vascular endothelial growth factor (VEGF) mRNA isoform expression pattern is correlated with liver metastasis and poor prognosis in colon cancer. Br J Cancer 1998, 77:998-1002 [DOI] [PMC free article] [PubMed] [Google Scholar]
- 26.Tomisawa M, Tokunaga T, Oshika Y, Tsuchida T, Fukushima Y, Sato H, Kijima H, Yamazaki H, Ueyama Y, Tamaoki N, Nakamura M: Expression pattern of vascular endothelial growth factor isoform is closely correlated with tumour stage and vascularisation in renal cell carcinoma. Eur J Cancer 1999, 35:133-137 [DOI] [PubMed] [Google Scholar]
- 27.Lee YH, Tokunaga T, Oshika Y, Suto R, Yanagisawa K, Tomisawa M, Fukuda H, Nakano H, Abe S, Tateishi A, Kijima H, Yamazaki H, Tamaoki N, Ueyama Y, Nakamura M: Cell-retained isoforms of vascular endothelial growth factor (VEGF) are correlated with poor prognosis in osteosarcoma. Eur J Cancer 1999, 35:1089-1093 [DOI] [PubMed] [Google Scholar]
- 28.de Vries C, Escobedo JA, Ueno H, Houck K, Ferrara N, Williams LT: The fms-like tyrosine kinase, a receptor for vascular endothelial growth factor. Science 1992, 255:989-991 [DOI] [PubMed] [Google Scholar]
- 29.Terman BI, Dougher-Vermazen M, Carrion ME, Dimitrov D, Armellino DC, Gospodarowicz D, Bohlen P: Identification of the KDR tyrosine kinase as a receptor for vascular endothelial cell growth factor. Biochem Biophys Res Commun 1992, 187:1579-1586 [DOI] [PubMed] [Google Scholar]
- 30.Boocock CA, Charnock-Jones DS, Sharkey AM, McLaren J, Barker PJ, Wright KA, Twentyman PR, Smith SK: Expression of vascular endothelial growth factor and its receptors flt and KDR in ovarian carcinoma. J Natl Cancer Inst 1995, 87:506-516 [DOI] [PubMed] [Google Scholar]
- 31.Gitay-Goren H, Halaban R, Neufeld G: Human melanoma cells but not normal melanocytes express vascular endothelial growth factor receptors. Biochem Biophys Res Commun 1993, 190:702-708 [DOI] [PubMed] [Google Scholar]
- 32.Stitt AW, Simpson DA, Boocock C, Gardiner TA, Murphy GM, Archer DB: Expression of vascular endothelial growth factor (VEGF) and its receptors is regulated in eyes with intra-ocular tumors. J Pathol 1998, 186:306-312 [DOI] [PubMed] [Google Scholar]
- 33.Graeven U, Fiedler W, Karpinski S, Ergun S, Kilic N, Rodeck U, Schmiegel W, Hossfeld DK: Melanoma-associated expression of vascular endothelial growth factor and its receptors FLT-1 and KDR. J Cancer Res Clin Oncol 1999, 125:621-629 [DOI] [PubMed] [Google Scholar]
- 34.Bunone G, Vigneri P, Mariani L, Buto S, Collini P, Pilotti S, Pierotti MA, Bongarzone I: Expression of angiogenesis stimulators and inhibitors in human thyroid tumors and correlation with clinical pathological features. Am J Pathol 1999, 155:1967-1976 [DOI] [PMC free article] [PubMed] [Google Scholar]
- 35.de Jong JS, van Diest PJ, van der Valk P, Baak JP: Expression of growth factors, growth inhibiting factors, and their receptors in invasive breast cancer. I: An inventory in search of autocrine and paracrine loops. J Pathol 1998, 184:44-52 [DOI] [PubMed] [Google Scholar]
- 36.Liu B, Earl HM, Baban D, Shoaibi M, Fabra A, Kerr DJ, Seymour LW: Melanoma cell lines express VEGF receptor KDR and respond to exogenously added VEGF. Biochem Biophys Res Commun 1995, 217:721-727 [DOI] [PubMed] [Google Scholar]
- 37.Herold-Mende C, Steiner HH, Andl T, Riede D, Buttler A, Reisser C, Fusenig NE, Mueller MM: Expression and functional significance of vascular endothelial growth factor receptors in human tumor cells. Lab Invest 1999, 79:1573-1582 [PubMed] [Google Scholar]
- 38.Roberts DD: Regulation of tumor growth and metastasis by thrombospondin-1. FASEB J 1996, 10:1183-1191 [PubMed] [Google Scholar]
- 39.Tuszynski GP, Gasic TB, Rothman VL, Knudsen KA, Gasic GJ: Thrombospondin, a potentiator of tumor cell metastasis. Cancer Res 1987, 47:4130-4133 [PubMed] [Google Scholar]
- 40.Wong SY, Purdie AT, Han P: Thrombospondin and other possible related matrix proteins in malignant and benign breast disease: an immunohistochemical study. Am J Pathol 1992, 140:1473-1482 [PMC free article] [PubMed] [Google Scholar]
- 41.Wang TN, Qian X, Granick MS, Solomon MP, Rothman VL, Berger DH, Tuszynski GP: Thrombospondin-1 (TSP-1) promotes the invasive properties of human breast cancer. J Surg Res 1996, 63:39-43 [DOI] [PubMed] [Google Scholar]
- 42.Weinstat-Saslow DL, Zabrenetzky VS, VanHoutte K, Frazier WA, Roberts DD, Steeg PS: Transfection of thrombospondin 1 complementary DNA into a human breast carcinoma cell line reduces primary tumor growth, metastatic potential, and angiogenesis. Cancer Res 1994, 54:6504-6511 [PubMed] [Google Scholar]
- 43.Zabrenetzky V, Harris CC, Steeg PS, Roberts DD: Expression of the extracellular matrix molecule thrombospondin inversely correlates with malignant progression in melanoma, lung and breast carcinoma cell lines. Int J Cancer 1994, 59:191-195 [DOI] [PubMed] [Google Scholar]
- 44.Dameron KM, Volpert OV, Tainsky MA, Bouck N: Control of angiogenesis in fibroblasts by p53 regulation of thrombospondin-1. Science 1994, 265:1582-1584 [DOI] [PubMed] [Google Scholar]
- 45.Grossfeld GD, Ginsberg DA, Stein JP, Bochner BH, Esrig D, Groshen S, Dunn M, Nichols PW, Taylor CR, Skinner DG, Cote RJ: Thrombospondin-1 expression in bladder cancer: association with p53 alterations, tumor angiogenesis, and tumor progression. J Natl Cancer Inst 1997, 89:219-227 [DOI] [PubMed] [Google Scholar]
- 46.Volpert OV, Dameron KM, Bouck N: Sequential development of an angiogenic phenotype by human fibroblasts progressing to tumorigenicity. Oncogene 1997, 14:1495-1502 [DOI] [PubMed] [Google Scholar]
- 47.Grant SW, Kyshtoobayeva AS, Kurosaki T, Jakowatz J, Fruehauf JP: Mutant p53 correlates with reduced expression of thrombospondin-1, increased angiogenesis, and metastatic progression in melanoma. Cancer Detect Prev 1998, 22:185-194 [DOI] [PubMed] [Google Scholar]
- 48.Tokunaga T, Nakamura M, Oshika Y, Abe Y, Ozeki Y, Fukushima Y, Hatanaka H, Sadahiro S, Kijima H, Tsuchida T, Yamazaki H, Tamaoki N, Ueyama Y: Thrombospondin 2 expression is correlated with inhibition of angiogenesis and metastasis of colon cancer. Br J Cancer 1999, 79:354-359 [DOI] [PMC free article] [PubMed] [Google Scholar]
- 49.Jimenez B, Volpert OV, Crawford SE, Febbraio M, Silverstein RL, Bouck N: Signals leading to apoptosis-dependent inhibition of neovascularization by thrombospondin-1. Nat Med 2000, 6:41-48 [DOI] [PubMed] [Google Scholar]
- 50.Chandrasekaran L, He CZ, Al-Barazi H, Krutzsch HC, Iruela-Arispe ML, Roberts DD: Cell contact-dependent activation of α3β1 integrin modulates endothelial cell responses to thrombospondin-1. Mol Biol Cell 2000, 11:2885-2900 [DOI] [PMC free article] [PubMed] [Google Scholar]
- 51.Taraboletti G, Morbidelli L, Donnini S, Parenti A, Granger HJ, Giavazzi R, Ziche M: The heparin binding 25 kDa fragment of thrombospondin-1 promotes angiogenesis and modulates gelatinase and TIMP-2 production in endothelial cells. FASEB J 2000, 14:1674-1676 [DOI] [PubMed] [Google Scholar]
- 52.Mukhopadhyay D, Tsiokas L, Sukhatme VP: Wild-type p53 and v-Src exert opposing influences on human vascular endothelial growth factor gene expression. Cancer Res 1995, 55:6161-6165 [PubMed] [Google Scholar]
- 53.Fontanini G, Vignati S, Lucchi M, Mussi A, Calcinai A, Boldrini L, Chine S, Silvestri V, Angeletti CA, Basolo F, Bevilacqua G: Neoangiogenesis and p53 protein in lung cancer: their prognostic role and their relation with vascular endothelial growth factor (VEGF) expression. Br J Cancer 1997, 75:1295-1301 [DOI] [PMC free article] [PubMed] [Google Scholar]
- 54.Kamb A, Shattuck Eidens D, Eeles R, Liu Q, Gruis NA, Ding W, Hussey C, Tran T, Miki Y, Weaver Feldhaus J, McClure M, Aitken JF, Anderson DE, Bergman W, Frants R, Goldgar DE, Green A, MacLennan R, Martin NG, Meyer LJ, Youl P, Zone JJ, Skolnick MH, Cannon-Albright LA: Analysis of the p16 gene (CDKN2) as a candidate for the chromosome 9p melanoma susceptibility locus. Nat Genet 1994, 8:23-26 [DOI] [PubMed] [Google Scholar]
- 55.Kumar R, Lundh Rozell B, Louhelainen J, Hemminki K: Mutations in the CDKN2A (p16INK4a) gene in microdissected sporadic primary melanomas. Int J Cancer 1998, 75:193-198 [DOI] [PubMed] [Google Scholar]
- 56.Straume O, Sviland L, Akslen LA: Loss of nuclear p16 protein expression correlates with increased tumor cell proliferation (Ki-67) and poor prognosis in patients with vertical growth phase melanoma. Clin Cancer Res 2000, 6:1845-1853 [PubMed] [Google Scholar]
- 57.Harada H, Nakagawa K, Iwata S, Saito M, Kumon Y, Sakaki S, Sato K, Hamada K: Restoration of wild-type p16 down-regulates vascular endothelial growth factor expression and inhibits angiogenesis in human gliomas. Cancer Res 1999, 59:3783-3789 [PubMed] [Google Scholar]
- 58.Watanabe Y, Lee SW, Detmar M, Ajioka I, Dvorak HF: Vascular permeability factor/vascular endothelial growth factor (VPF/VEGF) delays and induces escape from senescence in human dermal microvascular endothelial cells. Oncogene 1997, 14:2025-2032 [DOI] [PubMed] [Google Scholar]
- 59.Elder DE, Murphy GF: Melanocytic tumors of the skin. Rosai J Sobin LH eds. Atlas of Tumor Pathology. 1991, :pp 119-131 AFIP, Washington DC [Google Scholar]
- 60.Yoneda J, Kuniyasu H, Crispens MA, Price JE, Bucana CD, Fidler IJ: Expression of angiogenesis-related genes and progression of human ovarian carcinomas in nude mice. J Natl Cancer Inst 1998, 90:447-454 [DOI] [PubMed] [Google Scholar]
- 61.Yamamoto S, Yasui W, Kitadai Y, Yokozaki H, Haruma K, Kajiyama G, Tahara E: Expression of vascular endothelial growth factor in human gastric carcinomas. Pathol Int 1998, 48:499-506 [DOI] [PubMed] [Google Scholar]
- 62.Chomczynski P, Sacchi N: Single-step method of RNA isolation by acid guanidinium thiocyanate-phenol-chloroform extraction. Anal Biochem 1987, 162:156-159 [DOI] [PubMed] [Google Scholar]
- 63.Burrows FJ, Derbyshire EJ, Tazzari PL, Amlot P, Gazdar AF, King SW, Letarte M, Vitetta ES, Thorpe PE: Up-regulation of endoglin on vascular endothelial cells in human solid tumors: implications for diagnosis and therapy. Clin Cancer Res 1995, 1:1623-1634 [PubMed] [Google Scholar]
- 64.Bodey B, Bodey B, Jr, Siegel SE, Kaiser HE: Up-regulation of endoglin (CD105) expression during childhood brain tumor-related angiogenesis. Anti-angiogenic therapy. Anticancer Res 1998, 18:1485-1500 [PubMed] [Google Scholar]
- 65.Miller DW, Graulich W, Karges B, Stahl S, Ernst M, Ramaswamy A, Sedlacek HH, Muller R, Adamkiewicz J: Elevated expression of endoglin, a component of the TGF-β-receptor complex, correlates with proliferation of tumor endothelial cells. Int J Cancer 1999, 81:568-572 [DOI] [PubMed] [Google Scholar]
- 66.Matsuno F, Haruta Y, Kondo M, Tsai H, Barcos M, Seon BK: Induction of lasting complete regression of preformed distinct solid tumors by targeting the tumor vasculature using two new anti-endoglin monoclonal antibodies. Clin Cancer Res 1999, 5:371-382 [PubMed] [Google Scholar]
- 67.Grossfeld GD, Shi SR, Ginsberg DA, Rich KA, Skinner DG, Taylor CR, Cote RJ: Immunohistochemical detection of thrombospondin-1 in formalin-fixed, paraffin-embedded tissue. J Histochem Cytochem 1996, 44:761-766 [DOI] [PubMed] [Google Scholar]
- 68.Norusis M: SPSS Advanced Statistics, Version 6.1. 1994. SPSS, Inc. Chicago, IL,
- 69.Cox DR: Regression models and life-tables. J R Stat Soc 1972, 34:187-222 [Google Scholar]
- 70.Weidner N: Tumoural vascularity as a prognostic factor in cancer: the evidence continues to grow. J Pathol 1998, 184:119-122 [DOI] [PubMed] [Google Scholar]
- 71.Norrby K: Angiogenesis: new aspects relating to its initiation and control. Acta Pathol Microbiol Immunol Scand 1997, 105:417-437 [DOI] [PubMed] [Google Scholar]
- 72.Freeman MR, Schneck FX, Gagnon ML, Corless C, Soker S, Niknejad K, Peoples GE, Klagsbrun M: Peripheral blood T lymphocytes and lymphocytes infiltrating human cancers express vascular endothelial growth factor: a potential role for T cells in angiogenesis. Cancer Res 1995, 55:4140-4145 [PubMed] [Google Scholar]
- 73.Watanabe M, McCormick KL, Volker K, Ortaldo JR, Wigginton JM, Brunda MJ, Wiltrout RH, Fogler WE: Regulation of local host-mediated anti-tumor mechanisms by cytokines: direct and indirect effects on leukocyte recruitment and angiogenesis. Am J Pathol 1997, 150:1869-1880 [PMC free article] [PubMed] [Google Scholar]
- 74.Kumar S, Ghellal A, Li C, Byrne G, Haboubi N, Wang JM, Bundred N: Breast carcinoma: vascular density determined using CD105 antibody correlates with tumor prognosis. Cancer Res 1999, 59:856-861 [PubMed] [Google Scholar]
- 75.Maniotis AJ, Folberg R, Hess A, Seftor EA, Gardner LM, Pe’er J, Trent JM, Meltzer PS, Hendrix MJ: Vascular channel formation by human melanoma cells in vivo and in vitro: vasculogenic mimicry. Am J Pathol 1999, 155:739-752 [DOI] [PMC free article] [PubMed] [Google Scholar]
- 76.Folberg R, Hendrix MJ, Maniotis AJ: Vasculogenic mimicry and tumor angiogenesis. Am J Pathol 2000, 156:361-381 [DOI] [PMC free article] [PubMed] [Google Scholar]
- 77.McDonald DM, Munn L, Jain RK: Vasculogenic mimicry: how convincing, how novel, and how significant? Am J Pathol 2000, 156:383-388 [DOI] [PMC free article] [PubMed] [Google Scholar]
- 78.Nor JE, Christensen J, Mooney DJ, Polverini PJ: Vascular endothelial growth factor (VEGF)-mediated angiogenesis is associated with enhanced endothelial cell survival and induction of Bcl-2 expression. Am J Pathol 1999, 154:375-384 [DOI] [PMC free article] [PubMed] [Google Scholar]
- 79.Potgens AJ, van Altena MC, Lubsen NH, Ruiter DJ, de Waal RM: Analysis of the tumor vasculature and metastatic behavior of xenografts of human melanoma cell lines transfected with vascular permeability factor. Am J Pathol 1996, 148:1203-1217 [PMC free article] [PubMed] [Google Scholar]
- 80.Stone J, Itin A, Alon T, Pe’er J, Gnessin H, Chan-Ling T, Keshet E: Development of retinal vasculature is mediated by hypoxia-induced vascular endothelial growth factor (VEGF) expression by neuroglia. J Neurosci 1995, 15:4738-4747 [DOI] [PMC free article] [PubMed] [Google Scholar]
- 81.Danielsen T, Rofstad EK: The constitutive level of vascular endothelial growth factor (VEGF) is more important than hypoxia-induced VEGF up-regulation in the angiogenesis of human melanoma xenografts. Br J Cancer 2000, 82:1528-1534 [DOI] [PMC free article] [PubMed] [Google Scholar]
- 82.Westphal JR, Hullenaar RV, Peek R, Willems RW, Crickard K, Crickard U, Askaa J, Clemmensen I, Ruiter DJ, De Waal RMW: Angiogenic balance in human melanoma: expression of VEGF, bFGF, IL-8, PDGF and angiostatin in relation to vascular density of xenografts in vivo. Int J Cancer 2000, 86:768-776 [DOI] [PubMed] [Google Scholar]
- 83.Easty DJ, Hill SP, Hsu MY, Fallowfield ME, Florenes VA, Herlyn M, Bennett DC: Up-regulation of ephrin-A1 during melanoma progression. Int J Cancer 1999, 84:494-501 [DOI] [PubMed] [Google Scholar]
- 84.Rofstad EK, Halsor EF: Vascular endothelial growth factor, interleukin 8, platelet-derived endothelial cell growth factor, and basic fibroblast growth factor promote angiogenesis and metastasis in human melanoma xenografts. Cancer Res 2000, 60:4932-4938 [PubMed] [Google Scholar]
- 85.Mineta H, Miura K, Ogino T, Takebayashi S, Misawa K, Ueda Y, Suzuki I, Dictor M, Borg A, Wennerberg J: Prognostic value of vascular endothelial growth factor (VEGF) in head and neck squamous cell carcinomas. Br J Cancer 2000, 83:775-781 [DOI] [PMC free article] [PubMed] [Google Scholar]
- 86.Clauss M, Weich H, Breier G, Knies U, Rockl W, Waltenberger J, Risau W: The vascular endothelial growth factor receptor Flt-1 mediates biological activities. Implications for a functional role of placenta growth factor in monocyte activation and chemotaxis. J Biol Chem 1996, 271:17629-17634 [DOI] [PubMed] [Google Scholar]
- 87.Wang H, Keiser JA: Vascular endothelial growth factor up-regulates the expression of matrix metalloproteinases in vascular smooth muscle cells: role of flt-1. Circ Res 1998, 83:832-840 [DOI] [PubMed] [Google Scholar]
- 88.Xie B, Tam NN, Tsao SW, Wong YC: Co-expression of vascular endothelial growth factor (VEGF) and its receptors (flk-1 and flt-1) in hormone-induced mammary cancer in the Noble rat. Br J Cancer 1999, 81:1335-1343 [DOI] [PMC free article] [PubMed] [Google Scholar]
- 89.Dunk C, Ahmed A: Vascular endothelial growth factor receptor-2-mediated mitogenesis is negatively regulated by vascular endothelial growth factor receptor-1 in tumor epithelial cells. Am J Pathol 2001, 158:265-273 [DOI] [PMC free article] [PubMed] [Google Scholar]
- 90.Veikkola T, Karkkainen M, Claesson-Welsh L, Alitalo K: Regulation of angiogenesis via vascular endothelial growth factor receptors. Cancer Res 2000, 60:203-212 [PubMed] [Google Scholar]
- 91.DiPietro LA: Thrombospondin as a regulator of angiogenesis. EXS 1997, 79:295-314 [DOI] [PubMed] [Google Scholar]
- 92.Roberts DD, Sherwood JA, Ginsburg V: Platelet thrombospondin mediates attachment and spreading of human melanoma cells. J Cell Biol 1987, 104:131-139 [DOI] [PMC free article] [PubMed] [Google Scholar]
- 93.Tuszynski GP, Nicosia RF: The role of thrombospondin-1 in tumor progression and angiogenesis. Bioessays 1996, 18:71-76 [DOI] [PubMed] [Google Scholar]
- 94.Tuszynski GP, Wang TN, Berger D: Adhesive proteins and the hematogenous spread of cancer. Acta Haematol 1997, 97:29-39 [DOI] [PubMed] [Google Scholar]
- 95.Roth JJ, Albo D, Rothman VL, Longaker MT, Granick MS, Long CD, Solomon MP, Tuszynski GP: Thrombospondin-1 and its CSVTCG-specific receptor in wound healing and cancer. Ann Plast Surg 1998, 40:494-501 [DOI] [PubMed] [Google Scholar]
- 96.Albelda SM, Mette SA, Elder DE, Stewart R, Damjanovich L, Herlyn M, Buck CA: Integrin distribution in malignant melanoma: association of the β 3 subunit with tumor progression. Cancer Res 1990, 50:6757-6764 [PubMed] [Google Scholar]
- 97.Felding-Habermann B, Mueller BM, Romerdahl CA, Cheresh DA: Involvement of integrin α V gene expression in human melanoma tumorigenicity. J Clin Invest 1992, 89:2018-2022 [DOI] [PMC free article] [PubMed] [Google Scholar]
- 98.Hieken TJ, Farolan M, Ronan SG, Shilkaitis A, Wild L, Das Gupta TK: β3 integrin expression in melanoma predicts subsequent metastasis. J Surg Res 1996, 63:169-173 [DOI] [PubMed] [Google Scholar]
- 99.Van Belle PA, Elenitsas R, Satyamoorthy K, Wolfe JT, Guerry Dt, Schuchter L, Van Belle TJ, Albelda S, Tahin P, Herlyn M, Elder DE: Progression-related expression of β3 integrin in melanomas and nevi. Hum Pathol 1999, 30:562-567 [DOI] [PubMed] [Google Scholar]