Mammalian cell size is controlled by mTOR and its downstream targets S6K1 and 4EBP1/eIF4E (original) (raw)
Abstract
The coordinated action of cell cycle progression and cell growth (an increase in cell size and cell mass) is critical for sustained cellular proliferation, yet the biochemical signals that control cell growth are poorly defined, particularly in mammalian systems. We find that cell growth and cell cycle progression are separable processes in mammalian cells and that growth to appropriate cell size requires mTOR- and PI3K-dependent signals. Expression of a rapamycin-resistant mutant of mTOR rescues the reduced cell size phenotype induced by rapamycin in a kinase-dependent manner, showing the evolutionarily conserved role of mTOR in control of cell growth. Expression of S6K1 mutants that possess partial rapamycin-resistant activity or overexpression of eIF4E individually and additively partially rescues the rapamycin-induced decrease in cell size. In the absence of rapamycin, overexpression of S6K1 or eIF4E increases cell size, and, when coexpressed, they cooperate to increase cell size further. Expression of a phosphorylation site-defective mutant of 4EBP1 that constitutively binds the eIF4E–Cap complex to inhibit translation initiation reduces cell size and blocks eIF4E effects on cell size. These data show that mTOR signals downstream to at least two independent targets, S6K1 and 4EBP1/eIF4E, that function in translational control to regulate mammalian cell size.
Keywords: mTOR, S6K1, eIF4E, 4EBP1, size, growth
Coordinated increases in both cell number and cell size contribute to the growth of an organ or whole organism (Conlon and Raff 1999). To remain constant in size under proliferative conditions, cells must double in mass through increased macromolecular biosynthesis and grow to increased size during each cell division cycle. A sustained proliferative response therefore requires coordination of both cell cycle progression and cell growth (increase in cell size and cell mass), although it is unclear how this is achieved (Neufeld and Edgar 1998; Polymenis and Schmidt 1999). Much research has focused on cell cycle control, yet considerably less attention has focused on the biochemical mechanisms that regulate cell growth, particularly in mammalian systems.
Hartwell and colleagues showed in the budding yeast Saccharomyces cerevisiae that inactivation of most cell division cycle (cdc) genes encoding cell cycle regulators results in arrest at a large cell size, indicating that when cell division is blocked, cell growth continues (Johnston et al. 1977). In contrast, when deprived of nutrients or when cdc genes encoding biosynthetic proteins are inactivated, yeast cell division and cell growth are coordinately blocked, suggesting that sufficient cell growth is required for cell cycle progression, but not vice versa (Johnston et al. 1977). Similarly, in the fruit fly Drosophila melanogaster, disruption of cell cycle regulatory genes (e.g., dE2F and cdc2) results in cell cycle arrest at a large cell size (Weigmann et al. 1997; Neufeld et al. 1998). These studies in model genetic organisms have suggested that cell division and cell growth are normally coordinated yet separable processes and that cells progress through the cell cycle only when sufficient mass, size, and biosynthesis have been reached. Whether cell cycle progression and cell growth are separable processes in mammalian cells has not been well documented.
Whereas in yeast the control of cell size seems primarily to reflect nutrient conditions, in multicellular organisms both nutrients and growth factor signals coordinate cell, organ, and organismal growth. Manipulation of virtually all components of the mitogen-regulated insulin receptor/phosphatidylinositol 3-kinase (PI3K) signaling pathway in Drosophila affects cell number and cell size to produce flies with altered organ and body size (Stocker and Hafen 2000; Weinkove and Leevers 2000). In budding yeast and Drosophila, TOR, the target of rapamycin, functions to monitor nutrient availability, as TOR deletions in these organisms produce phenotypes similar to those produced by nutrient deprivation (Rohde et al. 2001). Indeed, modulation of Drosophila TOR (dTOR) and its downstream targets, ribosomal protein S6 kinase (dS6K) and eukaryotic initiation factor 4E-binding protein (d4EBP), produce cell size phenotypes (Montagne et al. 1999; Oldham et al. 2000; Zhang et al. 2000; Miron et al. 2001). The biochemical signaling mechanisms that regulate organismal growth and cell size in mammals are significantly less well understood.
Mammalian TOR (mTOR), also known as FRAP, RAFT, or RAPT (Brown et al. 1994; Chiu et al. 1994; Sabatini et al. 1994; Sabers et al. 1995), is a large (289-kD), evolutionarily conserved member of the phosphatidylinositol kinase (PIK)-related kinase family in which a lipid kinase homology domain functions as a serine/threonine kinase to regulate protein translation, cell cycle progression, and cellular proliferation (Schmelzle and Hall 2000; Gingras et al. 2001). Rapamycin is a highly specific inhibitor of mTOR function; when complexed with its cellular receptor, FKBP12, rapamycin binds directly to TOR to inhibit downstream signaling. mTOR also likely functions in a nutritional checkpoint, as its best-characterized downstream targets, S6K1 and 4EBP1, are sensitive to amino acid levels (Rohde et al. 2001) and energy status (Dennis et al. 2001). mTOR may also respond to mitogenic signals (Scott et al. 1998; Sekulic et al. 2000; Fang et al. 2001).
In mammals, mTOR cooperates with PI3K-dependent effectors to phosphorylate S6K1 and 4EBP1 (Dufner and Thomas 1999; Gingras et al. 2001). The precise relationship between mTOR and the PI3K pathway is currently unclear, as is the mechanism by which mTOR signals to its downstream targets. S6K1 directly phosphorylates the 40S ribosomal protein S6, which correlates with enhanced translation of transcripts with 5′-terminal oligopyrimidine (5′-TOP) sequences that encode components of the translational machinery (Jefferies et al. 1997). Multisite phosphorylation of the translational repressor 4EBP1 results in its dissociation from eIF4E, thereby allowing eIF4E to assemble with eIF4G, facilitating the recruitment of other translation initiation factors to form the eIF4F complex and initiate cap-dependent translation (Gingras et al. 2001).
The role of mTOR in mammalian physiology remains poorly characterized. Here we use a cultured cell system to investigate the biochemical signaling pathways that regulate the size of proliferating mammalian cells. We show that cell growth and cell cycle progression are separable and thus distinct processes in mammalian cells and that growth to appropriate cell size requires mTOR- and PI3K-dependent signals. We identify mTOR as an important regulator of cell size and use rapamycin as a specific tool to dissect the mTOR-dependent downstream signaling pathways that function to control cell size. We report that S6K1 (70-kD isoform; αII) and 4EBP1/eIF4E mediate mTOR-dependent cell size control, showing important evolutionary-functional conservation of these biochemical signaling networks in higher eukaryotes. That rapamycin is a therapeutic immunosuppressant also showing promise in clinical trials as an antiproliferative drug for chemotherapy and invasive cardiology underscores the importance of elucidating mTOR function in mammalian physiology.
Results
mTOR- and PI3K-mediated cell growth continues when cell cycle progression is blocked
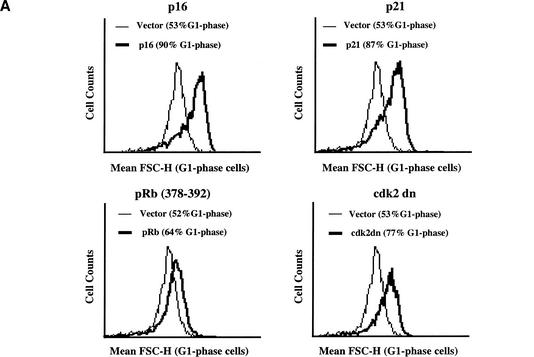
To determine whether cell growth and cell cycle progression are separable and thus distinct processes in mammalian cells, we examined the effect of blocking cell cycle progression on cell growth in cultured mammalian cells. To block cell cycle progression, rat.1a fibroblasts were transiently transfected with the cdk inhibitors p16 and p21, a dominant-negative mutant of cdk2 (cdk2-dn), or a fragment of the retinoblastoma tumor suppressor protein, pRB (378–392), along with the cell surface marker CD20. In this way, the transfected cell populations could be gated and analyzed by flow cytometry (see Materials and Methods). Transfected cells were analyzed on a flow cytometer for DNA content and for cell size using the parameter mean forward scatter height (FSC-H), which is a measure of relative cell size. Expression of p16, p21, cdk2-dn, or pRb (378–392) all led to an increase in the percentage of cells in the G1 phase of the cell cycle and led to a striking rightward shift in the mean FSC-H histograms of G1-phase cells compared with vector controls, indicating a shift to increased cell size (Fig. 1A). Treatment of cells with chemical agents that induce a cell cycle arrest such as lovastatin (G1 arrest), mimosine (late G1 arrest), or hydroxyurea, an inhibitor of DNA synthesis (G1/S arrest), also resulted in increased cell size (data not shown). These results, which have been reproduced in two additional fibroblast cell lines (mouse NIH-3T3 and human WI38), confirm that in mammalian cells, growth continues and cell size increases when cell cycle progression is blocked; therefore, the two processes are separable and distinct.
Figure 1.
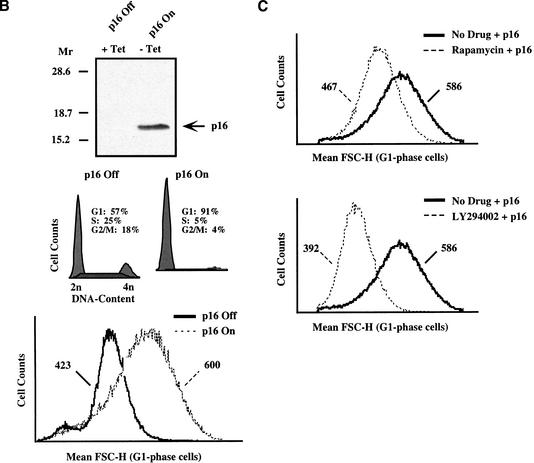
mTOR- and PI3K-mediated cell growth continues when cell cycle progression is blocked. (A) Rat.1a fibroblasts cultured in DMEM/10% FBS were transiently cotransfected with the cell surface marker CD20 (2 μg) and plasmids encoding various pRb pathway cell cycle inhibitory proteins (p16, p21, pRb 328–392, and cdk2 dn; 20 μg). At 48 h posttransfection, cells were harvested for analysis by flow cytometry to determine DNA content and mean FSC-H of G1-phase cells. (B) Rat.1a RT16.15 cells were cultured in the presence of tetracycline (+Tet; p16 Off). To induce p16 expression, tetracycline was removed from the RT16.15 cell line for 24–48 h (−Tet; p16 On). Cells were then either lysed and immunoblotted with anti-p16 antibodies (24 h) or harvested for analysis by flow cytometry to determine DNA content and mean FSC-H of G1-phase cells (48 h). (C) Rat.1a RT16.15 cells were deprived of serum for 48 h in the presence of tetracycline (p16 Off) and then pretreated with the drug inhibitors rapamycin (50 ng/mL) or LY294002 (50 μM) for 30 min. Cells were then shifted to DMEM/10% FBS lacking tetracycline (p16 On) in the absence or presence of drug inhibitors. After 48 h, cells were harvested for analysis by flow cytometry to determine the mean FSC-H of G1-phase cells. The mean FSC-H values for each histogram curve are indicated. Rapamycin and LY294002 inhibited the activity of S6K1 as determined by mobility on SDS-PAGE (data not shown).
To begin elucidating the biochemical signaling mechanisms responsible for regulating growth rate and thus cell size, we used the pharmacological drug inhibitors rapamycin and LY294002 to investigate the effect that inhibition of mTOR- and PI3K-dependent signaling, respectively, would have on cell size. For these experiments, we used a rat.1a-derived cell line (RT16.15) that expresses p16 conditionally using a tetracycline-repressible expression system (Shockett et al. 1995). In this cell line, removal of tetracycline induced p16 expression, accumulation of cells in G1-phase, and a shift to increased cell size as shown by mean FSC-H (Fig. 1B). Importantly, the shift to increased cell size reflected continued cell growth, as 4 d of p16 induction led to a fourfold increase in total protein content on a per cell basis (data not shown). Treatment of RT16.15 cells with rapamycin or LY294002 blocked the ability of the p16-arrested cells to grow to increased size (Fig. 1C). Thus, in this system, mTOR- and PI3K-dependent signals function to control growth to increased cell size.
Rapamycin and LY294002 reduce the size of cycling cells
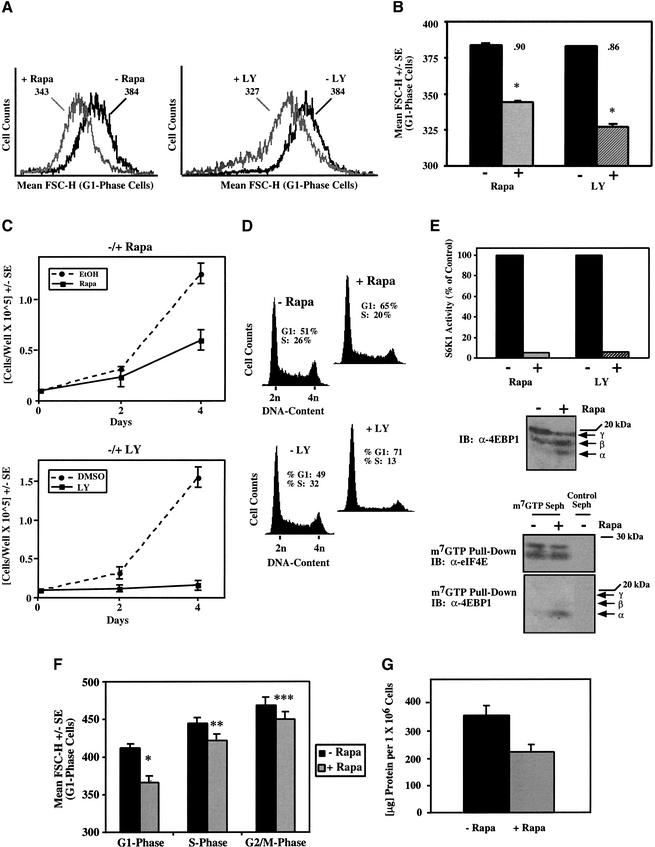
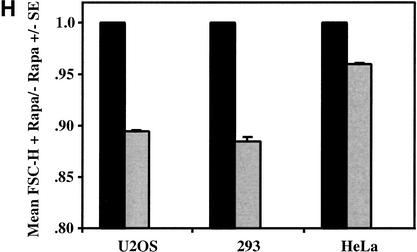
To examine the effects that inhibition of mTOR- and PI3K-dependent signaling have on cell size using a different cultured mammalian cell system, we treated asynchronously cycling U2OS cells (human osteosarcoma) with rapamycin and LY294002, respectively, and determined the relative size of G1-phase cells by flow cytometry. After 72 h of drug treatment, both rapamycin and LY294002 clearly reduced cell size, as seen by the leftward shift of the mean FSC-H histograms (Fig. 2A). Twenty-four hours of drug treatment had a modest effect on cell size, while 48 h of drug treatment had an intermediate effect in reducing cell size (data not shown), suggesting that cell division is required to effect a shift to reduced cell size. As seen with the rat.1a cells, LY294002 treatment had a greater effect on cell size (14% decrease) than did rapamycin (10% decrease; Fig. 2B), suggesting that PI3K signals to mTOR-independent targets that function in cell size control. Importantly, both rapamycin and LY294002 reduced the proliferative rate (Fig. 2C), and 72 h of drug treatment induced an accumulation of cells in G1 phase (Fig. 2D), inhibited S6K1 activity (Fig. 2E), reduced phosphorylation of 4EBP1 (Fig. 2E), and increased association of 4EBP1 with the eIF4E–Cap complex (Fig. 2E), as expected. To determine whether rapamycin reduces cell size during other phases of the cell cycle, we examined the mean FSC-H of S-phase and G2/M-phase cells. Rapamycin decreased cell size across all phases of the cell cycle, but the effect was most striking in the G1 phase (Fig. 2F). Rapamycin treatment for 3 d also led to an ∼30% decrease in total cellular protein content (Fig. 2G), consistent with its known inhibitory effects on translation. Lastly, we assayed the effect of rapamycin on cell size in other cultured cell types to determine how universal is the effect of rapamycin on cell size. Although rapamycin reduced cell size by ∼10% in both U2OS and 293E cells (human embryonic kidney), it had a more modest effect on HeLa cells (human cervical carcinoma), decreasing cell size by ∼4% (Fig. 2H).
Figure 2.
Rapamycin and LY294002 treatment of cycling U2OS cells reduces cell size and inhibits proliferation and cell cycle progression. (A,B) U2OS cells cultured in DMEM/10% FBS were incubated in the absence (−Rapa; ethanol vehicle) or presence (+Rapa) of rapamycin (20 ng/mL) or in the absence (−LY; DMSO vehicle) or presence (+LY) of LY294002 (50 μM) for 72 h. Mean FSC-H histograms of G1-phase cells are shown in A, whereas quantitation of triplicate samples is shown in B. *P < 0.002 compared with vehicle control. The ratio of mean FSC-H +Rapa/−Rapa is indicated above each +Rapa bar. (C) U2OS cells were plated at 1 × 10⁴ cells/well, cultured in the absence or presence of rapamycin (rapa) or LY294002 (LY), and after 2 and 4 d of drug treatment, counted in a hemocytometer. (D) DNA-content histograms of the cells shown in A. (E) U2OS cells were incubated in the absence (−) or presence (+) of rapamycin or LY294002 for 72 h, and the in vitro kinase activity of endogenous S6K1 toward GST-S6 was assayed and quantitated; equal protein amounts were assayed (upper). Equal total protein was incubated with m7GTP-sepharose beads or protein A-sepharose beads as a negative control, and the amount of eIF4E and 4EBP1 bound to the m7GTP–Cap complex after 72 h of ethanol vehicle (−) or rapamycin (+) treatment is shown (lower). The α-, β-, and γ-isoforms of 4EBP1 are indicated by arrows: The α-band represents a hypophosphorylated form, the γ-band represents a hyperphosphorylated form, but the β-band represents an intermediate phosphorylation state. (F) The mean FSC-H of S- and G2/M-phase cells is shown (same cell population as in A). *P < 0.002, **P < 0.02, ***P = 0.08 versus −Rapa condition. (G) Cells cultured in DMEM/10% FBS in the absence (−Rapa; black bar) or presence (+Rapa; gray bar) of rapamycin 20 ng/mL) for 72 h were trypsinized and counted. Equal numbers of cells were lysed, and protein assays were performed to determine total cellular protein content +/− S.E. (H) Triplicate plates of U2OS, 293, or HeLa cells were incubated in the absence (−) or presence (+) of rapamycin for 72 h. The ratio of the mean FSC-H of cells treated +Rapa/−Rapa +/− S.E. is shown. The relative cell size of vehicle-treated cells is set to 1.0.
mTOR-dependent signaling controls cell size
As the specificity of LY294002 for type I PI3K is questionable (Brunn et al. 1996), we focused on characterizing the role of mTOR in control of cell size, because rapamycin is known to be a highly specific inhibitor of mTOR. The rapamycin data above implicate mTOR in control of cell size. To conclusively prove that inhibition of mTOR is the mechanism by which rapamycin reduces cell size, we took advantage of a rapamycin-resistant (RR) isoform of mTOR. Rapamycin-resistant mTOR (RR-mTOR) contains a point mutation (S2035I) in the FRB (FKBP12 and rapamycin binding) domain, rendering mTOR unable to bind to and be inhibited by the rapamycin/FKBP12 complex (Stan et al. 1994; Chen et al. 1995; Choi et al. 1996). When transiently transfected into cells, RR-mTOR is active and able to signal downstream to both S6K1 and 4EBP in the presence of drug (Brown et al. 1995; Hara et al. 1997). To establish a role for mTOR kinase activity, we also used kinase dead (KD) mTOR constructs rendered inactive by point mutation (D2338A) in the kinase domain.
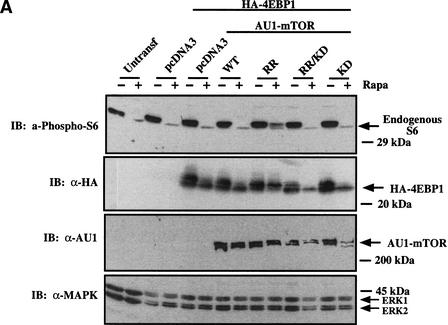
Before determining whether expression of RR-mTOR can rescue the reduced cell size phenotype induced by rapamycin, we first established that RR-mTOR behaves as expected in our cell system. When transiently transfected into U2OS cells, wild-type (WT) and RR-mTOR autophosphorylated in vitro, whereas the kinase dead mutants (RR/KD and KD) did not (data not shown). After transient transfection of the various mTOR constructs, only RR-mTOR restored phosphorylation of endogenous ribosomal protein S6 and cotransfected 4EBP1 during 20 h of rapamycin treatment, as assayed by anti-phospho-S6 immunoblotting and 4EBP1 mobility shift (Fig. 3A). It is important to note that the degree of S6 phosphorylation observed in this context is actually an underestimate, as the phosphorylation state of endogenous, not transfected, S6 protein was examined. Thus, as expected, expression of RR-mTOR in U2OS cells is able to rescue rapamycin-inhibited downstream signaling in a kinase-dependent manner, consistent with what has been previously published in other cell types (Brown et al. 1995; Hara et al. 1997).
Figure 3.
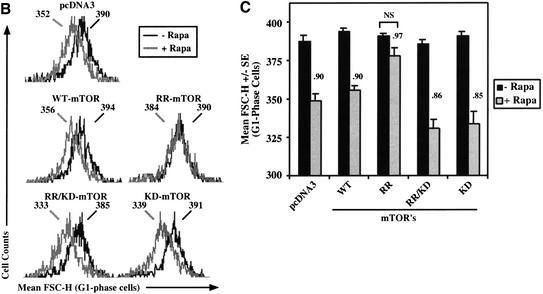
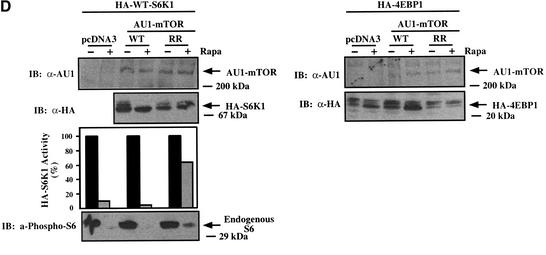
Rapamycin-resistant (RR) mTOR rescues rapamycin-inhibited downstream biochemical signaling and rapamycin-induced decreased cell size. (A) U2OS cells cultured in DMEM/FBS were transiently transfected with pcDNA3 vector control or AU1-tagged mTOR constructs (5 μg) and HA-tagged 4EBP1 (0.5 μg). Transfected cells were incubated in the absence (−) or presence (+) of rapamycin (20 ng/mL) for 20 h, lysed, resolved on SDS-PAGE, and immunoblotted (IB) with anti-phospho-S6, anti-HA, anti-AU1, or anti-MAPK antibodies as loading control, as indicated. (B) Cells were transiently transfected with pcDNA3 vector control or a panel of mTOR plasmids (10 μg) plus CD20 (1 μg). Each transfected plate was split into two plates containing DMEM/FBS in the absence (−Rapa; black curve) or presence (+Rapa; gray curve) of rapamycin (20 ng/mL) for 72 h. Cells were harvested for analysis by flow cytometry, as described in Materials and Methods, and the mean FSC-H of the G1-phase FITC+ cell population was determined. The mean FSC-H values corresponding to each histogram curve are shown. (C) As in B, except quantitation of triplicate transfections is shown. The ratio of the mean FSC-H +Rapa/−Rapa is shown over each +Rapa bar. (NS) Not significant. (D) Cells were cotransfected with 1 μg of HA-tagged S6K1 (left panel) or 1 μg of HA-tagged 4EBP1 (right panel), together with 10 μg of AU1-tagged mTOR constructs and cultured identically to the cell size experiments. Transfected cells were incubated in the absence (−) or presence (+) of rapamycin for 72 h and analyzed by anti-HA-S6K1 in vitro kinase assay or immunoblotting, as indicated.
To assay the ability of RR-mTOR to block the shift to reduced cell size that occurs with rapamycin treatment, we transiently transfected U2OS cells with the panel of mTOR constructs plus the cell surface marker CD20, followed by determination of the size of transfected G1-phase cells on a flow cytometer. Rapamycin treatment for 72 h induced a leftward shift of the mean FSC-H histograms of cells expressing pcDNA3 vector control, WT-mTOR, RR/KD-mTOR, and KD-mTOR, but expression of RR-mTOR largely blocked this effect (Fig. 3B). Although rapamycin reduced cell size slightly (3%) in cells expressing RR-mTOR, this reduction in size was not statistically significant (Fig. 3C). This experiment clearly shows that expression of RR-mTOR is sufficient to rescue the reduced cell size phenotype induced by rapamycin and that the kinase activity of mTOR is required for this effect.
Additionally, we confirmed that expression of RR-mTOR allows signaling to S6K1 and 4EBP1 during rapamycin treatment under conditions identical to those used for analysis of cell size by flow cytometry. U2OS cells were transiently cotransfected with vector control, WT-mTOR, and RR-mTOR plasmids together with either S6K1 or 4EBP1 and incubated in the absence or presence of rapamycin for 72 h under conditions identical to those used for the cell size experiments. In the presence of drug, RR-mTOR but not WT-mTOR restored phosphorylation and activity of S6K1, phosphorylation of ribosomal protein S6 (Fig. 3D, left panel), and phosphorylation of 4EBP1 (Fig. 3D, right panel).
Restoration of S6K1 and eIF4E signaling partially rescues cell size during rapamycin treatment
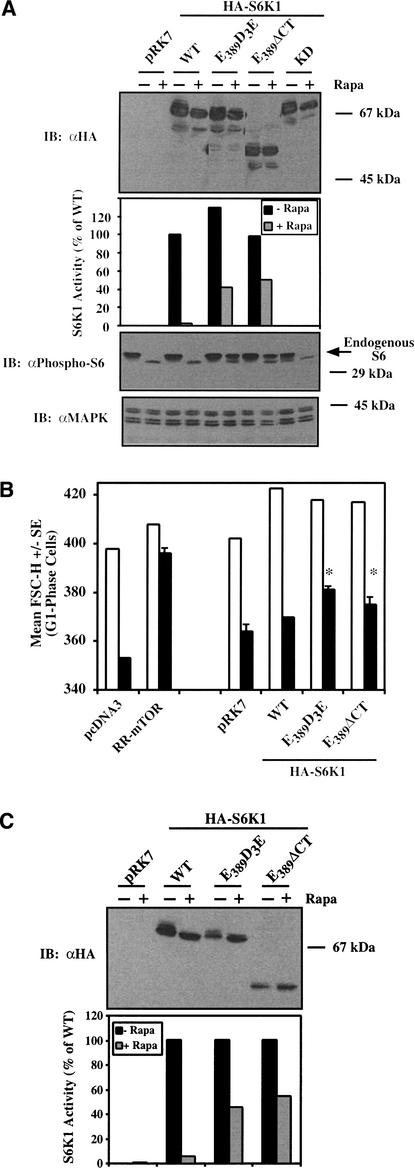
To determine whether signaling from mTOR to S6K1 can rescue cell size during rapamycin treatment, we took advantage of rapamycin-resistant mutants of S6K1 (70 kD isoform; αII), coined E389D3E (Pearson et al. 1995) and E389ΔCT (Schalm and Blenis 2002), as well as wild-type and kinase dead constructs. It is important to note that these rapamycin-resistant mutants of S6K1 only show partial activity in the presence of rapamycin. To confirm the behavior of these RR-S6K1 constructs in our cell system, U2OS cells were transiently transfected with a panel of S6K1 constructs and incubated in the absence or presence of rapamycin for 20 h. Only the rapamycin-resistant mutants (E389D3E and E389ΔCT) retained significant S6 kinase activity (40%–50% the activity of WT-S6K1 in the absence of rapamycin) and mediated S6 phosphorylation during rapamycin treatment (Fig. 4A).
Figure 4.
Rapamycin-resistant (RR) S6K1s partially rescue rapamycin-inhibited downstream signaling and partially rescue the rapamycin-induced decrease in cell size. (A) U2OS cells were transiently transfected with pRK7 vector control or HA-tagged S6K1 constructs (5 μg), incubated in the absence (−) or presence (+) of rapamycin (20 ng/mL) for 20 h, lysed, resolved on SDS-PAGE, and immunoblotted (IB) with anti-HA, anti-phospho-S6, or anti-MAPK antibodies as loading control, as indicated. Equal protein amounts were immunoprecipitated with αHA antibodies, and the in vitro kinase activity of HA-S6K1 was determined. (B) Cells were cotransfected with pRK7 vector control or a panel of S6K1 plasmids (10 μg) plus CD20 (1 μg). Each transfected plate was split into two plates containing DMEM/FBS, incubated in the absence (−Rapa; white bar) or presence (+Rapa; black bar) of rapamycin (20 ng/mL) for 72 h, and harvested for analysis by flow cytometry. For the −Rapa treatment, mean FSC-H of the G1-phase FITC+ cell population from a single transfection is shown; for the +Rapa treatment, the mean FSC-H of triplicate transfections +/− S.E. is shown. *P < 0.02 compared with vector control +Rapa. (C) Cells were transfected with HA-tagged S6K1 (10 μg) and cultured identically to the cell size experiments. Transfected cells were incubated in the absence (−) or presence (+) of rapamycin for 72 h and analyzed by anti-HA -S6K1 immunoblotting or in vitro kinase assay, or as indicated.
To determine whether signaling from mTOR to S6K1 is sufficient to restore cell size during rapamycin treatment, we transiently transfected U2OS cells with the panel of S6K1 constructs plus CD20 followed by analysis of cell size by flow cytometry. Expression of both E389D3E-S6K1 and E389ΔCT-S6K1 partially rescued the decrease in cell size induced by rapamycin, but the pRK7 vector control and WT-S6K1 did not (Fig. 4B). Importantly, the increased cell size shown by cells expressing RR-S6K1s after rapamycin treatment is statistically significant when compared with those expressing the pRK7 vector control. We additionally confirmed that the RR-S6K1s retained activity in the presence of rapamycin under conditions identical to those used for determination of cell size by flow cytometry (e.g., 72 h of rapamycin; Fig. 3C). Interestingly, cells expressing exogenous S6K1 in the absence of rapamycin show increased cell size, an observation that we more carefully follow up below in Figure 6.
Figure 6.
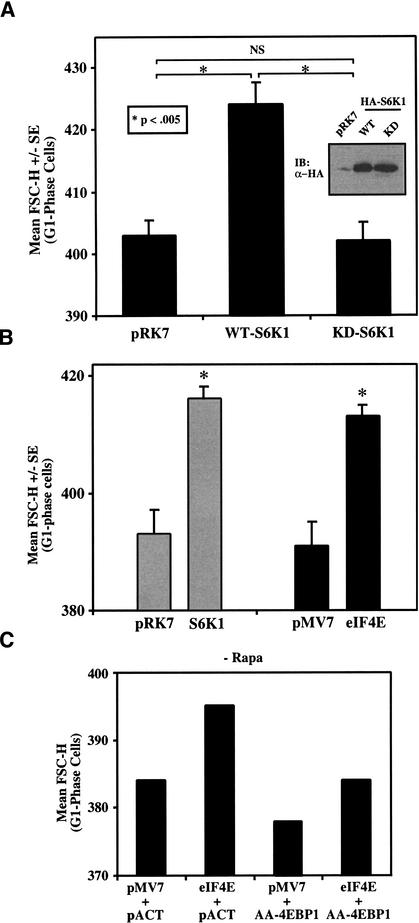
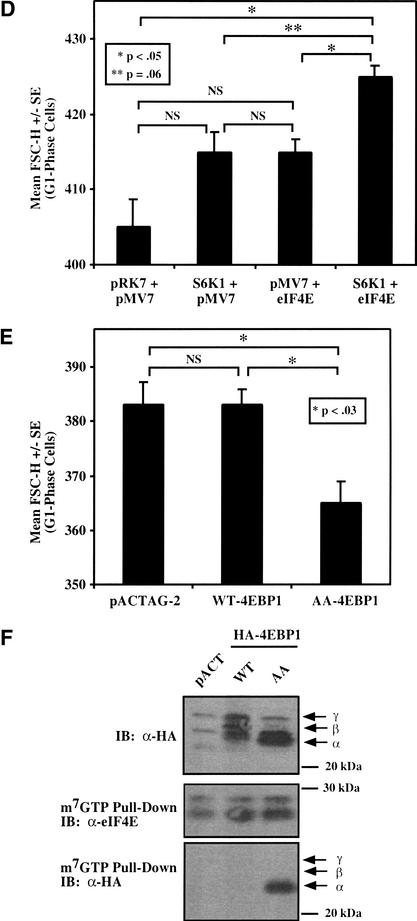
Overexpression of S6K1 or eIF4E individually increases cell size, coexpression of both S6K1 and eIF4E cooperate to increase cell size further, and overexpression of a dominant mutant of 4EBP1 reduces cell size. Cap-dependent translation likely mediates the eIF4E and 4EBP1 effects on cell size. (A) U2OS cells were transiently cotransfected with CD20 (1 μg) plus pRK7 vector control, wild-type (WT), or kinase dead (KD) S6K1 constructs (10 μg), cultured for 72 h in DMEM/FBS, and assayed by flow cytometry to determine cell size. The mean FSC-H +/− S.E. of the G1-phase FITC+ cell population was determined. The WT bar is from quadruplicate samples from two independent transfections; pRK7 and KD bars are from five samples from three independent transfections. Statistical comparisons are shown with brackets. Equivalent expression of the transfected HA-S6K1s in this experiment is shown by immunoblot (inset). (B) Cells were cotransfected with the indicated plasmids (10 μg) plus CD20 (1 μg), and the mean FSC-H +/− S.E. of the FITC+ cell population from triplicate transfections was determined, as above. *P < 0.05 versus vector control. (C) The mean FSC-H of single transfections with the indicated plasmids (8 μg of pMV7 or pMV7/eIF4E + 2 μg of pACTAG2 or pACT/AA-4EBP1) plus CD20 (1 μg) is shown, as above. (D) Cells were cotransfected with the indicated combinations of plasmids (5 μg + 5 μg) plus CD20 (1 μg), and the mean FSC-H +/− S.E. of triplicate samples is shown, as above. Statistical comparisons are shown with brackets. Although the _P_-value comparing S6K1 + pMV7 versus S6K1 + eIF4E (P = 0.06) falls just outside our defined value for statistical significance (P < 0.05), we consistently observe in many experiments that S6K1 + eIF4E cotransfection results in a larger cell size than S6K1 alone. (E) Cells were cotransfected with the indicated plasmids (10 μg) plus CD20 (1 μg), and the mean FSC-H +/− S.E. of FITC+ cells from triplicate transfections is shown, as above. Statistical comparisons are shown with brackets. (F) Equivalent amounts of protein (same transfected cells as in E) were resolved on SDS-PAGE and analyzed by anti-HA-4EBP1 immunoblot (upper) or incubated with m7GTP-sepharose beads, and the amount of endogenous eIF4E and transfected HA-4EBP1 bound to the beads was determined (lower).
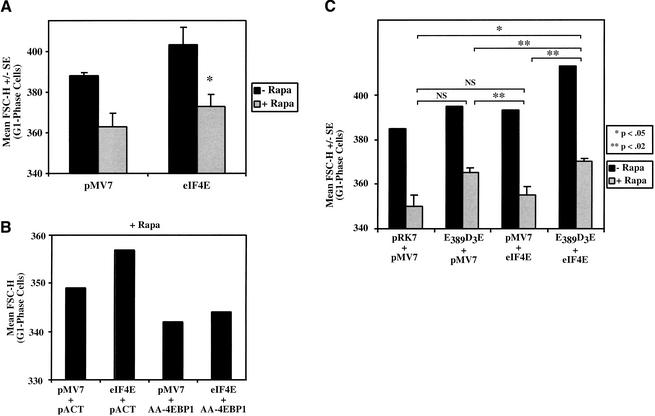
To investigate whether signaling from mTOR to 4EBP1/eIF4E is sufficient to rescue the reduced cell size phenotype induced by rapamycin, we overexpressed eIF4E by transient transfection. Because cellular eIF4E levels are limiting for function, overexpression of eIF4E blocks the ability of 4EBP1 to mediate translational repression in response to rapamycin (Sonenberg and Gingras 1998) and transforms rodent fibroblasts (Lazaris-Karatzas et al. 1990). Transfection of eIF4E produced cells that showed larger cell size after rapamycin treatment than those transfected with the pMV7 vector control, a difference that is statistically significant (Fig. 5A). Thus, similarly to RR-S6Ks, eIF4E overexpression is sufficient to partially rescue the decrease in cell size induced by rapamycin. Once again, cells expressing exogenous eIF4E show increased cell size in the absence of rapamycin, which we more carefully investigate in Figure 6. To show that the rescue of cell size by eIF4E is mediated by a Cap-dependent mechanism, in an independent experiment, we coexpressed a phosphorylation site-defective mutant of 4EBP1 (AA-4EBP1; Thr37Ala/Thr46Ala) that constitutively binds to the eIF4E–Cap complex to inhibit Cap-dependent translation (Gingras et al. 1999). Coexpression of AA-4EBP1 blocked the ability of eIF4E to rescue cell size in the presence of rapamycin (Fig. 5B). To determine whether both the S6K1 and 4EBP1/eIF4E pathways independently modulate cell size, we coexpressed lesser amounts of E389D3E-S6K1 and eIF4E and determined cell size after rapamycin treatment (Fig. 5C). Whereas expression of these lower levels of E389D3E-S6K1 or eIF4E individually did not significantly increase cell size in the presence of rapamycin compared with vector control, coexpression of both E389D3E-S6K1 and eIF4E increased cell size in the presence of rapamycin in a statistically significant manner (Fig. 5C). These results indicate that signaling from mTOR to both S6K1 and 4EBP1/eIF4E independently modulates cell size and that both mTOR-dependent pathways cooperate with each other to promote cell growth and increased cell size.
Figure 5.
eIF4E overexpression partially rescues the rapamycin-induced decrease in cell size in a manner dependent on Cap-dependent translation, and coexpression of both eIF4E and RR-S6K1 cooperates to provide stronger rescue. (A) U2OS cells were cotransfected with the pMV7 vector control or eIF4E (10 μg) together with CD20 (1 μg), incubated in the absence (−) or presence (+) of rapamycin for 72 h, and analyzed by flow cytometry to determine cell size. The mean FSC-H +/− S.E. of the G1-phase FITC+ cell population from quadruplicate transfections is shown. *P < 0.03 compared with vector control +Rapa. (B) Cells were transfected with the indicated combinations of plasmids (8 μg of pMV7 or pMV7/eIF4E + 2 μg of pACTAG2 or pACT/AA-4EBP1) plus CD20 (1 μg) and incubated in the presence of rapamycin for 72 h followed by flow cytometry to determine cell size, as above. (C) Cells were cotransfected with the indicated combinations of plasmids (5 μg + 5 μg) plus CD20 (1 μg) and incubated in the absence (−) or presence (+) of rapamycin for 72 h followed by flow cytometry to determine cell size, as above. For the −Rapa treatment, mean FSC-H of a single transfection is shown; for the +Rapa treatment, the mean FSC-H of triplicate transfections +/− S.E. is shown. Statistical comparisons between +Rapa-treated cells are shown with brackets.
Overexpression of S6K1, eIF4E, and 4EBP1 modulate cell size
We also investigated the role of S6K1 and 4EBP1/eIF4E in control of cell size by assaying the size of cells transfected with S6K1, eIF4E, and 4EBP1 in the absence of rapamycin. Cells expressing S6K1 showed an ∼5% increase in mean FSC-H compared with pRK7 vector control or KD-S6K1 transfected cells (Figs. 4B, −Rapa, 6A), indicating that even in full serum-containing media, S6K1 overexpression is sufficient to drive an increase in cell growth and cell size in a manner dependent on kinase activity. Importantly, expression of WT- and KD-S6K1 were similar in this experiment (Fig. 6A, inset). Similarly, U2OS cells overexpressing eIF4E were ∼5% larger than those transfected with the pMV7 vector control (Figs. 5A, −Rapa, 6B), and coexpression of AA-4EBP1 blocked the ability of eIF4E to drive growth to increased cell size (Fig. 6C). To determine whether the S6K1 and 4EBP1/eIF4E pathways independently drive an increase in cell size in the absence of rapamycin, S6K1 and eIF4E were coexpressed. Transfection of lesser amounts of S6K1 and eIF4E did not significantly increase cell size, whereas coexpression of both S6K1 and eIF4E cooperated to increase cell size (Figs. 5C, −Rapa, 6D). These results confirm that signaling from mTOR to both S6K1 and 4EBP1/eIF4E independently modulate cell size and cooperate with each other in an additive manner.
To examine the role of the 4EBP1/eIF4E pathway in control of cell size in a different way, we overexpressed WT-4EBP1 and the phosphorylation site-defective mutant of 4EBP1, AA-4EBP1. AA-4EBP1 reduced cell size over the pACTAG-2 vector control in full serum-containing media in a statistically significant manner, but overexpression of WT-4EBP1 had no effect on cell size (Fig. 6E). Importantly, WT- and AA-4EBP1 were expressed to similar levels in this experiment, and AA-4EBP1 showed eIF4E–Cap-binding activity, whereas WT-4EBP1 did not (Fig. 6F). These data suggest that the effect of AA-4EBP1 in reducing cell size is likely mediated by inhibition of Cap-dependent translation.
Discussion
Although control of cell cycle progression has received considerable attention, the biochemical mechanisms that regulate cell growth are much less well understood, particularly in mammals. Our data show that in mammalian cells, as in yeast and flies, cell cycle progression and cell growth are separable and thus distinct processes: Cells continue to increase in size when cell division is blocked by the expression of cell cycle inhibitory proteins or by treatment with various chemical agents. Similarly, increased cell volume results when rat Schwann cells are treated with aphidicolin, an inhibitor of DNA synthesis (Conlon et al. 2001). Therefore, cell division cannot be rate-limiting for cell growth. We find that the pharmacological inhibitors rapamycin and LY294002 reduce the size of proliferating cells, implicating mTOR- and PI3K-dependent signaling mechanisms, respectively, in the control of cell size (Fig. 7). These data are consistent with the reduced cell size phenotypes observed in Drosophila when dTOR (Oldham et al. 2000; Zhang et al. 2000) or Dp110, the catalytic subunit of PI3K, is inactivated (Leevers et al. 1996; Weinkove et al. 1999). Interestingly, we find that LY294002 has a greater effect on cell size than rapamycin using two different experimental approaches, suggesting that PI3K (or other PI3K-like enzymes) signals to targets other than those that are coordinately regulated by mTOR to modulate cell size; similarly, LY294002 was shown to block muscle cell hypertrophy to a greater extent than rapamycin in terminally differentiated myotubes (Bodine et al. 2001; Rommel et al. 2001). Akt/PKB (protein kinase B) is a likely candidate to mediate these PI3K-dependent/mTOR-independent effects on cell size, because Akt/PKB phosphorylates and inactivates GSK3, an inhibitor of eIF2B, as well as 4EBP1 (Gingras et al. 1998; Welsh et al. 1998). Indeed, modulation of Akt expression produces strong cell size phenotypes in Drosophila (Verdu et al. 1999) and transgenic mice (Shioi et al. 2002), and Akt/PKB and a dominant-interfering mutant of GSK3β induce muscle myotube hypertrophy (Rommel et al. 2001). Thus, Akt/PKB signalling along both mTOR-dependent and -independent pathways controls translation initiation and cell growth.
Figure 7.
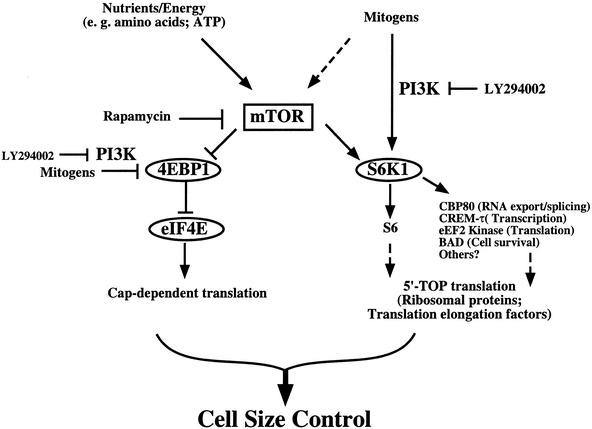
Model depicting the role of mTOR signaling in control of cell size through its downstream targets S6K1 and 4EBP1/eIF4E. Nutrient- and mitogen-dependent signaling likely regulate cell growth and cell size in response to extracellular conditions via the cooperative action of both mTOR- and PI3K-dependent signaling. Although not shown in this model for the sake of simplicity, Akt (PKB) is an important regulator of cell size downstream of PI3K. Although Akt (PKB) has been reported to signal to S6K1, 4EBP1, and mTOR, the precise relationship of Akt to these signaling molecules remains unclear.
Using a rapamycin-resistant mutant of mTOR, we show that inhibition of mTOR is the mechanism by which rapamycin reduces cell size. This observation alone is important, as a loss-of-function mutation in mTOR was recently reported in the flat-top mouse (Hentges et al. 2001). Although mTOR inactivation in this mouse is developmentally lethal, similar to the phenotype resulting from dTOR inactivation in flies (Oldham et al. 2000; Zhang et al. 2000), embryonic cells from this mouse show no reduction in cell size (Hentges et al. 2001). The reason for this discrepancy is unclear, but perhaps different cell types possess different degrees of dependency for mTOR in control of cell growth, or compensatory pathways are up-regulated. As the flat-top mouse is not null for mTOR, it is also possible that low levels of residual signaling are sufficient to maintain cell growth.
Our data provide further evidence that mTOR independently signals to both S6K1 and 4EBP1/eIF4E to control cell size (Fig. 7). Consistently, the kinase activity of mTOR is required both for cell size control and signaling to S6K1 and 4EBP1 (Brown et al. 1995; Brunn et al. 1997). Increased S6K1 activity and eIF4E expression increase cell size in both the presence and absence of rapamycin, individually and additively. Because the activities of the S6K1 mutants used in this study show only partial resistance to the inhibitory effects of rapamycin, it is not unexpected that the RR-S6K1s only partially rescue the rapamycin-induced decrease in cell size. Furthermore, given that rapamycin would be expected to inhibit the formation of functional translation initiation complexes, it is also not unexpected that eIF4E overexpression only slightly increases cell size during rapamycin treatment. Cap-dependent translation likely mediates the effects of eIF4E on cell size, as a phosphorylation site-defective mutant of 4EBP1 that constitutively binds the eIF4E–Cap complex to function as a dominant translational repressor blocks eIF4E effects on cell size. On its own, expression of this 4EBP1 mutant is sufficient to reduce cell size. Our data are consistent with results in Drosophila; Modulation of dS6K (Montagne et al. 1999), d4EBP1 (Miron et al. 2001), and deIF4E (Lachance et al. 2002) expression all produce cell size phenotypes. Additionally, in mammals, it was reported that S6K1 overexpression induces skeletal myotube hypertrophy (Rommel et al. 2001), and S6K1 null mice show reduced body (Shima et al. 1998) and β-cell size (Pende et al. 2000). Thus, our data show that the function of the TOR-dependent targets S6K1 and 4EBP1/eIF4E in cell size control is evolutionarily conserved from flies to mammals.
Although it is tempting to assume that the role of S6K1 in cell size regulation is mediated by phosphorylation of ribosomal protein S6, other targets of S6K1 include the transcription factor CREM-τ (de Groot et al. 1994), the RNA splicing/export factor CBP80 (Wilson et al. 2000), the translation elongation regulator eEF2 kinase (Wang et al. 2001), and the proapoptotic protein BAD (Harada et al. 2001; Fig. 7). Furthermore, S6K1 null mice possess normal S6 phosphorylation and 5′-TOP translation owing to the presence of the S6K1 homolog, S6K2 (Shima et al. 1998), supporting the idea that S6K1 has targets other than ribosomal protein S6 that function to regulate organismal and cell size. Hence, S6K1-dependent cell size control may be independent of S6 phosphorylation and 5′-TOP translation. The mechanism by which S6K1 promotes increased cell growth and cell size awaits future work.
Although we have focused on the control of cell size, inhibition of mTOR is best known to inhibit proliferation by delaying cell cycle progression (Abraham and Wiederrecht 1996). Although the mechanisms that operate in mammals to coordinate cell growth and cell cycle progression are currently unclear, mTOR emerges as an attractive candidate as a central coordinator. mTOR may coordinate these processes by independently regulating cell growth and cell cycle progression by distinct mechanisms or by primarily regulating cell growth, with cell cycle progression a secondary consequence of increased protein biosynthetic rate and sufficient accumulation of cell mass and cell size.
Previous work suggested a dependence of cell cycle progression on cell growth, but not vice versa, leading to the postulation of a cell growth checkpoint for cell cycle progression (Johnston et al. 1977). Our finding that rapamycin-treated cells progress through the cell cycle and proliferate at reduced cell size suggests that if a cell growth checkpoint exists, it must be dynamic and responsive to the extracellular milieu. Indeed, yeast grown on poor carbon sources proliferate at reduced cell size (Flick et al. 1998), and rat Schwann cells divide at a size that varies depending on the concentration of growth factor in the media (Conlon et al. 2001). A hypothetical cell growth checkpoint could measure cell mass and cell size directly, or indirectly by measuring accumulation of a specific protein or set of proteins whose expression correlates with increased cellular mass and size during cell growth. Regulation of the budding yeast G1-cyclin CLN3 provides evidence for the latter model whereby synthesis of a cell cycle driver is sensitive to the protein biosynthetic capacity of the cell: Nutrients regulate the TOR-dependent translation of CLN3 (Barbet et al. 1996), and a short upstream open reading frame (uORF) in the CLN3 mRNA 5′ leader attenuates translation of full-length CLN3 protein during suboptimal growth conditions when ribosome content is limiting (Polymenis and Schmidt 1997).
Translation initiation is a cellular response to both mitogenic stimulation and nutrient availability, important for cell growth, cell cycle progression, and cell proliferation (Gingras et al. 2001). The signaling molecules that we have identified as regulators of cell size function in translational control and are regulated by both mTOR- and PI3K-dependent mechanisms. In aggregate, our data suggest that S6K1 and 4EBP1/eIF4E function to integrate nutritional and mitogenic signals to regulate mammalian cell growth and cell size, showing important evolutionary conservation of these biochemical signaling networks.
Materials and methods
Materials
Rapamycin was provided by S.N. Seghal (Wyeth-Ayerst), and LY294002 was from Calbiochem. The RNase A and Fugene 6 transfection reagent were from Roche. The nitrocellulose membrane was from Schleicher and Schuell. All other chemicals were from Sigma.
Antibodies
Monoclonal anti-p16 antibodies have been described (Koh et al. 1995). Anti-AU1 monoclonal antibodies were from Covance. Anti-CD20-FITC monoclonal antibodies were from BD-Biosciences. Anti-HA monoclonal antibodies were kindly provided by Margaret Chou (University of Pennsylvania, Philadelphia). Anti-phospho-S6 antibodies were kindly provided by Morris Birnbaum (University of Pennsylvania and HHMI, Philadelphia). Anti-eIF4E antibodies were from Cell Signaling Technology, and anti-4EBP1 antibodies were a kind gift from A.A.A. Thomas (University of Utrecht). Anti-S6K1 (Cheatham et al. 1995) and anti-MAPK (Chen et al. 1992) antibodies have been described. For immunoblotting, anti-rabbit and anti-mouse horseradish peroxidase (HRP)-conjugated secondary antibodies were from Amersham and Chemicon, respectively.
Plasmids
Eukaryotic expression plasmids for pRb (328–392), p16, p21, and cdk2-dn have been described, respectively (Hu et al. 1990; van den Heuvel and Harlow 1993; Koh et al. 1995; LaBaer et al. 1997). pcDNA3/AU1-mTOR eukaryotic expression plasmids encoding wild-type (WT), rapamycin-resistant (RR; Ser2035Ile), kinase-dead (KD; Asp2338Ala), and double RR/KD alleles of rat mTOR were kindly provided by Robert Abraham (Burnham Institute, San Diego, CA) and have been described (Brunn et al. 1997). pRK7/HA-S6K1 eukaryotic expression plasmids encoding wild-type (WT) and kinase dead (KD; Lys100Arg) alleles of rat S6K1 (70-kD isoform; αII) have been described previously (Cheatham et al. 1995). The two partially rapamycin-resistant mutants of S6K1, E389D3E (Pearson et al. 1995) and E389ΔCT (Schalm and Blenis 2002) have been described. E389D3E containing the point mutations T389E, S411D, S418D, T421E, and S424D was generated in this lab but was originally described elsewhere (Pearson et al. 1995). The plasmids pMV7/3HA-eIF4E, pACTAG2/HA-WT-4EBP1, and pACTAG2/HA-AA-4EBP1 were generously provided by Nahum Sonenberg (McGill University, Montreal, Quebec, Canada). AA-4EBP1 is a phosphorylation site-defective mutant that contains two point mutations: Thr37Ala and Thr46Ala (Gingras et al. 1999).
Cell culture and transfection
Rat.1A fibroblasts were cultured at 37°C and 5% CO2 in Dulbecco's modified Eagle's media (DMEM) with 10% fetal bovine serum (FBS). Rat.1a cells were transiently transfected on 10-cm plates by the CaPO4 method using 20 μg of total DNA as described (Ausubel et al. 1999). The p16-inducible rat.1A cell line, RT16.15, was generated using the Shockett two-plasmid system (Life Technologies) in which a tetracycline (tet)-regulated construct is repressed in the presence of tetracycline (Shockett et al. 1995). To generate a parent cell line containing the tetracycline-regulated activator, rat.1A cells were cotransfected with pTet-TAK and pCMV-neo, and stable clones were selected in DMEM/10% FBS supplemented with 400 μg/mL G418 and 1 μg/mL tetracycline. Two clones were chosen for further manipulation, as they showed low basal activity and a 20-fold induction of luciferase activity upon removal of tetracycline after transient transfection with a tetracycline-regulated luciferase construct, pUHC13-3. A tetracycline-regulated p16 construct, pUp16 (a gift from Greg Enders, University of Pennsylvania, Philadelphia) was next cotransfected with a puromycin selectable marker (pBABE-Puro) and selected in DMEM/10% FBS supplemented with 1 μg/mL puromycin, 400 μg/mL G418, and 1 μg/mL tetracycline. Two clones that showed tetracycline-regulated p16 expression by immunofluorescence and immunoblotting were selected for further analysis. Characterization of one of these clones, RT16.15, is shown here, although the other clone behaves similarly.
Human U2OS osteosarcoma cells were cultured at 37°C and 5% CO2 in DMEM/10% FBS. Cells were seeded on 60-mm plates 1 d prior to transfection with Fugene 6 overnight according to the manufacturer's directions using 5 to 10 μg of total DNA, depending on the experiment. Cells were washed once with STE at pH 7.2 (150 mM NaCl, 50 mM Tris-HCl, 1 mM EDTA) and either fed immediately with DMEM/10% FBS or trypsinized to new 10-cm plates in the absence or presence of rapamycin (20 ng/mL). For immunoblot analysis, cells were lysed after either 20 or 72 h; for analysis of cell size by flow cytometry, cells were harvested after 72 h.
Cell lysis and immunoblotting
Cells were washed twice with ice-cold STE at pH 7.2, scraped into BLB lysis buffer at pH 7.2 (10 mM KPO4, 1 mM EDTA, 10 mM MgCl2, 50 mM β-glycerophosphate, 5 mM EGTA, 0.5% NP-40, 0.1% Brij-35, 1 mM sodium orthovanadate, 40 μg/mL PMSF, 10 μg/mL leupeptin, 5 μg/mL pepstatin A), and spun at 15,000 rpm for 10 min. Lysates were subjected to SDS-polyacrylamide gel electrophoresis (PAGE), transferred to nitrocellulose membranes, immunoblotted with primary antibodies followed by horseradish peroxidase-conjugated secondary antibodies, and developed via enhanced chemiluminescence (ECL). Bradford assay was used to determine protein content (Bio-Rad).
Immunoprecipitations and immune complex kinase assays
Cell extracts were immunoprecipitated with anti-HA antibodies for 2 h followed by incubation with protein A-sepharose CL4B beads (Pharmacia) for 1 h. Immunoprecipitates were washed with 1 mL each of ice-cold buffer A, buffer B, and ST, as described (Martin et al. 2001). Kinase activity in washed immunoprecipitates was assayed as described using recombinant GST-S6 (32 C-terminal amino acids of ribososomal protein S6) as in vitro substrate, as described (Martin et al. 2001). The amount of 32P incorporated into GST-S6 was assessed by autoradiography and quantitated on a Bio-Rad PhosphorImager with ImageQuant software.
m7GTP Cap-binding assays
Cell extracts were incubated with 20 μL of m7GTP-Sepharose CL4B beads (Pharmacia) at 4°C for 1 h and then washed twice in BLB lysis buffer. Sepharose beads were resuspended in Laemmli sample buffer with 2% β-ME and resolved on SDS-PAGE.
Flow cytometry
To determine DNA content and cell size, a Becton Dickinson FACS Calibur flow cytometer with Cell Quest software was used. For rat.1a cell size experiments, cells were seeded to 10-cm dishes at 5 × 10⁵ cells/plate and transfected the next day with 2 μg of CD20 and 20 μg of plasmid to be assayed. Rat.1a cells were harvested for flow cytometry 48 h after removal of the CaPO4 precipitates.
For U2OS cell size experiments, cells were seeded to 60-mm dishes at 4 × 10⁵ cells/plate, transfected the next day at ∼80% confluency using 1 μg of CD20 plasmid and 10 μg of total plasmid to be assayed, and incubated overnight. Cells were then washed, trypsinized, replated to 10-cm dishes (1:4 split), and harvested 72 h after removal of the transfection complexes for analysis by flow cytometry. To harvest cells, plates were washed once with PBS, once quickly with PBS/EDTA (2.5 mM), and then incubated at 37°C for 5 min in 3 mL of PBS/EDTA. Cells were gently pipetted off the plates, transferred to 15-mL conical tubes, centrifuged for 5 min at 1000 rpm, and the cell pellets were incubated in 20 μL of anti-CD20-FITC monoclonal antibodies for 30 min on ice. The cells were then washed once in PBS containing 1% FBS, centrifuged, resuspended in 0.5 mL of PBS, and fixed by adding 5 mL of 88% ethanol (80% final). Fixed cells were stored at 4°C until the time of analysis. Immediately before analysis on the flow cytometer, the fixed cells were centrifuged at 1600 rpm for 5 min, washed once with PBS/1% FBS, and then incubated at 37°C for 30 min in propidium iodide/RNase A solution (10 μg/mL propidium iodide in 0.76 mM sodium citrate at pH 7.0; 250 μg/mL RNase A in 10 mM Tris-HCl, 15 mM NaCl at pH 7.5) diluted into PBS/1% FBS. For FACS analysis of untransfected cells, 10,000 single cells were collected. Single cells were gated away from clumped cells using an FL2-width versus FL-2 area dot plot. To analyze the transfected cell population, 3000–5000 FITC+ single cells were collected, depending on transfection efficiency, and the mean FSC-H of the FITC+ G1-phase population was determined as a measure of relative cell size (∼1000–1500 cells) of the transfected cell population.
Statistical analysis
Data are presented as the mean plus or minus the standard error. Statistical significance was determined by the Student's _t_-test (paired two sample for means; two-tails) using Microsoft Excel. _P_-values >0.05 are defined as not significant (NS) unless indicated otherwise.
Acknowledgments
We thank Robert Abraham for his generous donation of mTOR plasmids, Nahum Sonenberg for generously sharing the eIF4E and 4EBP1 plasmids, and Morris Birnbaum for generously providing the anti-phospo-S6 antibodies. We are grateful to Martin G. Myers, Jr., Marie Classon, and members of the Blenis lab, particularly Celeste Richardson, Leon Murphy, Angie Romanelli, Stefanie Schalm, Sue-Ann Woo, and Andy Tee, for helpful discussions and critical reading of the manuscript. D.C.F. was supported by NIH NRSA fellowship #F32 CA69808. S.S. was supported by a fellowship from the Jane Coffin Childs Memorial Fund for Medical Research.
The publication costs of this article were defrayed in part by payment of page charges. This article must therefore be hereby marked “advertisement” in accordance with 18 USC section 1734 solely to indicate this fact.
Footnotes
E-MAIL john_blenis@hms.harvard.edu; FAX (617) 432-1144.
Article and publication are at http://www.genesdev.org/cgi/doi/10.1101/gad.995802.
References
- Abraham RT, Wiederrecht GJ. Immunopharmacology of rapamycin. Annu Rev Immunol. 1996;14:483–510. doi: 10.1146/annurev.immunol.14.1.483. [DOI] [PubMed] [Google Scholar]
- Ausubel FM, Brent R, Kingston RE, Moore DD, Seidman JG, Smith JA, Struhl K. Current protocols in molecular biology. New York, NY: Wiley Interscience; 1999. [Google Scholar]
- Barbet NC, Schneider U, Helliwell SB, Stansfield I, Tuite MF, Hall MN. TOR controls translation initiation and early G1 progression in yeast. Mol Biol Cell. 1996;7:25–42. doi: 10.1091/mbc.7.1.25. [DOI] [PMC free article] [PubMed] [Google Scholar]
- Bodine SC, Stitt TN, Gonzalez M, Kline WO, Stover GL, Bauerlein R, Zlotchenko E, Scrimgeour A, Lawrence JC, Glass DJ, et al. Akt/mTOR pathway is a crucial regulator of skeletal muscle hypertrophy and can prevent muscle atrophy in vivo. Nat Cell Biol. 2001;3:1014–1019. doi: 10.1038/ncb1101-1014. [DOI] [PubMed] [Google Scholar]
- Brown EJ, Albers MW, Shin TB, Ichikawa K, Keith CT, Lane WS, Schreiber SL. A mammalian protein targeted by G1-arresting rapamycin-receptor complex. Nature. 1994;369:756–758. doi: 10.1038/369756a0. [DOI] [PubMed] [Google Scholar]
- Brown EJ, Beal PA, Keith CT, Chen J, Shin TB, Schreiber SL. Control of p70 S6 kinase by kinase activity of FRAP in vivo. Nature. 1995;377:441–446. doi: 10.1038/377441a0. [DOI] [PubMed] [Google Scholar]
- Brunn GJ, Williams J, Sabers C, Wiederrecht G, Lawrence JC, Jr, Abraham RT. Direct inhibition of the signaling functions of the mammalian target of rapamycin by the phosphoinositide 3-kinase inhibitors, wortmannin and LY294002. EMBO J. 1996;15:5256–5267. [PMC free article] [PubMed] [Google Scholar]
- Brunn GJ, Hudson CC, Sekulic A, Williams JM, Hosoi H, Houghton PJ, Lawrence JC, Jr, Abraham RT. Phosphorylation of the translational repressor PHAS-I by the mammalian target of rapamycin. Science. 1997;277:99–101. doi: 10.1126/science.277.5322.99. [DOI] [PubMed] [Google Scholar]
- Cheatham L, Monfar M, Chou MM, Blenis J. Structural and functional analysis of p70 S6 kinase. Proc Natl Acad Sci. 1995;92:11696–11700. doi: 10.1073/pnas.92.25.11696. [DOI] [PMC free article] [PubMed] [Google Scholar]
- Chen J, Zheng XF, Brown EJ, Schreiber SL. Identification of an 11-kDa FKBP12-rapamycin-binding domain within the 289-kDa FKBP12-rapamycin-associated protein and characterization of a critical serine residue. Proc Natl Acad Sci. 1995;92:4947–4951. doi: 10.1073/pnas.92.11.4947. [DOI] [PMC free article] [PubMed] [Google Scholar]
- Chen R-H, Sarnecki C, Blenis J. Nuclear localization and regulation of the erk- and rsk-encoded protein kinases. Mol Cell Biol. 1992;12:915–927. doi: 10.1128/mcb.12.3.915. [DOI] [PMC free article] [PubMed] [Google Scholar]
- Chiu MI, Katz H, Berlin V. RAPT1, a mammalian homolog of yeast TOR, interacts with the FKBP12/rapamycin complex. Proc Natl Acad Sci. 1994;91:12574–12578. doi: 10.1073/pnas.91.26.12574. [DOI] [PMC free article] [PubMed] [Google Scholar]
- Choi J, Chen J, Schreiber SL, Clardy J. Structure of the FKBP12-rapamycin complex interacting with the binding domain of human FRAP. Science. 1996;273:239–242. doi: 10.1126/science.273.5272.239. [DOI] [PubMed] [Google Scholar]
- Conlon I, Raff M. Size control in animal development. Cell. 1999;96:235–244. doi: 10.1016/s0092-8674(00)80563-2. [DOI] [PubMed] [Google Scholar]
- Conlon IJ, Dunn GA, Mudge AW, Raff MC. Extracellular control of cell size. Nat Cell Biol. 2001;3:918–921. doi: 10.1038/ncb1001-918. [DOI] [PubMed] [Google Scholar]
- de Groot RP, Ballou LM, Sasssone-Corsi P. Positive regulation of the cAMP-responsive activator CREM by the p70 S6 kinase: An alternative route to mitogen-induced gene expression. Cell. 1994;79:81–91. doi: 10.1016/0092-8674(94)90402-2. [DOI] [PubMed] [Google Scholar]
- Dennis PB, Jaeschke A, Saitoh M, Fowler B, Kozma SC, Thomas G. Mammalian TOR: A homeostatic ATP sensor. Science. 2001;294:1102–1105. doi: 10.1126/science.1063518. [DOI] [PubMed] [Google Scholar]
- Dufner A, Thomas G. Ribosomal S6 kinase signaling and the control of translation. Exp Cell Res. 1999;253:100–109. doi: 10.1006/excr.1999.4683. [DOI] [PubMed] [Google Scholar]
- Fang Y, Vilella-Bach M, Bachmann R, Flanigan A, Chen J. Phosphatidic acid-mediated mitogenic activation of mTOR signaling. Science. 2001;294:1942–1945. doi: 10.1126/science.1066015. [DOI] [PubMed] [Google Scholar]
- Flick K, Chapman-Shimshoni D, Stuart D, Guaderrama M, Wittenberg C. Regulation of cell size by glucose is exerted via repression of the CLN1 promoter. Mol Cell Biol. 1998;18:2492–2501. doi: 10.1128/mcb.18.5.2492. [DOI] [PMC free article] [PubMed] [Google Scholar]
- Gingras AC, Kennedy SG, O'Leary MA, Sonenberg N, Hay N. 4E-BP1, a repressor of mRNA translation, is phosphorylated and inactivated by the Akt(PKB) signaling pathway. Genes & Dev. 1998;12:502–513. doi: 10.1101/gad.12.4.502. [DOI] [PMC free article] [PubMed] [Google Scholar]
- Gingras AC, Gygi SP, Raught B, Polakiewicz RD, Abraham RT, Hoekstra MF, Aebersold R, Sonenberg N. Regulation of 4E-BP1 phosphorylation: A novel two-step mechanism. Genes & Dev. 1999;13:1422–1437. doi: 10.1101/gad.13.11.1422. [DOI] [PMC free article] [PubMed] [Google Scholar]
- Gingras AC, Raught B, Sonenberg N. Regulation of translation initiation by FRAP/mTOR. Genes & Dev. 2001;15:807–826. doi: 10.1101/gad.887201. [DOI] [PubMed] [Google Scholar]
- Hara K, Yonezawa K, Kozlowski MT, Sugimoto T, Andrabi K, Weng QP, Kasuga M, Nishimoto I, Avruch J. Regulation of eIF-4E BP1 phosphorylation by mTOR. J Biol Chem. 1997;272:26457–26463. doi: 10.1074/jbc.272.42.26457. [DOI] [PubMed] [Google Scholar]
- Harada H, Andersen JS, Mann M, Terada N, Korsmeyer SJ. p70S6 kinase signals cell survival as well as growth, inactivating the pro-apoptotic molecule BAD. Proc Natl Acad Sci. 2001;98:9666–9670. doi: 10.1073/pnas.171301998. [DOI] [PMC free article] [PubMed] [Google Scholar]
- Hentges KE, Sirry B, Gingeras AC, Sarbassov D, Sonenberg N, Sabatini D, Peterson AS. FRAP/mTOR is required for proliferation and patterning during embryonic development in the mouse. Proc Natl Acad Sci. 2001;98:13796–13801. doi: 10.1073/pnas.241184198. [DOI] [PMC free article] [PubMed] [Google Scholar]
- Hu QJ, Dyson N, Harlow E. The regions of the retinoblastoma protein needed for binding to adenovirus E1A or SV40 large T antigen are common sites for mutations. EMBO J. 1990;9:1147–1155. doi: 10.1002/j.1460-2075.1990.tb08221.x. [DOI] [PMC free article] [PubMed] [Google Scholar]
- Jefferies HB, Fumagalli S, Dennis PB, Reinhard C, Pearson RB, Thomas G. Rapamycin suppresses 5′TOP mRNA translation through inhibition of p70s6k. EMBO J. 1997;16:3693–3704. doi: 10.1093/emboj/16.12.3693. [DOI] [PMC free article] [PubMed] [Google Scholar]
- Johnston GC, Pringle JR, Hartwell LH. Coordination of growth with cell division in the yeast Saccharomyces cerevisiae. Exp Cell Res. 1977;105:79–98. doi: 10.1016/0014-4827(77)90154-9. [DOI] [PubMed] [Google Scholar]
- Koh J, Enders GH, Dynlacht BD, Harlow E. Tumour-derived p16 alleles encoding proteins defective in cell-cycle inhibition. Nature. 1995;375:506–510. doi: 10.1038/375506a0. [DOI] [PubMed] [Google Scholar]
- LaBaer J, Garrett MD, Stevenson LF, Slingerland JM, Sandhu C, Chou HS, Fattaey A, Harlow E. New functional activities for the p21 family of CDK inhibitors. Genes & Dev. 1997;11:847–862. doi: 10.1101/gad.11.7.847. [DOI] [PubMed] [Google Scholar]
- Lachance PE, Miron M, Raught B, Sonenberg N, Lasko P. Phosphorylation of eukaryotic translation initiation factor 4E is critical for growth. Mol Cell Biol. 2002;22:1656–1663. doi: 10.1128/MCB.22.6.1656-1663.2002. [DOI] [PMC free article] [PubMed] [Google Scholar]
- Lazaris-Karatzas A, Montine KS, Sonenberg N. Malignant transformation by a eukaryotic initiation factor subunit that binds to mRNA 5′ cap. Nature. 1990;345:544–547. doi: 10.1038/345544a0. [DOI] [PubMed] [Google Scholar]
- Leevers SJ, Weinkove D, MacDougall LK, Hafen E, Waterfield MD. The Drosophila phosphoinositide 3-kinase Dp110 promotes cell growth. EMBO J. 1996;15:6584–6594. [PMC free article] [PubMed] [Google Scholar]
- Martin KA, Schalm SS, Richardson C, Romanelli A, Keon KL, Blenis J. Regulation of ribosomal S6 kinase 2 by effectors of the phosphoinositide 3-kinase pathway. J Biol Chem. 2001;276:7884–7891. doi: 10.1074/jbc.M006969200. [DOI] [PubMed] [Google Scholar]
- Miron M, Verdu J, Lachance PE, Birnbaum MJ, Lasko PF, Sonenberg N. The translational inhibitor 4E-BP is an effector of PI(3)K/Akt signalling and cell growth in Drosophila. Nat Cell Biol. 2001;3:596–601. doi: 10.1038/35078571. [DOI] [PubMed] [Google Scholar]
- Montagne J, Stewart MJ, Stocker H, Hafen E, Kozma SC, Thomas G. Drosophila S6 kinase: A regulator of cell size. Science. 1999;285:2126–2129. doi: 10.1126/science.285.5436.2126. [DOI] [PubMed] [Google Scholar]
- Neufeld TP, Edgar BA. Connections between growth and the cell cycle. Curr Opin Cell Biol. 1998;10:784–790. doi: 10.1016/s0955-0674(98)80122-1. [DOI] [PubMed] [Google Scholar]
- Neufeld TP, de la Cruz AF, Johnston LA, Edgar BA. Coordination of growth and cell division in the Drosophila wing. Cell. 1998;93:1183–1193. doi: 10.1016/s0092-8674(00)81462-2. [DOI] [PubMed] [Google Scholar]
- Oldham S, Montagne J, Radimerski T, Thomas G, Hafen E. Genetic and biochemical characterization of dTOR, the Drosophila homolog of the target of rapamycin. Genes & Dev. 2000;14:2689–2694. doi: 10.1101/gad.845700. [DOI] [PMC free article] [PubMed] [Google Scholar]
- Pearson RB, Dennis PB, Han JW, Williamson NA, Kozma SC, Wettenhall RE, Thomas G. The principal target of rapamycin-induced p70S6k inactivation is a novel phosphorylation site within a conserved hydrophobic domain. EMBO J. 1995;14:5279–5287. doi: 10.1002/j.1460-2075.1995.tb00212.x. [DOI] [PMC free article] [PubMed] [Google Scholar]
- Pende M, Kozma SC, Jaquet M, Oorschot V, Burcelin R, Le Marchand-Brustel Y, Klumperman J, Thorens B, Thomas G. Hypoinsulinaemia, glucose intolerance and diminished β-cell size in S6K1-deficient mice. Nature. 2000;408:994–997. doi: 10.1038/35050135. [DOI] [PubMed] [Google Scholar]
- Polymenis M, Schmidt EV. Coupling of cell division to cell growth by translational control of the G1 cyclin CLN3 in yeast. Genes & Dev. 1997;11:2522–2531. doi: 10.1101/gad.11.19.2522. [DOI] [PMC free article] [PubMed] [Google Scholar]
- ————— Coordination of cell growth with cell division. Curr Opin Genet Dev. 1999;9:76–80. doi: 10.1016/s0959-437x(99)80011-2. [DOI] [PubMed] [Google Scholar]
- Rohde J, Heitman J, Cardenas ME. The TOR kinases link nutrient sensing to cell growth. J Biol Chem. 2001;276:9583–9586. doi: 10.1074/jbc.R000034200. [DOI] [PubMed] [Google Scholar]
- Rommel C, Bodine SC, Clarke BA, Rossman R, Nunez L, Stitt TN, Yancopoulos GD, Glass DJ. Mediation of IGF-1-induced skeletal myotube hypertrophy by PI(3)K/Akt/mTOR and PI(3)K/Akt/GSK3 pathways. Nat Cell Biol. 2001;3:1009–1013. doi: 10.1038/ncb1101-1009. [DOI] [PubMed] [Google Scholar]
- Sabatini DM, Erdjument-Bromage H, Lui M, Tempst P, Snyder SH. RAFT1: A mammalian protein that binds to FKBP12 in a rapamycin-dependent fashion and is homologous to yeast TORs. Cell. 1994;78:35–43. doi: 10.1016/0092-8674(94)90570-3. [DOI] [PubMed] [Google Scholar]
- Sabers CJ, Martin MM, Brunn GJ, Williams JM, Dumont FJ, Wiederrecht G, Abraham RT. Isolation of a protein target of the FKBP12–rapamycin complex in mammalian cells. J Biol Chem. 1995;270:815–822. doi: 10.1074/jbc.270.2.815. [DOI] [PubMed] [Google Scholar]
- Schalm SS, Blenis J. Identification of a conserved motif required for mTOR signaling. Curr Biol. 2002;12:632–639. doi: 10.1016/s0960-9822(02)00762-5. [DOI] [PubMed] [Google Scholar]
- Schmelzle T, Hall MN. TOR, a central controller of cell growth. Cell. 2000;103:253–262. doi: 10.1016/s0092-8674(00)00117-3. [DOI] [PubMed] [Google Scholar]
- Scott PH, Brunn GJ, Kohn AD, Roth RA, Lawrence JC., Jr Evidence of insulin-stimulated phosphorylation and activation of the mammalian target of rapamycin mediated by a protein kinase B signaling pathway. Proc Natl Acad Sci. 1998;95:7772–7777. doi: 10.1073/pnas.95.13.7772. [DOI] [PMC free article] [PubMed] [Google Scholar]
- Sekulic A, Hudson CC, Homme JL, Yin P, Otterness DM, Karnitz LM, Abraham RT. A direct linkage between the phosphoinositide 3-kinase-AKT signaling pathway and the mammalian target of rapamycin in mitogen-stimulated and transformed cells. Cancer Res. 2000;60:3504–3513. [PubMed] [Google Scholar]
- Shima H, Pende M, Chen Y, Fumagalli S, Thomas G, Kozma SC. Disruption of the p70(s6k)/p85(s6k) gene reveals a small mouse phenotype and a new functional S6 kinase. EMBO J. 1998;17:6649–6659. doi: 10.1093/emboj/17.22.6649. [DOI] [PMC free article] [PubMed] [Google Scholar]
- Shioi T, McMullen JR, Kang PM, Douglas PS, Obata T, Franke TF, Cantley LC, Izumo S. Akt/Protein kinase B promotes organ growth in transgenic mice. Mol Cell Biol. 2002;22:2799–2809. doi: 10.1128/MCB.22.8.2799-2809.2002. [DOI] [PMC free article] [PubMed] [Google Scholar]
- Shockett P, Difilippantonio M, Hellman N, Schatz DG. A modified tetracycline-regulated system provides autoregulatory, inducible gene expression in cultured cells and transgenic mice. Proc Natl Acad Sci. 1995;92:6522–6526. doi: 10.1073/pnas.92.14.6522. [DOI] [PMC free article] [PubMed] [Google Scholar]
- Sonenberg N, Gingras AC. The mRNA 5′ cap-binding protein eIF4E and control of cell growth. Curr Opin Cell Biol. 1998;10:268–275. doi: 10.1016/s0955-0674(98)80150-6. [DOI] [PubMed] [Google Scholar]
- Stan R, McLaughlin MM, Cafferkey R, Johnson RK, Rosenberg M, Livi GP. Interaction between FKBP12-rapamycin and TOR involves a conserved serine residue. J Biol Chem. 1994;269:32027–32030. [PubMed] [Google Scholar]
- Stocker H, Hafen E. Genetic control of cell size. Curr Opin Genet Dev. 2000;10:529–535. doi: 10.1016/s0959-437x(00)00123-4. [DOI] [PubMed] [Google Scholar]
- van den Heuvel S, Harlow E. Distinct roles for cyclin-dependent kinases in cell cycle control. Science. 1993;262:2050–2054. doi: 10.1126/science.8266103. [DOI] [PubMed] [Google Scholar]
- Verdu J, Buratovich MA, Wilder EL, Birnbaum MJ. Cell-autonomous regulation of cell and organ growth in Drosophila by Akt/PKB. Nat Cell Biol. 1999;1:500–506. doi: 10.1038/70293. [DOI] [PubMed] [Google Scholar]
- Wang X, Li W, Williams M, Terada N, Alessi DR, Proud CG. Regulation of elongation factor 2 kinase by p90(RSK1) and p70 S6 kinase. EMBO J. 2001;20:4370–4379. doi: 10.1093/emboj/20.16.4370. [DOI] [PMC free article] [PubMed] [Google Scholar]
- Weigmann K, Cohen SM, Lehner CF. Cell cycle progression, growth and patterning in imaginal discs despite inhibition of cell division after inactivation of Drosophila cdc2 kinase. Development. 1997;124:3555–3563. doi: 10.1242/dev.124.18.3555. [DOI] [PubMed] [Google Scholar]
- Weinkove D, Leevers SJ. The genetic control of organ growth: Insights from Drosophila. Curr Opin Genet Dev. 2000;10:75–80. doi: 10.1016/s0959-437x(99)00042-8. [DOI] [PubMed] [Google Scholar]
- Weinkove D, Neufeld TP, Twardzik T, Waterfield MD, Leevers SJ. Regulation of imaginal disc cell size, cell number and organ size by Drosophila class I(A) phosphoinositide 3-kinase and its adaptor. Curr Biol. 1999;9:1019–1029. doi: 10.1016/s0960-9822(99)80450-3. [DOI] [PubMed] [Google Scholar]
- Welsh GI, Miller CM, Loughlin AJ, Price NT, Proud CG. Regulation of eukaryotic initiation factor eIF2B: Glycogen synthase kinase-3 phosphorylates a conserved serine which undergoes dephosphorylation in response to insulin. FEBS Lett. 1998;421:125–130. doi: 10.1016/s0014-5793(97)01548-2. [DOI] [PubMed] [Google Scholar]
- Wilson KF, Wu WJ, Cerione RA. Cdc42 stimulates RNA splicing via the S6 kinase and a novel S6 kinase target, the nuclear cap-binding complex. J Biol Chem. 2000;275:37307–37310. doi: 10.1074/jbc.C000482200. [DOI] [PubMed] [Google Scholar]
- Zhang H, Stallock JP, Ng JC, Reinhard C, Neufeld TP. Regulation of cellular growth by the Drosophila target of rapamycin dTOR. Genes & Dev. 2000;14:2712–2724. doi: 10.1101/gad.835000. [DOI] [PMC free article] [PubMed] [Google Scholar]
