Functional identification of the hematopoietic stem cell niche in the ventral domain of the embryonic dorsal aorta (original) (raw)
Abstract
The first definitive/adult-type hematopoietic stem cells (HSCs) in the mouse aorta–gonad–mesonephros region emerge between embryonic days 10.5 and 11.5. The discovery of clusters of hematopoietic cells on the ventral luminal surface of the dorsal aorta in various vertebrate species has led to speculation that the floor of the dorsal aorta may play an essential role for the development of the definitive hematopoietic system. Here, we functionally show affiliation of definitive HSCs with the ventral floor of the dorsal aorta, whereas colony-forming hematopoietic activity is associated with both ventral and dorsal domains. We show that a rare population of PECAM1highCD45+ cells, within which definitive HSCs reside, is predominantly localized to intraaortic clusters. Furthermore, using ex vivo culture analysis, we demonstrate that the ventral domain of the dorsal aorta has an exclusive functional capacity of inducing and expanding definitive HSCs.
Keywords: aorta–gonad–mesonephros region (AGM region), embryo
During mouse embryonic development, the first definitive transplantable high-level repopulating hematopoietic stem cells (HSCs) emerge by embryonic day (E) 10.5–11.5 (1–4). At this stage, the aorta–gonad–mesonephros (AGM) region is capable of autonomous initiation and expansion of HSCs, indicating its important role in the development of the definitive hematopoietic system (2). HSCs first appear in the dorsal aorta (Ao), which consists of endothelial and mesenchymal components, and slightly later in the urogenital ridges (UGR) (5, 6). The presence of clusters of hematopoietic cells attached to the ventral endothelial lining of the developing Ao in various vertebrate species (7–11) has been suggested to be a morphological manifestation of hematopoietic progenitor/stem cell development; a view further supported by experimental studies of the relationship between endothelial cells and hematopoietic progenitors/stem cells in the AGM region (10, 12–18).
To date, no direct evidence has been produced in support of the dorsoventral polarity in hematopoietic development within the Ao. Here, we subdissected the E10.5–11.5 Ao into the ventral (AoV) and dorsal (AoD) domains and tested this hypothesis directly by using robust functional assays (for experimental design see Fig. 1). We demonstrate that in contrast to clonogenic hematopoietic progenitors, which are present in both the AoD and the AoV, definitive HSCs are localized predominantly to the AoV. Flow cytometric analysis supported by immunofluorescent confocal microscopy strongly suggests that HSCs in the E11.5 AGM reside in ventral intraaortic clusters. Furthermore, using the explant culture system, we show that, in contrast to the AoD, the AoV is capable of autonomous initiation and expansion of HSCs.
Fig. 1.
Experimental design. To examine a functional dorsoventral polarity in hematopoietic development the dorsal aorta (Ao) was isolated from the AGM region and subdissected into the dorsal and ventral domains (AoD and AoV, respectively). (A) The contents of CFU-Cs and definitive HSCs in the AoD and AoV were assessed directly by using methylcellulose (MC) and long-term-repopulating (LTR) assays, respectively. (B) The potential of the AoD and AoV to maintain and/or generate CFU-Cs and HSCs was assessed by using 72-h explant culture.
Results
Phenotypic Characterization of Dorsoventral Hematopoietic Polarity in the E11.5 Dorsal Aorta.
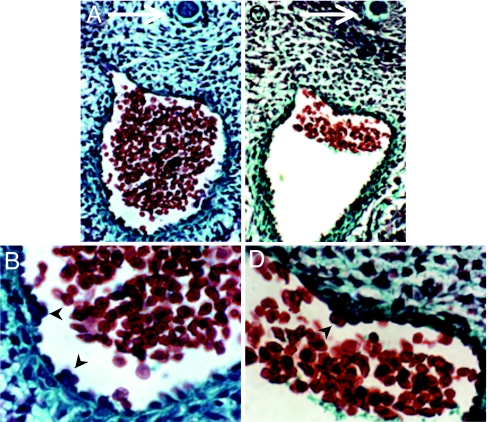
On inspection of histological images obtained from transverse sections of E11.5 embryos, we noticed that small intraaortic cell clusters associated with hematopoietic activity are attached not only ventrally to the endothelial lining of the Ao as described (7–11), but also on occasions to the lateral and dorsal endothelial lining (Fig. 2 and Fig. 3B).
Fig. 2.
Intraaortic hematopoietic clusters in the E11.5 dorsal aorta. (A and B) Ventral intraaortic clusters attached to the endothelial lining of the Ao (arrowheads). (B) A higher-magnification view of ventral cluster in A. (C and D) Dorsal intraaortic cluster (arrowheads). (D) Higher-magnification view of dorsal cluster in C. Notochords are indicated by arrows. Trichrome staining was performed in accord with standard procedure.
Fig. 3.
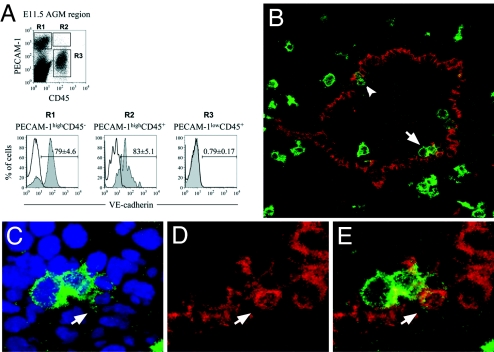
PECAM-1highCD45+ cells are associated with the luminal surface of the E11.5 aorta. (A) Only cells expressing PECAM1 at high level coexpress VE-cadherin, indicating that the VE-cadherin+CD45+ population in the E11.5 AGM region, enriched for HSCs, express PECAM1 at high level. Isotype control staining is represented by a black line, and anti-VE-cadherin is shown by filled arcs (gray). (B) PECAM1highCD45+ cells are localized predominantly to the luminal surface of the endothelial lining of the dorsal aorta. Arrowhead indicates such a cell at the dorsolateral location. Arrow indicates these cells incorporated in a larger ventral cluster. The ventral domain is oriented down, and the dorsal domain is oriented up. (C–E) Magnified images of the ventral cluster containing PECAM1highCD45+ cells indicated in B. (C) Merged images of nuclear (DAPI, blue) and anti-CD45 (green) staining. (D) Staining for PECAM1 (red). (E) Merged images of anti-CD45 (green) and anti-PECAM1 (red) staining. Arrows show the same round PECAM1highCD45+ cell integrated in the endothelial lining. Appropriate isotype control staining is shown in SI Fig. 8.
We and others showed that in the E11.5 AGM region HSCs and CFU-Cs with high frequency reside within the VE-cadherin+CD45+ population (12, 16) and also express PECAM1 (12, 16). Here, we show that only PECAM1highCD45+, but not PECAM1lowCD45+, cells coexpress VE-cadherin (Fig. 3A). Therefore, HSCs emerging in the E11.5 AGM can be defined by a PECAM1highCD45+ phenotype; to localize these cells in the Ao, we performed immunofluorescent confocal microscopy analysis. We found that PECAM1highCD45+ cells are almost exclusively associated with the luminal surface of aortic endothelium and are usually incorporated within intraaortic clusters with occasional integration into the endothelial layer (Fig. 3 B–E). Inspection of whole-mount preparations of the dorsal aortae, enabling a more complete analysis of the luminal surface, readily identified PECAM1highCD45+ cells scattered on the floor but not in subendothelial mesenchymal layers of the dorsal aorta [Fig. 4 and supporting information (SI) Movie 1].
Fig. 4.
Restricted distribution of PECAM-1highCD45+ cells to the luminal surface of the aortic endothelium. Whole-mount preparations of AoV were stained with anti-PECAM1 (red) and anti-CD45 (green) antibodies. Images represent a Z-stack reconstruction (150 images captured at 1.0-μm optical intervals). PECAM-1highCD45+ cells can be seen as yellow. (A) Isolated E11.5 AoV, luminal view. (B) Subluminal view of the same sample. Note that few PECAM-1highCD45+ (yellow) cells seen through the endothelial layer, in fact, are restricted to the luminal surface. (C) Zoom of A. Arrowhead indicates the cell most clearly distinguished as PECAM1highCD45+ in SI Movie 1. The images are representative of 12 samples. Isotype control staining is shown in SI Fig. 9.
Clonogenic Hematopoietic Progenitors Are Present in Both the Dorsal and Ventral Domains of E11.5 Aorta But Are Supported Only by the Ventral Microenvironment.
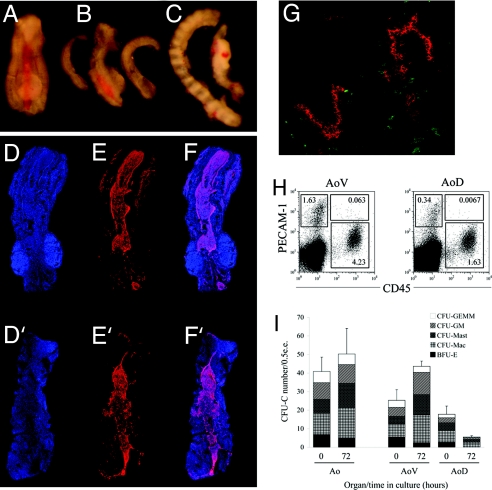
Given that hematopoietic cells are present in both dorsal and ventral domains of the Ao, we functionally investigated the dorsoventral distribution of in vitro hematopoietic progenitors (colony-forming units-culture, CFU-Cs) using the standard in vitro methylcellulose assay. We first measured the CFU-C content within the Ao and UGRs. To this end, the E11.5 Ao was separated from the UGRs (Fig. 5 A and B) and, after preparation of cell suspensions, assayed in the methylcellulose culture. We found that CFU-Cs within the E11.5 AGM region are predominantly concentrated in the Ao. The isolated E11.5 Ao harbored 41 ± 7.7 CFU-C, whereas the UGR contained only 18 ± 6.5 CFU-Cs (as assessed per 0.5 embryo equivalent, e.e.) (P < 0.03) (Fig. 5I and SI Table 1).
Fig. 5.
The E11.5 AoV, in contrast to AoD, is capable of autonomous CFU-C expansion. (A) Dissected E11.5 AGM region. (B) E11.5 AGM region subdissected into the Ao and UGRs. (C) Lateral view of the AoD and AoV after bisection along the midline of the E11.5 Ao (D–F) Z-stack reconstructions of bisected AoD.(D′–F′) Bisected AoV. (D and D′) DAPI (nuclear stain, blue). (E and E′) PECAM-1 (red). (F and F′) Merged images. (G) Transverse section through the E11.5 Ao after bisection along the midline, demonstrating the successful separation of dorsal and ventral domains. Hematopoietic (CD45+, green) and endothelial (PECAM-1+, red) components in both domains are clearly preserved. The ventral domain is oriented down, and the dorsal domain is oriented up. Image is representative of three independent experiments. Isotype control staining is shown in SI Fig. 10. (H) PECAM-1highCD45+ population of cells enriched for clonogenic progenitors are present in both the AoD and AoV. Plots are representative of three independent experiments. Dot plots represent ≈6 e.e. of viable (7-AAD−) cells. (I) Whole dorsal aorta (Ao), ventral (AoV), and dorsal (AoD) domains were assessed for the CFU-C activity before (0 h) and after (72 h) explant culture by using the colony-forming-unit methylcellulose (MC) assay. Leftmost bars show that the E11.5 Ao in isolation is capable of maintaining CFU-Cs in organ culture conditions Rightmost bars show that subdissected AoV expands the number of CFU-Cs after 72 h in culture; whereas the number of the CFU-Cs derived from the AoD is decreased after the culture. In each experiment, triplicate 35-mm dishes were inoculated with 0.5 e.e. of tissue; colonies were scored after 8 days. Error bars indicate SEM of three independent experiments. BFU-E, burst forming unit-erythroid; CFU, colony forming unit; Mac, macrophage; GM, granulocyte/macrophage; GEMM, granulocyte/erythroid/macrophage/megakaryocyte. e.e. indicates embryo equivalent of the tissue plated in MC culture per dish.
To examine the dorsoventral distribution of CFU-Cs, the E11.5 Ao was bisected along the midline, resulting in the separation of the organ into AoD and AoV domains (Fig. 5 C–G). Both the AoD and AoV contain large numbers of hematopoietic cells (1,286 ± 456 and 1,491 ± 867, respectively) (SI Table 2). Consistent with the observation that a larger number of intraaortic clusters are present on the ventral domain, flow cytometric data showed a predominant presence of HSC-enriched PECAM1highCD45+ cells in the AoV compared with AoD (Fig. 5H). In the methylcellulose assay, the absolute numbers of CFU-Cs present in the AoD and the AoV are not significantly different (18 ± 4.4 and 25 ± 5.7, respectively) (Fig. 5I and SI Table 1). On the basis of these data, a marked hematopoietic polarity along the dorsoventral axis of the E11.5 Ao is not obvious.
Because hematopoietic cells are highly migratory, direct assessment of CFU-C content in the AoD and the AoV may not give an accurate indication of their origin. Therefore, we examined the potential of the AoD and the AoV to develop CFU-Cs independently using an explant culture system as a model for the in vivo expansion of hematopoietic stem/progenitor cells (2, 4, 5, 16). In these culture conditions, the isolated E11.5 Ao is capable of a modest expansion of CFU-Cs (Fig. 5I and SI Table 3). However, when cultured separately, the AoD and the AoV perform very differently. The isolated AoD was unable to sustain CFU-Cs; a decrease in CFU-C number from 18 ± 4.4 to 5.4 ± 0.7 was observed during the 72-h culture period (Fig. 5I and SI Table 3). Of note, no BFU-E were maintained during culture, and CFU-GEMM were rarely present. In contrast, culture of isolated AoV for 72 h resulted in an increase in CFU-C number from 25 ± 5.7 to 44 ± 2.8 (Fig. 5I and SI Table 3) (P < 0.04), with all CFU-C types being preserved or expanded, suggesting a specific role for the AoV in the appearance of clonogenic hematopoietic progenitors.
Interestingly, despite the relatively even dorsoventral distribution of CFU-Cs in the Ao, the AoV has an exclusive and considerable capacity to expand CFU-Cs. Because CFU-Cs emerge in the embryo significantly earlier during development (19–21), it has yet to be established whether the AoV induces development of CFU-C locally or expands progenitors that have migrated to the region from elsewhere e.g., the yolk sac.
Similar analysis at earlier stage (E10.5) revealed no significant dorsoventral polarity in the capacity to maintain/ expand CFU-Cs in the Ao (data not shown).
Definitive HSCs Are Localized to the AoV.
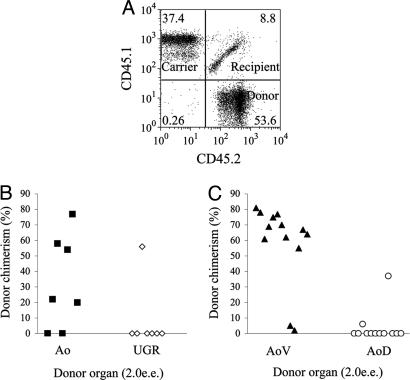
Development of CFU-Cs is not specific to AGM hematopoiesis because a large number of these progenitors originate from the early yolk sac and are disseminated through the peripheral circulation (20). Therefore, we turned to the analysis of definitive HSCs emerging in the AGM region. Consistent with previous observations, we found that the first emerging HSCs were localized almost exclusively to the E11.5 Ao but not to the UGR (5). Of seven mice that received cells from the Ao, five were successfully repopulated at 12 weeks after injection; in contrast, only one of seven mice that received transplants of UGR was repopulated (Fig. 6 A and B).
Fig. 6.
Dorsoventral polarity in HSC distribution in the E11.5 Ao. (A) Representative example of FACS analysis of long-term repopulation of irradiated recipient with AoV-derived HSCs. Cells prepared from subdissected regions of the AGM region of CD45.2/2 embryos were coinjected with CD45.1/1 bone marrow carrier/competitor cells into CD45.1/2 irradiated adult recipients. Donor contribution to recipient blood was determined by flow cytometry after anti-CD45.1/CD45.2 antibody staining. (B) Predominant localization of HSCs to the Ao in the E11.5 AGM region. Freshly isolated Ao and UGRs have been tested for the presence of HSCs by using a long-term repopulating assay. (C) Predominant localization of HSCs to the AoV in the E11.5 Ao: freshly isolated AoV and AoD were tested for the presence of HSCs by using the long-term repopulating assay. e.e. indicates embryo equivalent of the tissue transplanted per recipient. Each point represents percentage of donor chimerism to the peripheral circulation in an individual recipient mouse. Data are cumulative from three independent experiments.
To examine the dorsoventral distribution of HSCs, E11.5 Ao were bisected and cells prepared from either AoD or AoV injected into irradiated adult mice (2.0 e.e. per recipient). We found that HSCs are localized almost exclusively to the AoV (Fig. 6C): of 12 mice that received AoD only 1 mouse was reconstituted, whereas, of 13 mice transplanted with AoV, 11 were reconstituted (Fig. 6C).
AoV Is an Exclusive and Functional Niche for HSCs in the Developing Dorsal Aorta.
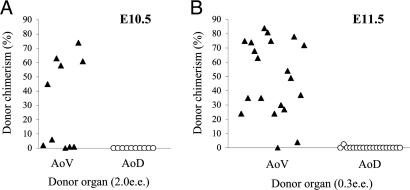
As shown above, HSCs are localized to the AoV, which is consistent with the idea of a ventral niche in the Ao. Although HSC localization is indicative, it does not alone provide proof for the functional importance of the AoV as a niche, given the migratory nature of hematopoietic cells. Therefore, we examined whether the AoV was able to induce/initiate the development of HSCs. To this end, we analyzed the E10.5 stage, at which high-level adult repopulating HSCs are generally absent (1–4). At E10.5, the AGM region is capable of an autonomous initiation of HSCs, as shown by ex vivo culture experiments (2). The E10.5 Ao was therefore bisected into AoD and AoV, cultured ex vivo for 72 h, and transplanted into irradiated adult recipients. Our results revealed the exclusive capacity of isolated AoV to initiate HSCs: 5 of 10 mice that received 2.0 e.e. of cultured E10.5 AoV were successfully reconstituted; in contrast, none of the 10 mice that received cells from AoD cultures demonstrated hematopoietic chimerism (Fig. 7A).
Fig. 7.
Dorsoventral polarity in HSC induction and expansion. (A) Exclusive initiation of HSCs by the E10.5 AoV but not the AoD. The capacity to initiate HSCs was tested in separated AoV and AoD after 72-h explant culture by using a long-term repopulating assay (2.0 e.e. per recipient). (B) Exclusive expansion of HSCs by E11.5 AoV but not by the AoD. The capacity to expand HSCs was tested in separated E11.5 AoV and AoD after 72-h explant culture by using the long-term repopulating assay (0.3 e.e. per recipient). This dose would repopulate the majority of mice only if HSC expansion had occurred (4). Each point represents an individual recipient mouse. Each data set is cumulative of three to five independent experiments. e.e. indicate embryo equivalent of the tissue transplanted per recipient.
By E11.5, the AGM region contains ≈1 HSC (4) and is capable of an autonomous expansion of HSC numbers (2, 5). We therefore tested the capacity of isolated E11.5 AoD and AoV explants to expand HSCs. After 72 h of culture, small fractions of AoD and AoV were transplanted into adult irradiated mice (0.3 e.e. per recipient). The AoV demonstrated a robust capacity to expand HSCs: 18 of the 20 mice that received cultured AoV were successfully repopulated (Fig. 7B). In contrast, none of the 20 mice that received cultured AoD transplants were repopulated (Fig. 7B).
Discussion
The AGM region plays an important role in the development of definitive HSCs in the mammalian embryo (2, 4–6). It has an autonomous capacity to generate HSCs in culture conditions before colonization of the fetal liver (2). Within the AGM region, the first HSCs emerge in the Ao (22). Hematopoietic clusters attached to the ventral aortic endothelium have been observed in various vertebrate species, leading to speculation that definitive hematopoiesis originates ventrally in the Ao (7–10). Recent publications suggested a ventral subendothelial origin for definitive HSCs (11, 12); however, an endothelial origin of HSCs cannot be ruled out (12, 15, 16). Of note, in addition to commonly observed ventral clusters, we found that intraaortic hematopoietic clusters in the mouse embryo, although with lower frequency, are also attached to the lateral and dorsal luminal surfaces of the E11.5 Ao.
To investigate the dorsoventral polarity in HSC development, we bisected Ao into the AoD and AoV and assessed the presence of CFU-Cs and HSCs using functional assays. Given the migratory nature of hematopoietic cells, this approach may not necessarily indicate the precise origin of these cells. Therefore, we also exploited an explant culture system previously used to model generation of HSCs in the embryo to assess the potential of AoD and AoV to support CFU-C and HSC activities (2, 4).
Interestingly, we found that CFU-C content within the AoD and the AoV is not considerably different. However, these two domains have significantly different capacities to support and expand CFU-Cs. The number and lineage differentiation capacity of CFU-Cs after culture of AoD is dramatically reduced as compared with CFU-Cs supported by the AoV where they undergo expansion.
Another indication that the AoV is distinctly involved in development of the definitive hematopoietic system came from measurement of the HSC content in the E11.5 AoD and the AoV by using the long-term repopulation assay. We found that an absolute majority of HSCs were located within the AoV. Finally, critically important evidence came from the explant culture assay. We found that at E10.5, when HSCs have not yet emerged in vivo, the AoV, but not AoD, has an exclusive autonomous capacity to initiate HSCs. Furthermore, by E11.5, when the first HSCs appear in the AGM region in vivo, only the AoV, but not AoD, is capable of expansion of HSCs. These data demonstrate that the AoV plays an important role in the generation of HSCs. Recent publications propose both an endothelial and subendothelial/mesenchymal origin of HSCs in the AGM region (6, 11, 12, 23); however, the exact identity of cells in the AoV that give rise to HSCs is yet to be established. None of the published data rule out a possibility that the ancestors that develop into functional HSCs migrate to the AoV from the yolk sac (24–26).
In summary, we demonstrate a dorsoventral polarity for the generation of definitive HSCs within the AGM region. We directly show a functional association of HSC development with the ventral floor of the Ao. Our data indicate that all elements required for the initiation and expansion of HSCs are present in the AoV and cumulatively constitute a functional niche for HSC development.
Materials and Methods
Mice.
C57BL/6xCBA F1 mice were housed and bred in animal facilities at the University of Edinburgh. Donor tissues from CD45.2/CD45.2 embryos were isolated and transplanted into irradiated CD45.1/CD45.1 or CD45.1/CD45.2 adult recipients (≥6 weeks of age) as described (4). The day of discovery of the vaginal plug was designated as day 0.5. Embryos were scored according to Thelier criteria [for example, E11.0–E11.5 (41–47 somite pairs) is equal to stages 18 and 19] (http://genex.hgu.mrc.ac.uk/intro.html). Animals were kept in compliance with Home Office regulations.
AGM Dissection.
The AGM region was dissected from E10.5–E11.5 embryos into 7% FCS/PBS by using sharpened tungsten needles with the aid of a dissecting microscope. For the isolation of ventral and dorsal aspects of the dorsal aorta/paraaortic mesenchyme (Ao) the Ao from the E10–E11.5 AGM region was dissected free from the embryo proper. By using the remnants of the mesentery, somites and notochord, as anatomical landmarks, the AoV and AoD, respectively, could be clearly identified. AoV and AoD were separated along the midline of the Ao and immediately placed in separate dishes.
Microscopy.
Images of dissected tissues were captured by using a MZFLIII dissecting microscope (Leica, Bannockburn, IL) and a Digital Sight DS-L camera (Nikon, East Rutherford, NJ). Images were prepared by using Adobe Photoshop (Adobe Systems, Mountain View, CA). To produce transverse sections, E11.5 AGM region was snap-frozen in O.C.T compound (BDH Gurr, Poole, U.K.) on dry ice; 10-μm sections were produced by using a CM1900 cryostat (Leica). Sections were transferred to polysine-coated slides and air-dried for 1 min and then stored at −20°C. Frozen sections were allowed to equilibrate to room temperature and were then fixed in 100% acetone (−20°C) for 2.5 min and then air-dried for another 2.5 min. Blocking solution (PBS containing 5% FCS) was added to sections for 15 min at room temperature. Sections were then washed with one change of PBS. PE-conjugated anti-PECAM-1 (clone MEC 13.3; BD Biosciences, Franklin Lakes, NJ) and APC-conjugated anti-CD45 (clone 30-F11; BD Biosciences) monoclonal antibodies, diluted in 7% FCS/PBS, were added to sections and incubated for 30 min in the dark. Staining solution was removed and replaced by three changes of PBS; each wash lasted 5 min. Appropriate isotype control antibodies were used as required. Sections were finally mounted in a drop of VECTASHIELD hard set medium (Vector Laboratories, Burlingame, CA). Number 1.5 glass coverslips (BDH) were used. Mounted slides were allowed to harden according to the manufacturer's instructions. Images were captured by using an inverted confocal microscope (DM IRE2; Leica) and prepared by using Adobe Photoshop.
Ex Vivo Culture.
E10.5–E11.5 AoD and AoV were placed on separate 0.65-μm Durapore filters (Millipore, Bedford, MA) at the gas–liquid interface above 5.0-ml Methocult medium (M5300; Stem Cell Technologies, Vancouver, BC, Canada). After 72 h of culture, organs were removed, and cellular suspensions were produced as described (16).
Clonogenic Myeloid Progenitor (CFU-C) Assay.
Cells from either fresh or cultured organs were cultured in methylcellulose medium (M3434; Stem Cell Technologies) according to the manufacturer's instructions. Hematopoietic colonies were counted and scored after 8 days of culture.
In Vivo Repopulation Assay.
Transplantation experiments were set up as described (4). The number of transplanted embryonic cells is expressed throughout the article in embryo equivalents (e.e.), defined as a unit of cells equivalent to the number present in one organ. Fresh or cultured embryonic cells were cotransplanted with 20,000 adult bone marrow carrier cells, to ensure short-term survival of the mice (4). Only mice demonstrating ≥5% peripheral blood leukocyte chimerism after 12 weeks were considered to be successfully reconstituted.
Flow Cytometry.
Contribution to hematopoietic reconstitution was assessed 12 weeks after injection by using a FACScalibur flow cytometer (Beckton Dickinson). Peripheral blood from recipient mice was obtained by bleeding from the lateral tail vein and collected into 500-μl EDTA/PBS (200 μg/ml). After red cell depletion by using PharM Lyse (BD Bioscience), cells were stained on ice by using anti-CD45.1 (clone A20) and anti-CD45.2 (clone 104) monoclonal antibodies conjugated with PE and FITC, respectively. Appropriate isotype controls were used. Dead cells were excluded by using 7-AAD. All reagents were purchased from eBioscience (San Diego, CA).
Supplementary Material
Supporting Information
Acknowledgments
We thank Evangelos Stamateris for preparation of histological sections; Clare Blackburn, Ruby Gribi, David Hills, and Val Wilson for useful comments; and John Verth, Yvonne Gibson, and Carol Manson for animal management. This work was supported by the Medical Research Council, the Leukaemia Research Fund, the Stem Cell Research Foundation, and the European Union Sixth Framework Programme (FPVI) integrated project EuroStemCell.
Abbreviations
AGM region
aorta-gonad-mesonephros region
Ao
dorsal aorta
AoD
dorsal domain of the Ao
AoV
ventral domain of the Ao.
Footnotes
The authors declare no conflict of interest.
This article is a PNAS Direct Submission.
References
- 1.Muller AM, Medvinsky A, Strouboulis J, Grosveld F, Dzierzak E. Immunity. 1994;1:291–301. doi: 10.1016/1074-7613(94)90081-7. [DOI] [PubMed] [Google Scholar]
- 2.Medvinsky A, Dzierzak E. Cell. 1996;86:897–906. doi: 10.1016/s0092-8674(00)80165-8. [DOI] [PubMed] [Google Scholar]
- 3.Gekas C, Dieterlen-Lievre F, Orkin SH, Mikkola HK. Dev Cell. 2005;8:365–375. doi: 10.1016/j.devcel.2004.12.016. [DOI] [PubMed] [Google Scholar]
- 4.Kumaravelu P, Hook L, Morrison AM, Ure J, Zhao S, Zuyev S, Ansell J, Medvinsky A. Development (Cambridge, UK) 2002;129:4891–4899. doi: 10.1242/dev.129.21.4891. [DOI] [PubMed] [Google Scholar]
- 5.de Bruijn MF, Speck NA, Peeters MC, Dzierzak E. EMBO J. 2000;19:2465–2474. doi: 10.1093/emboj/19.11.2465. [DOI] [PMC free article] [PubMed] [Google Scholar]
- 6.de Bruijn MF, Ma X, Robin C, Ottersbach K, Sanchez M-J, Dzierzak E. Immunity. 2002;16:673–683. doi: 10.1016/s1074-7613(02)00313-8. [DOI] [PubMed] [Google Scholar]
- 7.Dieterlen-Lievre F, Martin C. Dev Biol. 1981;88:180–191. doi: 10.1016/0012-1606(81)90228-1. [DOI] [PubMed] [Google Scholar]
- 8.Medvinsky AL, Gan OI, Semenova ML, Samoylina NL. Blood. 1996;87:557–566. [PubMed] [Google Scholar]
- 9.Garcia-Porrero JA, Godin IE, Dieterlen-Lievre F. Anat Embryol. 1995;192:425–435. doi: 10.1007/BF00240375. [DOI] [PubMed] [Google Scholar]
- 10.Tavian M, Coulombel L, Luton D, Clemente HS, Dieterlen-Lievre F, Peault B. Blood. 1996;87:67–72. [PubMed] [Google Scholar]
- 11.Bertrand JY, Giroux S, Golub R, Klaine M, Jalil A, Boucontet L, Godin I, Cumano A. Proc Natl Acad Sci USA. 2005;102:134–139. doi: 10.1073/pnas.0402270102. [DOI] [PMC free article] [PubMed] [Google Scholar]
- 12.North TE, de Bruijn MF, Stacy T, Talebian L, Lind E, Robin C, Binder M, Dzierzak E, Speck NA. Immunity. 2002;16:661–672. doi: 10.1016/s1074-7613(02)00296-0. [DOI] [PubMed] [Google Scholar]
- 13.Kim I, Yilmaz OH, Morrison SJ. Blood. 2005;106:903–905. doi: 10.1182/blood-2004-12-4960. [DOI] [PMC free article] [PubMed] [Google Scholar]
- 14.Fraser ST, Ogawa M, Yokomizo T, Ito Y, Nishikawa S. Dev Growth Differ. 2003;45:63–75. doi: 10.1046/j.1440-169x.2003.00675.x. [DOI] [PubMed] [Google Scholar]
- 15.Nishikawa SI, Nishikawa S, Kawamoto H, Yoshida H, Kizumoto M, Kataoka H, Katsura Y. Immunity. 1998;8:761–769. doi: 10.1016/s1074-7613(00)80581-6. [DOI] [PubMed] [Google Scholar]
- 16.Taoudi S, Morrison AM, Inoue H, Gribi R, Ure J, Medvinsky A. Development (Cambridge, UK) 2005;132:4179–4191. doi: 10.1242/dev.01974. [DOI] [PubMed] [Google Scholar]
- 17.Jaffredo T, Gautier R, Eichmann A, Dieterlen-Lievre F. Development (Cambridge, UK) 1998;125:4575–4583. doi: 10.1242/dev.125.22.4575. [DOI] [PubMed] [Google Scholar]
- 18.Oberlin E, Tavian M, Blazsek I, Peault B. Development (Cambridge, UK) 2002;29:4147–4157. doi: 10.1242/dev.129.17.4147. [DOI] [PubMed] [Google Scholar]
- 19.Moore MA, Metcalf D. Br J Haematol. 1970;18:279–296. doi: 10.1111/j.1365-2141.1970.tb01443.x. [DOI] [PubMed] [Google Scholar]
- 20.Palis J, Robertson S, Kennedy M, Wall C, Keller G. Development (Cambridge, UK) 1999;126:5073–5084. doi: 10.1242/dev.126.22.5073. [DOI] [PubMed] [Google Scholar]
- 21.Wong PM, Chung SW, Chui DH, Eaves CJ. Proc Natl Acad Sci USA. 1986;83:3851–3854. doi: 10.1073/pnas.83.11.3851. [DOI] [PMC free article] [PubMed] [Google Scholar]
- 22.de Bruijn MF, Peeters MC, Luteijn T, Visser P, Speck NA, Dzierzak E. Blood. 2000;96:2902–2904. [PubMed] [Google Scholar]
- 23.North T, Gu TL, Stacy T, Wang Q, Howard L, Binder M, Marin-Padilla M, Speck NA. Development (Cambridge, UK) 1999;126:2563–2575. doi: 10.1242/dev.126.11.2563. [DOI] [PubMed] [Google Scholar]
- 24.Weissman I, Pappaioannou V, Gardner R. In: Clarkson B, Marks PA, Till JE, editors. Cold Spring Harbor, NY: Cold Spring Harbor Lab Press; 1978. pp. 33–47. [Google Scholar]
- 25.Toles JF, Chui DH, Belbeck LW, Starr E, Barker JE. Proc Natl Acad Sci USA. 1989;86:7456–7459. doi: 10.1073/pnas.86.19.7456. [DOI] [PMC free article] [PubMed] [Google Scholar]
- 26.Yoder MC, Hiatt K, Dutt P, Mukherjee P, Bodine DM, Orlic D. Immunity. 1997;7:335–344. doi: 10.1016/s1074-7613(00)80355-6. [DOI] [PubMed] [Google Scholar]
Associated Data
This section collects any data citations, data availability statements, or supplementary materials included in this article.
Supplementary Materials
Supporting Information

