Validation of Tissue Microarrays for Immunohistochemical Profiling of Cancer Specimens Using the Example of Human Fibroblastic Tumors (original) (raw)
Abstract
Tissue microarrays allow high-throughput molecular profiling of cancer specimens by immunohistochemistry. Phenotype information of sections from arrayed biopsies on a multitissue block needs to be representative of full sections, as protein expression varies throughout the entire tumor specimen. To validate the use of tissue microarrays for immunophenotyping, we studied a group of 59 fibroblastic tumors with variable protein expression patterns by immunohistochemistry for Ki-67, p53, and the retinoblastoma protein (pRB). Data on full tissue sections were compared to the results of one, two, and three 0.6-mm core biopsies per tumor on a tissue array. Ki-67 and p53 staining was read as two categories (positive or negative). Concordance for this staining between tissue arrays with triplicate cores per tumor and full sections were 96 and 98%, respectively. For pRB staining was read as three categories (high, moderate, or negative), where concordance was 91%. The use of three cores per tumor resulted in lower numbers of lost cases and lower nonconcordance with standard full sections as compared to one or two cores per tumor. Correlations between phenotypes and clinical outcome were not significantly different between full section and array-based analysis. Triplicate 0.6-mm core biopsies sampled on tissue arrays provide a reliable system for high-throughput expression profiling by immunohistochemistry when compared to standard full sections. Triplicate cores offer a higher rate of assessable cases and a lower rate of nonconcordant readings than one or two cores. Concordance of triplicate cores is high (96 to 98%) for two category distinction and decreases with the complexity of the phenotypes being analyzed (91%).
Tissue microarrays allow for high-throughput molecular profiling of tissue specimens by several techniques, including immunohistochemistry (IHC). 1 Standard IHC on full sections of paraffin-embedded cancer specimens is useful for identification of molecular markers that predict patient outcome. 2-4 Tissue microarrays may be useful for investigating a large number of different molecules potentially involved in solid tumor development and/or progression 5 and for determining their role in disease characterization and prediction of patient outcome. Currently, limited data exist on validation of tissue microarrays in breast and prostate cancer. 1,6 It is strongly suggested that tumors with prominent intratumor heterogeneity need verification of data generated by tissue microarray analysis. 1
The significance of IHC data derived from tissue microarrays—comprised of small core biopsies of cancer specimens—relative to full section IHC has not been clearly determined. Based on the small size of tissue cores (0.6 mm) taken from paraffin-embedded tumor specimens heterogeneous expression patterns of investigated proteins could lead to significant differences in results between the two techniques. The number of tissue cores per tumor specimen required on an array to reduce the error rate attributable to tissue heterogeneity and to maintain efficient processing of tissues remains to be determined. It seems reasonable that this error rate may be reduced by using multiple tissue cores per specimen, a hypothesis that we tested in this study.
Cut-off values established for full section IHC may not be useful for assessment based only on a 0.6-mm tissue sample; eg, Ki-67 nuclear staining in >20% of tumor nuclei of full sections is frequently considered to be a high proliferative index. 2 Most standard IHC stains result in readings that distinguish between positive (+) and negative (−) categories, whereas others have a higher degree of complexity requiring the distinction between three different categories; eg, pRB: high (++), intermediate (+), and negative (−). The effect of staining complexity on tissue array-derived data may also lead to different concordance rates relative to full tissue sections.
In an effort to validate the tissue array technique, we conducted a study that defined the concordance of single, duplicate, and triplicate 0.6-mm core biopsies on tissue arrays in comparison to full section analysis. We arrayed a cohort of 59 human fibroblastic tumors known to have heterogeneous expression of investigated proteins and analyzed abnormalities in expression of Ki-67, p53, and pRB by IHC. Readings of full sections were compared with readings of three independent core biopsies per specimen sampled on one tissue microarray. The impact of data discrepancies between the two methods with regard to patient outcome was also evaluated.
Materials and Methods
Patients
The cohort analyzed consisted of 59 patients with fibroblastic neoplasms that included desmoid tumors (n = 24), low-grade (n = 21) and high-grade fibrosarcomas (n = 14) treated and followed at Memorial Sloan-Kettering Cancer Center between August 1982 and January 1999. Median age of the cohort was 40 years (range, 10 to 86 years). Median follow-up for the entire group was 36 months. Twenty-seven patients from all three groups developed local recurrence, whereas 10 fibrosarcoma patients developed metastasis. At last follow-up 41 patients had no evidence of disease, eight were alive with disease, nine died of disease, and one died of other causes. Recurrence-free and overall survival were defined as time from primary tumor resection to first recurrence (either local or distant) or death from disease, respectively. Median recurrence-free survival was 18 months and median overall survival was 35 months.
Tissues, Array Construction, and IHC
Normal and tumor tissues were embedded in paraffin and five-μm sections stained with hematoxylin and eosin were obtained to identify viable, morphologically representative areas of the specimen from which core biopsies were taken. This was done with a precision instrument (Beecher Instruments, Silver Spring, MD) as previously described. 1 From each specimen triplicate tissue cores with a diameter of 0.6 mm were punched and arrayed on a recipient paraffin block. Five-μm sections of these tissue array blocks were cut and placed on charged polylysine-coated slides. These sections were used for immunohistochemical analysis. 7 Tissues and cell lines known to express the antigens under study were used as positive controls. Arrayed normal tissues served as baseline controls. All normal tissue samples showed physiological expression patterns of the analyzed markers.
Sections from paraffin-embedded tissue were deparaffinized, treated with 1% H2O2 in phosphate-buffered saline, and submitted to antigen retrieval by microwave oven treatment for 15 minutes in 0.01 mmol/L citrate buffer at pH 6.0. This procedure was performed for all antibodies under study. For MIB-1 antibody, an additional step of incubation in preheated 0.05% Trypsin, 0.05% CaCl2 in Tris-HCl (pH 7.6) for 5 minutes at 37°C before microwave treatment was performed. Slides were subsequently incubated in 10% normal horse serum for 30 minutes followed by appropriately diluted primary antibody incubation overnight at 4°C. Mouse anti-human monoclonal antibodies to p53 (1:500, Ab-2, clone 1801; Calbiochem, Cambridge, MA), pRB (1.28 μg/ml; clone 3c8; QED Bioscience, San Diego, CA), and Ki-67 (1:50, Mib-1; Immunotech, Marseille, France) were used. The anti-p53 antibody detects wild-type and mutated p53, whereas the anti-pRB antibody detects normal and hyperphosphorylated pRB products (manuscript in preparation). 8 The antibody for Ki-67 recognizes epitopes from human recombinant peptides of the Ki-67 protein. Samples were then incubated with biotinylated anti-mouse immunoglobulins at 1:500 dilution (Vector Laboratories, Inc., Burlingame, CA) at room temperature for 30 minutes followed by avidin-biotin peroxidase complexes (1:25, Vector Laboratories, Inc.) for 30 minutes. Diaminobenzidine was used as the chromogen and hematoxylin as the nuclear counterstain.
Immunoreactivities were classified as a continuum data (undetectable levels or 0% to homogeneous staining or 100%) for all three markers. Slides were reviewed by three investigators (CCC, AH, MU) and results were scored by estimating the percentage of tumor cells showing characteristic staining. The cut-off values used in this study have been shown to be highly sensitive 2-4 and were defined as follows: 1) high proliferative Ki-67 index if >20% tumor nuclei stained, 2) p53 nuclear overexpression if >10% tumor nuclei stained. For pRB no cut-off value was defined. Tumors were then grouped into two categories defined as follows: normal expression (neoplasms below defined cut-off value of immunoreactivity in tumor cells) and abnormal expression (neoplasms above defined cut-off values of immunoreactivity in tumor cells).
Validation of Tissue Arrays
Full sections from tumor blocks and sections from the tissue array containing three representative core biopsies per tumor block were read in a blinded manner and later compared to one another. Single readings from each core were obtained and evaluated as three separate experiments. Also, cumulative values were established summarizing the results from two and three core readings. All possible combinations of cores taken from one specimen were evaluated. Concordance criteria between full sections and cumulative values of tissue cores were as follows: if three cores per specimen were available for reading either three or two cores matching the full section were sufficient to define the case as a match; if only two cores were available for reading both had to match the full section to define the case as a match.
Two different analyses were performed. First, we simulated the construction of three tissue arrays containing either one, two, or three cores per specimen by assembling one tissue array with three physically separated cores per specimen. We then compared the accuracy of each of these arrays to the full tissue section. For single core analysis we excluded cases in which cores were lost during sectioning and staining. For two and three core analyses the following case exclusions were made: cases in which there were two cores available and two different IHC readings were obtained, cases in which only one core was available and cases in which all cores were lost. These were described but not included in the analysis. All three scenarios were evaluated for numbers of cases lost from the analysis because of tissue loss or inconclusive data, and for concordance (percent matches of evaluated cases). Average values were obtained from three single cores in the one-core analysis and from the three possible combinations of two cores per specimen in the two-core analysis. For the triplicate core analysis all three cores were used to obtain a single value. This analysis demonstrated the importance of triplicate cores to keep numbers of lost cases as low and concordance rates as high as possible. Second, based on the first analysis, the specific details of a triplicate core tissue array were evaluated (summarized in Table 1 ▶ ).
Table 1.
Characteristics of a Tissue Microarray Containing Triplicate Cores per Tumor Specimen in Comparison to Full Tissue Sections
| Marker | Assessable cores | Concordance | Triplicate assessment | Overall concordance | ||
|---|---|---|---|---|---|---|
| No. cases | Match | % | ||||
| Ki-67, n = 59 | ••• | 39 | ••• | 65 | Match | Total evaluated: 53 |
| n = 47 | 6 | ••○ | 10 | Match | ||
| 2 | •○○ | 4 | Mismatch | |||
| – | ○○○ | – | Mismatch | |||
| •• | 6 | •• | 10 | Match | Match: 51/53 = 96% | |
| n = 7 | 1 | •○ | 2 | N/A | ||
| – | ○○ | – | Mismatch | |||
| • | 3 | • | 5 | N/A | ||
| n = 3 | – | ○ | – | N/A | ||
| Lost | 2 | – | 4 | N/A | ||
| n = 2 | ||||||
| p53, n = 59 | ••• | 37 | ••• | 63 | Match | Total evaluated: 49 |
| n = 38 | – | ••○ | – | Match | ||
| – | •○○ | – | Mismatch | |||
| 1 | ○○○ | 2 | Mismatch | |||
| •• | 11 | •• | 18 | Match | Match: 48/49 = 98% | |
| n = 11 | – | •○ | – | N/A | ||
| – | ○○ | – | Mismatch | |||
| • | 9 | • | 15 | N/A | ||
| n = 9 | 0 | ○ | – | N/A | ||
| Lost | 1 | – | 2 | N/A | ||
| n = 1 | ||||||
| pRB, n = 59 | ••• | 23 | ••• | 39 | Match | Total evaluated: 47 |
| n = 31 | 6 | ••○ | 10 | Match | ||
| 1 | •○○ | 2 | Mismatch | |||
| 1 | ○○○ | 2 | Mismatch | |||
| •• | 14 | •• | 23 | Match | Match: 43/47 = 91% | |
| n = 17 | 1 | •○ | 2 | N/A | ||
| 2 | ○○ | 4 | Mismatch | |||
| • | 6 | • | 10 | N/A | ||
| n = 6 | – | ○ | – | N/A | ||
| Lost | 5 | – | 8 | N/A | ||
| n = 5 |
Statistical Analysis
The association between full section analysis and tissue microarrays was studied using kappa statistics. 9 Kappa values >0.7 were considered to express a strong association between the two methods. Survival analysis was performed by the method of Kaplan-Meier 10 and statistical significance (P < 0.05) of outcome comparisons were evaluated using the log-rank test. 11
Results
Number of Cores per Specimen
IHC readings from single cores were compared to cumulative values from two and three cores simulating the situation of tissue arrays constructed with only one core, two cores, or three cores per tumor specimen. These were then compared to the full tissue section. Examples are shown in Figure 1 ▶ . Numbers of cases lost from the analysis were either because of tissue loss or inconclusive data coming from two available cores with different readings. The rates of lost cases for the single core array were 10, 18, and 25% for Ki-67, p53, and pRB, respectively. These rates were 17, 30, and 37% with two evaluated cores. The rates for two-core analysis include cases in which both cores were lost as well as cases in which only one core was lost because the remaining core was insufficient to reflect the information for both. The combination of data taken from two experiments had an additive effect on the number of excluded cases in that analysis. For three-core analysis these rates were at 10, 17, and 20%, respectively. The reduced rate of lost cases was because of the availability of the third core allowing a majority decision in problematic cases (2 > 1). Disagreements between duplicate cores from one specimen were more common for two-core analysis (Ki-67, 13%; pRB, 8%) than for cases from the three-core analysis, in which one of the three was lost (2% each for Ki-67 and pRB). This may be attributable to statistical variation. No such disagreement was seen for p53 because there was only one mismatch case in that analysis. Nonconcordance (percent mismatches of evaluated cases) was the lowest for three cores (Ki-67, 3.7%; pRB, 6.4%) versus two cores (4.4%, 6.5%) and one core alone (9.4%, 11.4%). For p53 these rates were uniformly 2% because of only one nonconcordant case. Taken together, this demonstrates the importance of triplicate cores to keep numbers of lost cases as low and concordance rates as high as possible. Based on this analysis the specific details of a triplicate core tissue array were evaluated.
Figure 1.
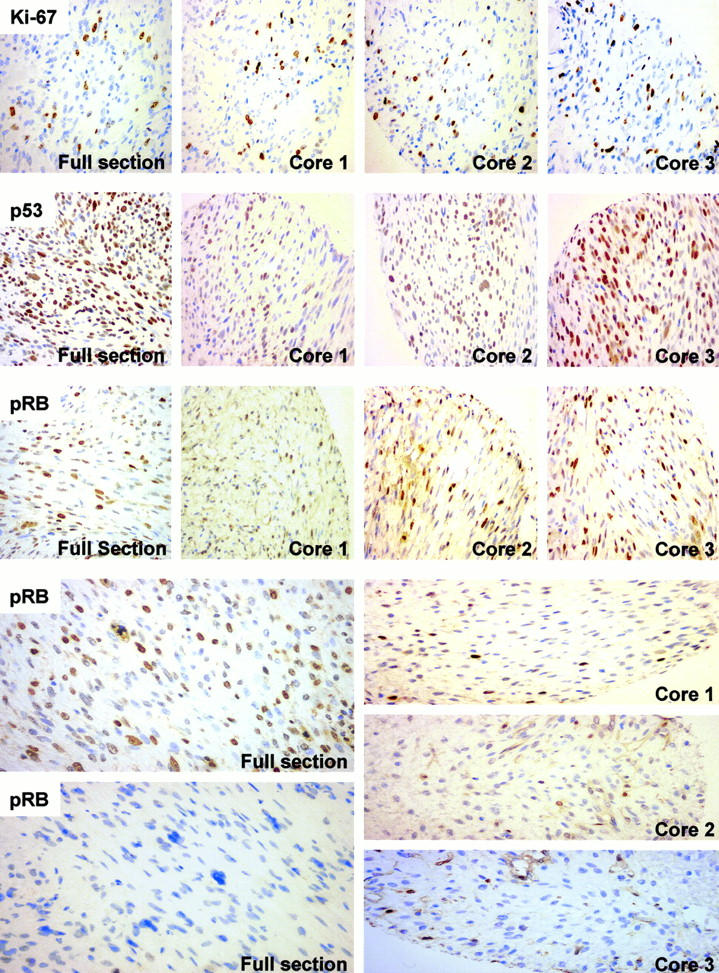
Representative photomicrographs of immunophenotypes of Ki-67, p53, and pRB in 59 fibroblastic tumors. A direct comparison between expression patterns on full tissue sections to the three core biopsies taken from the same tissue block (quarter cores depicted) is shown. Ki-67: Overexpression of Ki-67 nuclear antigen in a fibrosarcoma with consistent distribution of positive tumor nuclei on full section and array. p53: Tumor nuclei in a fibrosarcoma positive for p53 staining, giving consistent positive readings for full section and array. pRB: Accumulation of hyperphosphorylated pRB in the nuclei of a fibrosarcoma consistently read as high levels (++) in all four examples. Below a case of heterogeneous expression of pRB characterized by highly positive (++) and completely negative areas (−) from the same full section (left). Triplicate cores taken from this case were read as moderately positive, representing the normal phenotype of pRB (+). This is the only case in the analysis of pRB in which all three available readings from the tissue array showed a mismatch compared to the full section (see Table 1 ▶ ). All photomicrographs are shown at an original magnification of ×400.
Evaluation of Triplicate Core Tissue Array Specifics
Ki-67 Proliferative Index
Fifty-three of 59 cases (90%) on the tissue array were assessable because six cases were excluded because of tissue loss or inconclusive readings between two cores. High Ki-67 proliferative index was found in 18 of these 53 cases (34%) but was not detected in 35 cases (66%) using standard full-section IHC. In comparison, high proliferative index was read slightly less frequently from the tissue array from which 16 cases (30%) were considered to show overexpression (>20% nuclear staining) whereas 37 (70%) were read as normal. Overall, the nonconcordance between full sections and tissue array was 4% (two cases). In 10% of cases the concordance was because of two cores displaying the same pattern as the full section and one core showing a different pattern. These data demonstrate reliable readings from a triplicate core array in 96% of the assessable cases (Table 1) ▶ . The two methods showed a strong statistical association (kappa value, 0.874).
p53 Nuclear Overexpression
p53 protein half-life is short and expression levels are low in normal cells and therefore IHC cannot detect these normal p53 levels. In cancer cells, most p53 mutations lead to products that are not ubiquitinated, accumulate in the nuclei, and can be demonstrated by IHC. Because of tissue loss or inconclusive readings between two cores, 49 of 59 cases (83%) were assessable. Five cases (10%) showed nuclear staining >10% of tumor nuclei, whereas 44 cases (90%) were negative on full section analysis. In comparison, four cases (8%) were read as positive and 45 cases as negative (92%) on the array. Overall, the nonconcordance was 2% (one case) for a concordance of 98% among the assessable cases (Table 1) ▶ . A strong statistical association between full sections and array for p53 IHC was also demonstrated (kappa value, 0.878).
pRB Expression Patterns
Genetic alterations of RB are either deletions or point mutations. Patterns of expression of pRB have been classified as wild type when low nuclear staining is observed (+), and abnormal when undetectable (because of genetic deletion/mutation) (−) or when producing high nuclear staining (mainly because of nonactive, hyperphosphorylated proteins) (++). All three phenotypes of RB were observed in this study and were evaluated as three categories for the array validation. Because of tissue loss or inconclusive readings between two cores, 47 of 59 cases (80%) were assessable. Twenty-two cases (47%) were read as abnormal and 25 (53%) as normal based on full section and tissue array analysis. These numbers include four mismatches (nonconcordance 9%), two occurring in the abnormal and two in the normal category, and therefore leading to equal counts in both categories. A strong statistical association between both methods was also seen for this stain (kappa value, 0.853). For clinicopathological correlation of data three category readings were grouped in two functional categories: normal (wild type) and abnormal (deleted/mutated or hyperphosphorylated) (see below).
Clinicopathological Correlations
To identify differences in clinicopathological correlations between the data generated with the two methods we independently analyzed both data sets with regard to their predictive value for patient outcome. The comparison of molecular data to patient outcome displayed a significant association between recurrence-free and overall survival and overexpression of Ki-67 if full sections were used (P = 0.03, P = 0.03). These associations remained significant if the tissue array-derived data were used (P = 0.01, P = 0.01).
Discussion
Tissue microarrays are useful tools for the rapid and efficient analysis of large numbers of paraffin-embedded tissues. 1 Tissue core biopsies of 0.6-mm diameter are taken from representative areas of paraffin-embedded tissues and are arrayed on one recipient block. The diameter of these cores is large enough to assess histomorphology and analyze expression of molecules at the DNA, mRNA, or protein level. 1,12-14 Certain phenotypes in cancer tissues, analyzed by IHC have been correlated with patient outcome. 2,3,15 Cancer tissues frequently reveal heterogeneous expression patterns of investigated molecules throughout the specimen on standard full sections. For analysis correlating IHC and clinical data cut-off values have been established to define the rate of positive cells relevant to tumor biology. 2,3,15 However, these values are based on assessment of an entire tissue section encompassing thousands of cells. To facilitate high-throughput analysis, 0.6-mm core biopsies on tissue arrays contain only a small fraction of the cells from one particular tissue block. Our concern was that tissue heterogeneity could hinder the ability of tissue arrays to substitute for full tissue sections. Therefore, we designed this study to directly compare IHC readings from standard full sections to a tissue array containing three representative and physically separated cores per specimen. Independent evaluation of three data sets per specimen allowed us to simulate the situation of tissue arrays containing either one, two, or three cores per specimen.
We used well characterized antibodies against Ki-67 and p53 that require a distinction between two categories (+ or −) and a pRB antibody that requires a distinction between three categories (manuscript in preparation) 8 (Figure 1) ▶ . Thus, we investigated the potential adverse impact that staining complexity might have on the accuracy of IHC data generated from tissue arrays. In addition, these markers were chosen because of their relevance in human cancer development and our extensive previous experience. 5,7,16 IHC was done on a group of 59 fibroblastic tumors known to show heterogeneous expression patterns for Ki-67, p53, and pRB. 2,3,15,17 Processing of tissue sections from both tumor blocks and arrays was based on previously established protocols as they can have significant influence on the results (see Materials and Methods).
Our first analysis comparing one, two, and three cores per specimen demonstrated a higher number of lost cases and lower concordance with the full section reading for one or two cores per case in comparison to three cores. Tissue loss is a significant factor for tissue array-based analysis with previously reported rates of tissue damage ranging from 15 to 33%. 6,12,13 Our data show that the presence of a third core reduces the risk of losing the case because of tissue damage. Nonconcordance was the lowest for three cores identified as 4, 2, and 9% for Ki-67, p53, and pRB, respectively. This again shows the importance of the third core because three cores allow a majority decision (2 > 1) if one core differs from the other two. Taken together, three cores provide a relatively high concordance compared to only one core and reduce the problems of higher case loss that is seen with two cores. Thus, three cores per specimen increase both the accuracy and the strength of array-based data.
Theoretically, accuracy levels would probably rise with the use of more than three cores per specimen. However, from a practical point of view it is desirable to identify the minimal number of cores necessary to obtain highly accurate results from tissue arrays and allow the most economic processing of the tissues without the need to array a larger number of cores per tumor specimen. The high accuracy achieved with triplicate cores for stains that require two-category distinction suggests that this may be a useful setup for routine application of tissue microarrays.
Based on this information we further evaluated the three-core tissue array. The reduction of assessable cases because of tissue loss during cutting and transfer of array sections and vigorous staining procedures or because of inconclusive data derived from two cores with different readings was 10, 17, and 20% for Ki-67, p53, and pRB, respectively. Other groups reported similar or higher rates of tissue loss. 6,12-14 Cases were excluded if all three cores were lost and if only one core or two cores with discrepant readings remained. This was done to eliminate cases that were inconclusive or nonassessable and thus simulate the situation of a tissue array without the control of a full section (Table 1) ▶ .
The concordance between full tissue sections and triplicate core arrays for Ki-67, p53, and pRB was 96, 98, and 91%, respectively. These results include 10% of evaluated cases for Ki-67 and pRB for which concordance was based on the dominant result of two tissue cores matching the full section and one core not matching the full section (Table 1) ▶ . This demonstrates the relevance of the third core for difficult cases. Despite the use of triplicate cores the nonconcordance for pRB was still 9%. This can be explained by the complexity of the staining pattern obtained for pRB requiring a three-category distinction. Statistically it is less likely to obtain identical readings for this three-category distinction than for the standard two-category distinctions used for Ki-67 and p53. This is clearly reflected by the low nonconcordance of 4 and 2% for these stains. The nonconcordance of 9% for pRB suggests that tissue array analysis of pRB or other three-category markers may not be technically feasible or readily applicable for clinicopathological analyses.
The few nonconcordant readings that we found, changed abnormal readings into normal readings and therefore lead to less frequent detection of abnormal expression patterns. Full tissue section analysis resulted in 10, 34, and 47% of cases in detection of abnormal expression of p53, Ki-67, and pRB, respectively. Corresponding rates of expression on the triplicate core tissue array were 8, 30, and 47%, respectively. These concordances suggest that triplicate cores on tissue arrays accurately reflect IHC results from full section analysis. This is supported by strong statistical associations between the two methods with kappa values of >0.853.
In this context, it must be emphasized that the selection of areas on hematoxylin and eosin-stained full sections from tissue blocks based on tumor morphology are crucial for the assembly of a tissue array. This requires meticulous attention of the investigator before the array is constructed and data are evaluated. Thus, it is ensured that the resulting arrays potentially provide relevant information about tumor-specific immunophenotypes.
To identify potential changes in outcome correlations caused by differences between the two techniques we compared survival data with the two data sets obtained by full tissue sections and tissue arrays and analyzed for local recurrence-free survival and overall survival. As suggested by the strong association between the two methods no differences were detected in correlation on the basis of patient outcome. This suggests that tissue arrays will allow reliable clinicopathological analysis of tumor specimens. This observation is based on a relatively small cohort of patients (n = 59) that permits limited conclusions about the applicability of tissue microarrays for clinicopathological studies. However, the strong association between the two methods and the fact that even full section analysis often represents only a small portion of the whole tumor specimen but still allows identification of clinicopathologically relevant immunophenotypes is promising. Therefore, we believe that tissue microarray-derived data will be useful for clinicopathological studies.
In summary, our data demonstrate a high reliability of tissue array-based IHC using standard cut-off values established for full section analysis. The use of three tissue cores is preferable to one or two cores and IHC stains with two-category distinction should be preferred over more complex stains where possible. Such triplicate core biopsies of 0.6-mm diameter taken per specimen provide a reliable system for large-scale analysis of cancer tissues on tissue microarrays without compromising the efficiency of the array technology and may be useful tools for clinicopathological analysis.
Acknowledgments
We thank Dr. J. M. Woodruff and Dr. C. R. Antonescu for their expertise and support with histopathological confirmation of tumor specimens.
Footnotes
Address reprint requests to Carlos Cordon-Cardo, M.D., Ph.D., Division of Molecular Pathology, Memorial Sloan-Kettering Cancer Center, New York, NY 10021. E-mail: cordon-c@mskcc.org.
Supported by National Institutes of Health grant P01-CA47179 and the Gorin Fund.
References
- 1.Kononen J, Bubendorf L, Kallioniemi A, Barlund M, Schraml P, Leighton S, Torhorst J, Mihatsch MJ, Sauter G, Kallioniemi OP: Tissue microarrays for high-throughput molecular profiling of tumor specimens. Nat Med 1998, 4:844-847 [DOI] [PubMed] [Google Scholar]
- 2.Heslin MJ, Cordon-Cardo C, Lewis JJ, Woodruff JM, Brennan MF: Ki-67 detected by MIB-1 predicts distant metastasis and tumor mortality in primary, high grade extremity soft tissue sarcoma. Cancer 1998, 83:490-497 [DOI] [PubMed] [Google Scholar]
- 3.Cordon-Cardo C, Latres E, Drobnjak M, Oliva MR, Pollack D, Woodruff JM, Marechal V, Chen J, Brennan MF, Levine AJ: Molecular abnormalities of mdm2 and p53 genes in adult soft tissue sarcoma. Cancer Res 1994, 54:794-799 [PubMed] [Google Scholar]
- 4.Cance WG, Brennan MF, Dudas ME, Huang CM, Cordon-Cardo C: Altered expression of the retinoblastoma gene product in human sarcomas. N Engl J Med 1990, 323:1457-1462 [DOI] [PubMed] [Google Scholar]
- 5.Cordon-Cardo C: Mutation of cell cycle regulators. Biological and clinical implications for human neoplasia. Am J Pathol 1997, 147:545-560 [PMC free article] [PubMed] [Google Scholar]
- 6.Mucci NR, Akdas G, Manely S, Rubin MA: Neuroendocrine expression in metastatic prostate cancer: evaluation of high throughput tissue microarrays to detect heterogeneous protein expression. Hum Pathol 2000, 31:406-414 [DOI] [PubMed] [Google Scholar]
- 7.Cordon-Cardo C, Richon VM: Expression of the retinoblastoma protein is regulated in normal human tissues. Am J Pathol 1994, 144:500-510 [PMC free article] [PubMed] [Google Scholar]
- 8.Cote RJ, Dunn MD, Chatterjee SJ, Stein JP, Shi SR, Tran QC, Hu SX, Xu HJ, Groshen S, Taylor CR, Skinner DG, Benedict WF: Elevated and absent pRB expression is associated with bladder cancer progression and has cooperative effects with p53. Cancer Res 1998, 58:1090-1094 [PubMed] [Google Scholar]
- 9.Altman DG: Practical Statistics for Medical Research. 1996:pp 404-408 Chapman and Hall, London
- 10.Kaplan E, Meier P: Nonparametric estimation from incomplete observations. J Am Stat 1958, 53:457-481 [Google Scholar]
- 11.Peto R, Peto J: Asymptotically efficient rank invariant procedures. JR Stat Soc A 1972, 135:185-207 [Google Scholar]
- 12.Schraml P, Kononen J, Bubendorf L, Moch H, Bissig H, Nocito A, Mihatsch MJ, Kallioniemi OP, Sauter G: Tissue microarrays for gene amplification surveys in many different tumors types. Clin Cancer Res 1999, 5:1966-1975 [PubMed] [Google Scholar]
- 13.Richter J, Wagner U, Kononen J, Fijan A, Bruderer J, Schmid U, Ackermann D, Maurer R, Alund G, Knonagel H, Rist M, Wilber K, Anabitarte M, Hering F, Hardmeier T, Schonenberger A, Flury R, Jager P, Fehr JL, Schraml P, Moch H, Mihatsch MJ, Gasser T, Kallioniemi OP, Sauter G: High-throughput tissue microarray analysis of cyclin E gene amplification and overexpression in urinary bladder cancer. Am J Pathol 2000, 157:787-794 [DOI] [PMC free article] [PubMed] [Google Scholar]
- 14.Bubendorf L, Kononen J, Koivisto P, Schraml P, Moch H, Gasser TC, Willi N, Mihatsch MJ, Sauter G, Kallioniemi OP: Survey of gene amplifications during prostate cancer progression by high-throughput fluorescence in situ hybridization on tissue microarrays. Cancer Res 1999, 59:803-806 [PubMed] [Google Scholar]
- 15.Drobnjak M, Latres E, Pollack D, Karpeh M, Dudas M, Woodruff JM, Brennan MF, Cordon-Cardo C: Prognostic implications of p53 nuclear overexpression and high proliferation index of Ki-67 in adult soft tissue sarcomas. J Natl Cancer Inst 1994, 86:549-554 [DOI] [PubMed] [Google Scholar]
- 16.Levine AJ, Momand J, Finlay CA: The p53 tumor suppressor gene. Nature 1991, 351:453-456 [DOI] [PubMed] [Google Scholar]
- 17.Hoos A, Lewis JJ, Antonescu CR, Dudas ME, Leon L, Woodruff JM, Brennan MF, Cordon-Cardo C: Characterization of molecular abnormalities in human fibroblastic neoplasms—a model for genotype-phenotype association in soft tissue tumors. Cancer Res 2001 (in press) [PubMed]